

 REGISTER OR LOG INJune 15–18 / San Francisco + VirtualREGISTER OR LOG INJune 15–18 / San Francisco + VirtualREGISTER OR LOG INJune 15–18 / San Francisco + VirtualREGISTER OR LOG INJune 15–18 / San Francisco + VirtualREGISTER OR LOG INJune 15–18 / San Francisco + VirtualREGISTER OR LOG INJune 15–18 / San Francisco + VirtualREGISTER OR LOG INJune 15–18 / San Francisco + VirtualREGISTER OR LOG INJune 15–18 / San Francisco + VirtualREGISTER OR LOG INJune 15–18 / San Francisco + VirtualREGISTER OR LOG INJune 15–18 / San Francisco + Virtual
Featured speakers
Data + AI Summit speakers include leading experts, researchers and open source contributors — from Databricks and across the data and AI community.
Ali
Ghodsi
Co-founder and CEO,
Databricks
Satya
Nadella
Chairman and Chief Executive Officer, Microsoft,
*pre-recorded

Greg
Brockman
President and Co-Founder,
OpenAI

Magesh
Bagavathi
Global Chief Data and AI Officer,
PepsiCo

Federico Cohen
Freue
Executive Vice President, AI and Data Operations,
Mastercard

Sinna Lia
Vange
Principal IT Solution Architect,
Novo Nordisk

James
Maki
Sr. Solution Architect,
NVIDIA

Axel
Torbenson
Field Engineer,
Replit
Kasey
Uhlenhuth
Director, Product Management,
Databricks

Jeff
Wang
CEO, Windsurf/Incoming President,
Cognition

Harrison
Chase
Co-Founder and CEO,
LangChain

Jackie
Bow
Engineering,
Anthropic

Mr.Mukesh D.
Ambani
Chairman and Managing Director, Reliance Industries Limited,
*pre-recorded

Matei
Zaharia
Original Creator of Apache Spark™ and MLflow; CTO,
Databricks

Reynold
Xin
Co-founder and Chief Architect,
Databricks

Ashwin
Sreenivas
CTO and Co-founder,
Decagon

Angie
Ruan
CTO, Capital Access Platforms,
Nasdaq

Ashpreet
Bedi
CEO,
Agno

Jerry
Liu
Co-founder and CEO,
LlamaIndex

Nicole
Catalino
Staff Product Manager,
Fox Corporation

T.R
Vishwanath
Co-founder and CTO,
Glean

Collin
Brosko
Senior Staff Technical Program Manager,
Rivian Automotive

Tom
Barber
Head of BI and Advanced Analytics,
Virgin Atlantic

Paul
Kuntz
Commercial Data Lake Capability Lead,
AstraZeneca Pharmaceuticals

Michael
Jones
Senior Director of Software Engineering,
Warner Music Group

Kai
Pak
Director of Engineering,
Princeton University

Abhishek
Gupta
Chief Product Officer,
Retool

João (Joe)
Moura
CEO,
crewAI
PREVIEW OUR SESSIONS
Choose from 800+ sessions spanning the full spectrum of data intelligence, from data engineering, warehousing and governance to analytics, applications, agents and AI.
AI Agents for the Frontline: 7-Eleven’s GenAI Maintenance Assistant
Beyond the Trace: adidas’ Agent Digital Twin for Governance, Cost and ROI
Building the Commercial Lakehouse: AI-Driven, Open and Interoperable
Data Governance at Scale with ABAC at Atlassian
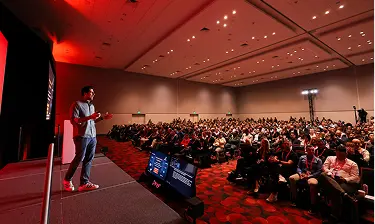
Why Attend
Join thousands of data leaders, engineers, scientists and architects to explore the convergence of data and AI and the future of data-intelligent apps and agents.
learn
Discover the Latest Technologies
Explore the latest advances in Delta Lake, Apache Iceberg™, Apache Spark™, MLflow, Unity Catalog, Lakeflow, Databricks Apps, Databricks SQL and Lakebase — alongside agentic AI systems, AI/BI and open source frameworks such as DSPy, LangChain, PyTorch, dbt and Trino.
NETWORK
Make Meaningful Connections
Interact with thousands of your peers from the data and AI community, and grow your professional network through social meetups, the Expo and exclusive event parties.
LEVEL UP YOUR SKILLS
Access Training and Certification
Sharpen your expertise with instructor-led, half-day training. Boost your credentials with our hands-on, lab-based format and get onsite certifications.
AI/machine learning engineers, data scientists, data engineers and practitioners, app developers, database administrators, business executives, IT decision-makers, product managers, entrepreneurs, investors and more.
The premier event for the global data, analytics and AI community. Summit brings together data practitioners, leaders and visionaries from more than 160 countries to explore the latest technologies and trends. Attendees can also participate in conference training and brand-new certification courses.
The conference will take place at Moscone North, West and South (the address is 747 Howard Street, San Francisco, CA 94103). Some events and activities may be a short walking distance from Moscone.
We’ve partnered with several hotels in San Francisco offering special group rates for attendees. Book through the Data + AI Summit registration page to receive the event rate (subject to availability). See the list of recommended hotels, all conveniently located near Moscone Center. Due to the World Cup being hosted nearby, we recommend you book your hotel early.
The full conference all-access pass will include keynotes, Expo, breakout sessions, networking events and virtual access.
Sponsors
Data + AI Summit couldn’t happen without our awesome sponsors. Interested in sponsoring? Reach out to our Sponsorship Management team to learn about available opportunities.


