CALL FOR PRESENTATIONS NOW OPEN
Share your expertise with the data, analytics and AI community

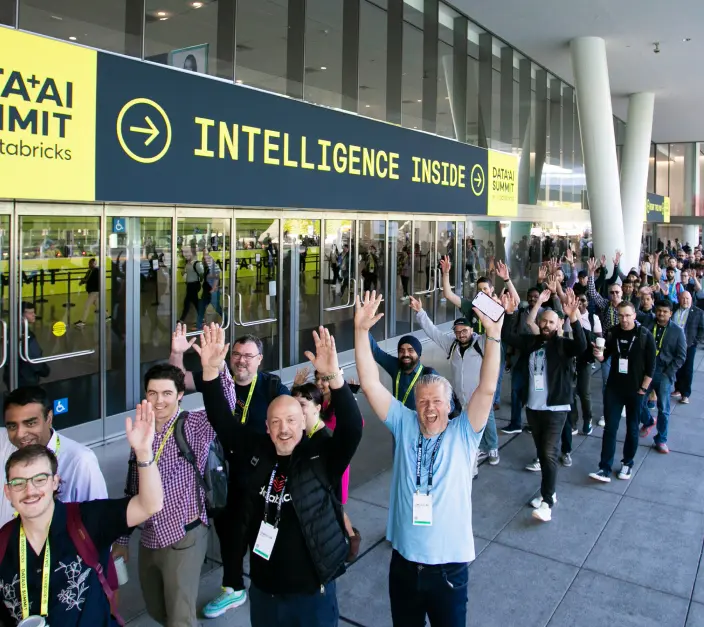
Save the date
June 15–18, 2026
The premier event for the global data, analytics and AI community. Sign up to be notified when Data + AI Summit registration opens. Please complete all fields.
Join our lineup. Past speakers include:
Ali
Ghodsi
Co-founder and CEO,
Databricks

Jamie
Dimon
Chairman and CEO,
JPMorgan Chase
Satya
Nadella
Chairman and CEO,
Microsoft
*pre-recorded

Dario
Amodei
Co-founder and CEO,
Anthropic
Thomas
Kurian
CEO,
Google Cloud

Kasey
Uhlenhuth
Director of Product Management,
Databricks

Aditya
Gautam
Machine Learning Lead,
Meta

Zeynep
Ozdemir
Chief Marketing Officer,
Atlassian Pty Ltd.

Joshua
Sayah Lee
Lead Global D&AI Solution Architect,
PepsiCo Inc.

Nikita
Shamgunov
Co-founder and CEO,
Neon

Reynold
Xin
Co-founder and Chief Architect,
Databricks

Joana
Ferreira
ML Engineer,
Adidas AG

Calen
Holbrooks
Vice President, Marketing,
Airtable

Matei
Zaharia
Original Creator of Apache Spark™ and MLflow; CTO,
Databricks

Andrew
Hinton
Principal Data Scientist,
CVS Health

Aparna
Dhinakaran
Co-Founder and Chief Product Officer,
Arize
Sessions
With 700+ sessions, intelligence grows exponentially. Here are some of the highlights from Data + AI Summit 2025.
Self-Service Assortment and Space Analytics at Walmart Scale
Optimizing EV Charging Experience: Machine Learning for Accurate Charge Time Estimation
Evolving Data Insights With Privacy at Mastercard
Powering Secure and Scalable Data Governance at PepsiCo With Unity Catalog Open APIs
Sponsors
Summit wouldn’t happen without our awesome sponsors. Want to join them? Find out about sponsorship opportunities by emailing [email protected].


