Databricks용 시맨틱 데이터 레이어 구동을 위한 지식 그래프 활용
작성자: Prasad Kona , Aaron Wallace
이 게시물은 Databricks와 Stardog의 협력으로 작성되었습니다. 기여해주신 Stardog의 선임 제품 관리자 Aaron Wallace님께 감사드립니다.
지식 그래프는 우리가 인지하지 못하는 사이에 이미 보편화되었습니다. 우리는 Google에서 검색하거나, 아는 사람들의 소셜 미디어 계정 피드를 보거나, 팔로우하는 회사나 좋아하는 콘텐츠를 볼 때 매일 이를 경험합니다. 이와 유사하게, 엔터프라이즈 지식 그래프는 조직의 콘텐츠, 데이터 및 정보 자산을 구조화하는 기반을 제공합니다. 이는 챗봇에서 추천 엔진에 이르는 모든 데이터 기반 애플리케이션에 답변, 추천 및 인사이트 형태로 지식을 추출, 연결 및 제공하거나, BI 및 분석 기능을 강화하는 방식으로 이루어집니다.
이 블로그에서는 Databricks와 Stardog가 데이터 및 인사이트 민주화의 마지막 한 걸음 과제를 어떻게 해결하는지 알아봅니다. Databricks는 멀티 클라우드 플랫폼에서 데이터, 분석 및 인공지능(AI) 워크로드를 위한 레이크하우스 플랫폼을 제공합니다. Stardog는 사람, 장소, 사물 및 그 관계를 설명하기 위해 방대하고 단순히 크기만 한 것이 아닌 데이터에 대해 복잡한 관계를 모델링할 수 있는 지식 그래프 플랫폼을 제공합니다. Stardog의 지식 그래프 기반 시맨틱 레이어와 결합된 Databricks Lakehouse Platform은 조직에 엔터프라이즈 데이터 패브릭 아키텍처의 기반을 제공하여, 기능 간, 기업 간 또는 조�직 간 팀이 도메인 사일로를 넘어 복잡한 쿼리를 질문하고 답변할 수 있도록 합니다.
데이터 패브릭 아키텍처의 증가하는 필요성
데이터 관리 분야의 빠른 혁신과 변화는 조직이 기업 내부와 외부에서 사용 가능한 데이터로부터 가치를 창출하도록 돕고 있습니다. 물리적 및 디지털 경계를 넘어 운영되는 조직들은 고객이 원하는 방식으로 서비스를 제공할 새로운 기회를 찾고 있습니다.
이러한 조직들은 데이터 공급망 전반에 걸쳐 모든 관련 데이터를 연결하여 사용 사례의 맥락에서 완전하고 정확한 그림을 만듭니다. 데이터 조화 및 데이터 공유를 위해 조직 경계를 넘어 데이터를 운영하고 공유하려는 대부분의 산업은 금융 서비스 분야의 FIBO부터 사이버 보안 도메인의 D3FEND에 이르기까지, 규정된 온톨로지 형태의 개방형 표준을 채택하고 있습니다. 이러한 비즈니스 온톨로지(또는 시맨틱 모델)는 데이터가 어떻게 구조화되고 저장되는지, 즉 "문자열(strings)"보다는 의미가 부여된 데이터, 즉 "사물(things)"에 대해 우리가 어떻게 생각하는지를 반영하며, 데이터 공유 및 재사용을 가능하게 합니다.
시맨틱 레이어의 개념은 새로운 것이 아닙니다. 이는 30년 이상 존재해 왔으며, 종종 기업이 목적에 맞는 대시보드를 구축하도록 돕는 BI 공급업체에 의해 홍보되었습니다. 그러나 독점 BI 시스템의 일부로 해당 레이어가 내장된 특성 때문에 광범위한 채택이 방해받았습니다. 이 레이어는 종종 너무 경직되고 복잡하여, 실제 세계에서 데이터가 다대다(many-to-many)로 어떻게 관련되는지보다는 구조화된 쿼리 언어에 최적화되도록 데이터를 모델링하는 물리적 관계형 데이터베이스 시스템과 동일한 한계를 겪습니다. 스토리지 및 소비 레이어 사이에서 작동하는 지식 그래프 기반 시맨틱 데이터 레이어는 소수의 전문가를 제외하고는 데이터 중심 아키텍처에 참여하고 협력할 수 없는 시민 데이터 과학자 및 분석가에게 비즈니스 사용 사례의 맥락에서 가치를 제공하기 위해 모든 데이터를 연결하는 접착제이자 증폭기 역할을 합니다.
보험 관련 사용 사례 활성화
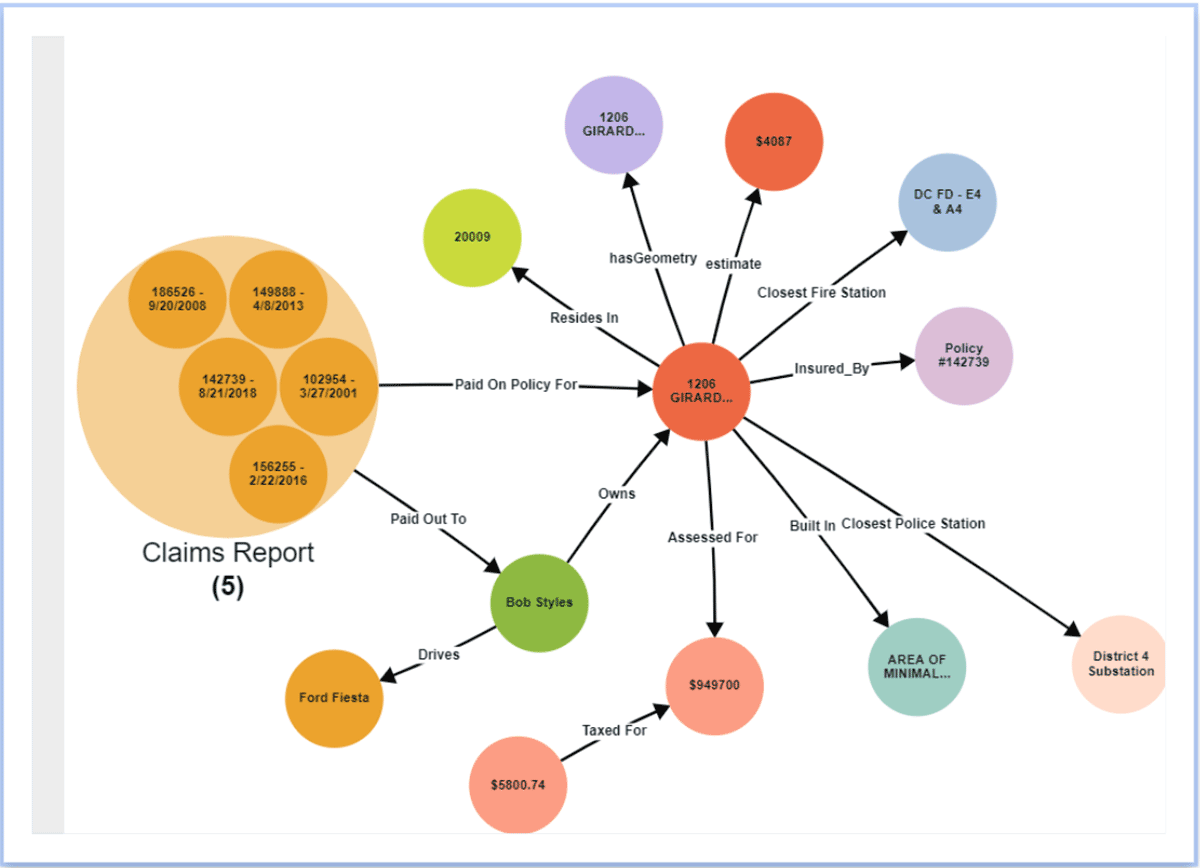
Stardog와 Databricks가 어떻게 협력하는지 보여주기 위해 다중 보험사를 운영하는 조직의 실제 사례를 살펴보겠습니다. 대부분의 대기업과 마찬가지로, 많은 보험 회사들은 주요 이해관계자의 의사 결정을 위한 내부 및 외부 소스 데이터의 광범위한 가용성 부족과 같은 유사한 데이터 문제로 어려움을 겪습니다. 보험 인수 위험 평가부터 정책 관리, 클레임 관리 및 대리점에 이르기까지 모든 부서가 중요한 결정을 내리기 위해 올바른 데이터와 인사이트를 활용하는 데 어려움을 겪습니다. 이들 모두는 데이터를 FAIR(Findable, Accessible, Interoperable, Reusable)하게 만들기 위한 현대적인 데이터 및 분석 아키텍처 요소를 제공하는 전사적 데이터 패브릭이 필요합니다. 대부분의 기업은 모든 데이터 소스를 데이터 레이크로 가져오는 것으로 여정을 시작합니다. Databricks 레이크하우스 접근 방식은 기업에 모든 분석 데이터를 저장하고 기업 내 모든 사람이 모든 데이터에 액세스할 수 있도록 하는 훌륭한 기반을 제공합니다. 이 데이터 레이어에서는 모든 정제, 변환 및 모호성 해소가 이루어집니다. 이 여정의 다음 단계는 데이터 조화로, 의미를 기반으로 데이터를 연결하여 더 풍부한 컨텍스트를 제공하는 것입니다. 지식 그래프가 제공하는 시맨틱 레이어는 데이터 분석 및 처리로 초점을 전환하고, 보험 인수자, 위험 분석가, 에이전트 및 고객 서비스 팀에 교차 도메인 인사이트의 연결된 패브릭을 제공하여 위험을 관리하고 탁월한 고객 경험을 제공합니다.
간소화된 시맨틱 모델을 시작점으로 삼아 이것이 어떻게 작동하는지 살펴보겠습니다.
도메인별 엔터티 및 교차 도메인 관계를 쉽게 모델링
화이트보드와 유사한 경험을 통해 시맨틱 데이터 모델을 시각적으로 생성하는 것은 시맨틱 데이터 레이어를 만드는 첫 단계입니다. Stardog Designer 프로젝트 내에서 클릭하기만 하면 비즈니스 질문에 답하는 데 중요한 특정 클래스(또는 엔터티)를 생성할 수 있습니다. 클래스가 생성되면 이 새로운 엔터티를 설명하는 데 필요한 모든 속성과 데이터 유형을 추가할 수 있습니다. 클래스(또는 엔터티)를 서로 연결하는 것은 쉽습니다. 엔터티를 선택한 상태에서 링크를 추가하고 새 관계의 지점을 다른 엔터티에 스냅될 때까지 드래그하기만 하면 됩니다. 이 새로운 관계에 비즈니스 의미를 설명하는 이름(예: "고객"이 "차량"을 "소유함")을 부여합니다.
새 클래스를 추가하고 기존 클래스에 연결하여 관계 생성
Databricks Lakehouse Platform에서 메타데이터 매핑
데이터 없는 모델이 무슨 의미가 있을까요? Stardog 사용자는 데이터 지속화 또는 가상화, 또는 이 둘의 조합을 통해 다양한 구조화된, 반구조화된, 비구조화된 데이터 소스에 연결할 수 있습니다. Designer에서는 Delta Lake와 같은 기존 소스에서 데이터를 쉽게 연결하여 사용자 지정 테이블의 메타데이터를 연결할 수 있습니다. 이를 통해 데이터를 지식 그래프로 이동하거나 ��복사하지 않고도 가상화 레이어를 통해 해당 데이터에 처음으로 액세스할 수 있습니다. 가상화 레이어는 Stardog에서 들어오는 쿼리를 개방형 표준 기반 SPARQL에서 Databricks SQL의 최적화된 푸시 다운 SQL 쿼리로 자동 변환합니다.
새 데이터 소스를 프로젝트 리소스로 추가
새 프로젝트 리소스를 추가하려면 클릭하고 Databricks와 같은 사용 가능한 연결 중 하나를 선택합니다. 이 연결은 Databricks에서 최근 출시한 새로운 SQL 엔드포인트를 활용합니다. 데이터의 범위를 정의하고 추가 속성을 지정합니다. 미리 보기 창을 사용하여 프로젝트에 추가하기 전에 데이터를 빠르게 확인합니다.
다양한 위치의 추가 데이터 통합
Designer를 사용하면 Delta의 데이터와 이 새로운 정보를 결합하여 임시 데이터 분석을 수행하려는 팀을 위해 CSV와 같은 다른 데이터 소스 및 파일의 데이터를 쉽게 통합할 수 있습니다. 리소스로 추가되면 링크를 추가하고 클래스로 드래그 앤 드롭하여 데이터를 매핑하기만 하면 됩니다. 매핑에 의미 있는 이름을 지정하고, 기본 식별자, 레이블 및 엔터티의 속성과 일치하는 기타 데이터 열에 대한 데이터 열을 지정합니다.
프로젝트 리소스의 데이터를 클래스에 매핑
작업 게시
Designer 내에서 이 프로젝트의 모델과 데이터를 Stardog Explorer에서 사용하기 위해 Stardog 서버에 직접 게시할 수 있습니다. Designer는 또한 지식 그래프의 출력을 다양한 방식으로 게시하고 소비할 수 있도록 합�니다. 모델 및 매핑을 포함한 파일의 압축 폴더로 버전 제어 시스템에 직접 게시할 수 있습니다.
Stardog 데이터베이스에 직접 게시
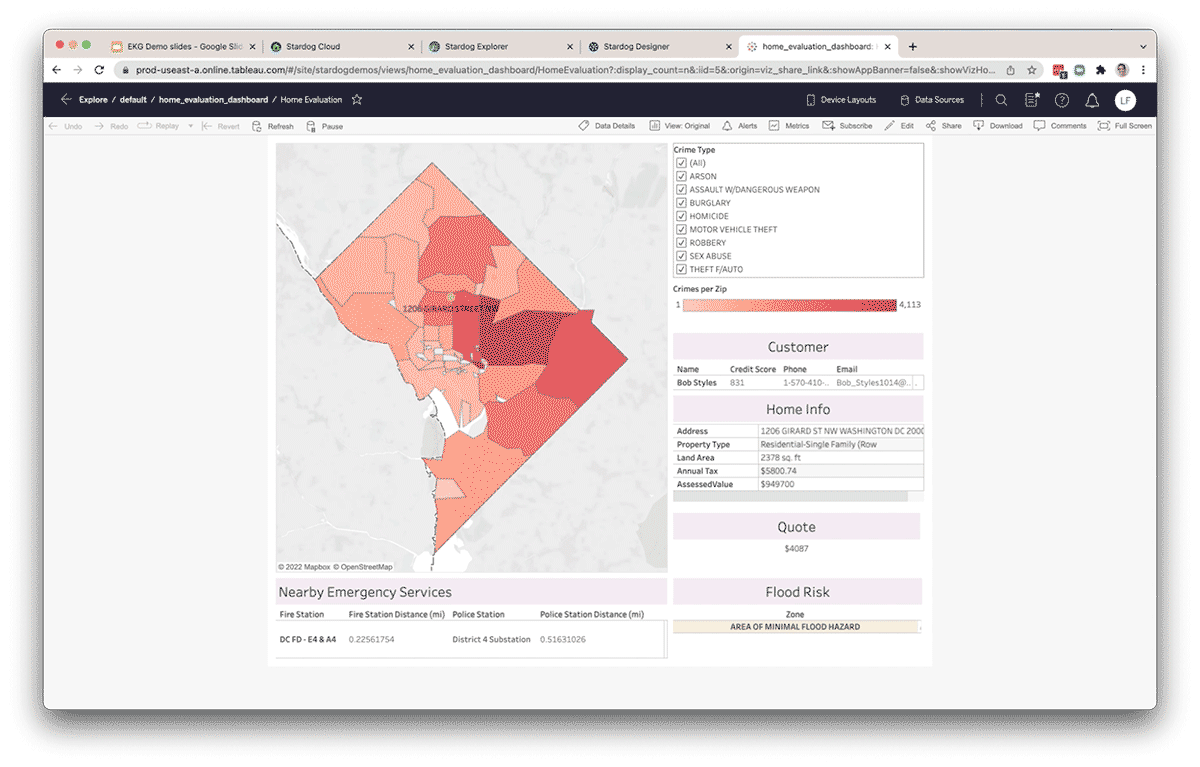
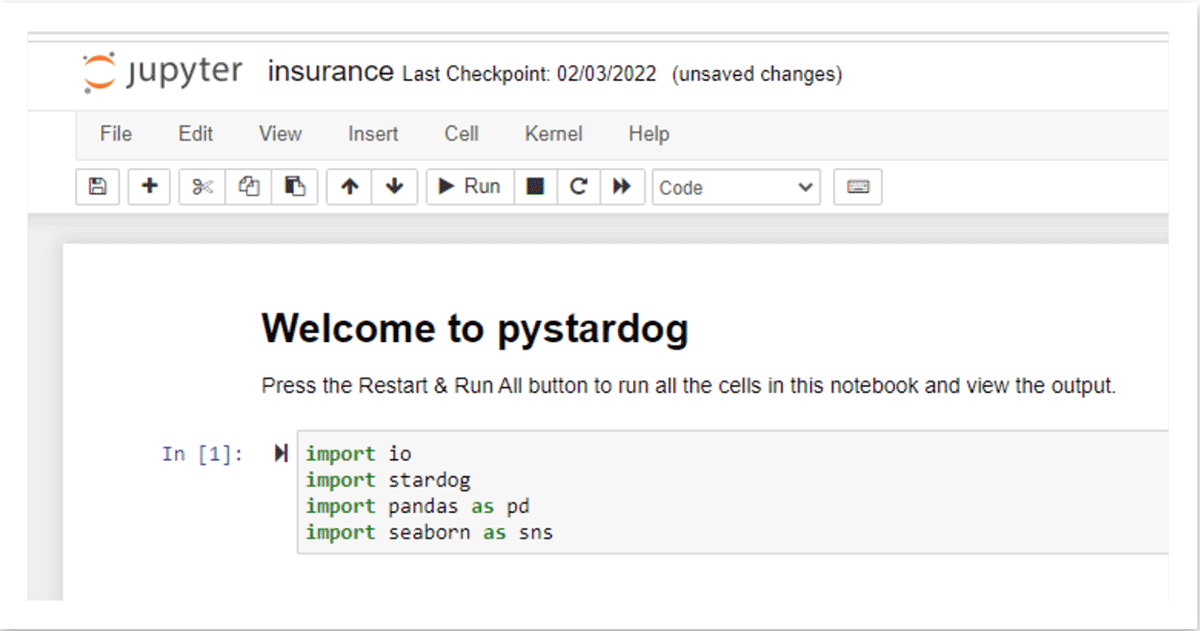
데이터가 Stardog에 게시되면, 데이터 분석가는 Tableau와 같은 인기 있는 BI 도구를 사용하여 Stardog의 BI/SQL 엔드포인트를 통해 연결하고, 시맨틱 레이어를 통해 데이터를 보고서나 대시보드로 가져올 수 있습니다. 모든 SQL 호환 도구 내의 자동 생성된 스키마를 통해 사용자는 Knowledge Graph에 대해 SQL 쿼리를 작성할 수 있습니다. SQL 레이어를 통해 들어오는 쿼리는 Knowledge Graph의 쿼리 언어인 SPARQL로 자동 번역되며, 가상 레이어를 통해 자동 생성된 소스 최적화 쿼리를 사용하여 소스(이 경우 Databricks SQL 엔드포인트를 통한 Databricks)에서 계산을 위해 푸시다운됩니다. 동일한 정보는 Stardog의 Python API인 pystardog를 사용하여 노트북에서 Databricks 사용자에게도 제공될 수 있습니다. 또한 Stardog의 GraphQL API를 사용하여 가상 그래프를 애플리케이션 내에 직접 임베드하여 사용할 수도 있습니다. 레이크하우스 위에 있는 시맨틱 레이어는 모든 유형의 사용자와 선호하는 도구를 위한 단일 환경을 제공하며, 일관된 데이터 세트로 운영을 지원합니다.
생산성 향상 및 새로운 인사이트 개발
Knowledge Graph에 데이터를 구성함으로써, 데이터 팀은 임시 데이터 분석을 지원하기 위해 외부 소스에서 데이터를 정리하는 데 소요되는 시간을 줄여 생산성을 높일 수 있습니다. Databricks 외부의 데이터는 Stardog의 가상화 레이어를 통해 연동되어 Databricks 내부의 데이터와 연결될 수 있습니다. 또한, 통계적 및/또는 논리적 추론과 같은 기술을 사용하여 엔티티 간의 새로운 관계를 Knowledge Graph에 명시적으로 모델링하��지 않고도 추론할 수 있습니다. Databricks와 Stardog는 원활하게 연동되므로, 이 조합은 복잡한 교차 도메인 쿼리 및 분석을 단순화하는 진정한 엔드투엔드 경험을 제공합니다. 더욱이, 시맨틱 레이어는 엔터프라이즈 데이터 패브릭 기반의 일부로서 살아있고, 공유 가능하며, 사용하기 쉬운 레이어가 되어 새로운 데이터 기반 이니셔티브를 지원하는 전사적 지식을 제공합니다.
Databricks 및 Stardog 시작하기
이 블로그에서는 Stardog가 Databricks Lakehouse Platform 위에 Knowledge Graph 기반의 시맨틱 데이터 레이어를 어떻게 구현하는지에 대한 개요를 제공했습니다. 심층적인 개요를 보려면 저희의 심층 데모를 확인해 보세요. Stardog는 지식 근로자에게 연결된 데이터 자산의 우주 전반에 걸쳐 중요한 적시 인사이트를 제공하여 분석 능력을 강화하고 데이터 레이크 투자 가치를 가속화합니다. Databricks와 Stardog를 함께 사용함으로써, 데이터 및 분석 팀은 조직의 성장하는 요구 사항에 맞춰 발전하는 데이터 패브릭을 신속하게 구축할 수 있습니다.
Databricks 및 Stardog를 시작하려면 아래에서 무료 체험을 신청하세요:
https://www.databricks.com/try-databricks
https://cloud.stardog.com/get-started
https://www.stardog.com/learn-stardog/
(이 글은 AI의 도움을 받아 번역되었습니다. 원문이 궁금하시다면 여기를 클릭해 주세요)
최신 게시물을 이메일로 받아보세요
블로그를 구독하고 최신 게시물을 이메일로 받아보세요.