PySpark UDF の統合プロファイリングのご紹介
統合プロファイリングを用いたPySpark UDFの最適化:パフォーマンスとメモリの洞察力を強化
によって Xinrong Meng 、 植品拓也 による投稿
- PySpark UDF統合プロファイリングの紹介 - Databricks Runtime 17.0のUDFのパフォーマンスとメモリプロファイリングが、実行とリソース使用の最適化にどのように役立つかを学びます。
- パフォーマンスの向上とデバッグ – 関数呼び出し、実行時間、メモリ消費を追跡してボトルネックを特定し、効率を向上させる方法を探求します。
- レガシープロファイリングを統合アプローチに置き換える - 新しいSparkSessionベースのプロファイリングの利点、Spark Connectとの互換性、プロファイリング結果の有効化、視覚化、管理方法を理解します。
私たちは、Databricks Runtime 17.0の一部としてPySparkユーザー定義関数(UDFs)のための統合プロファイリングをリリースすることを嬉しく思います(リリースノート)。PySpark UDFsのための統合プロファイリングは、開発者が自分のPySpark UDFsのパフォーマンスとメモリ使用量をプロファイルし、関数呼び出し、実行時間、メモリ使用量、その他のメトリクスを追跡することを可能にします。これにより、PySpark開発者は容易にボトルネックを特定し、対処することができ、より速く、よりリソース効率的なUDFsを実現します。
統合プロファイラは、以下に示すように、ランタイムSQL設定の「spark.sql.pyspark.udf.profiler」を「perf」または「memory」に設定することで、パフォーマンスプロファイラまたはメモリプロファイラを有効にすることができます。
レガシープロファイリングの代替
レガシープロファイリング[1, 2]はSparkContextレベルで実装されていたため、Spark Connectとは連携して動作しませんでした。新しいプロファイリングはSparkSessionベースで、Spark Connectに適用され、ランタイムで有効または無効にすることができます。「show」および「dump」コマンドを提供することで、プロファイル結果を視覚化し、ワークスペースフォルダに保存することで、レガシープロファイリングとのAPIの整合性を最大化します。さらに、要求に応じてプロファイル結果を管理し、リセットするための便利なAPIを提供します。最後に、これはレガシープロファイリングではサポートされていなかった登録UDFをサポートしています。
PySparkパフォーマンスプロファイラ
PySparkパフォーマンスプロファイラは、Pythonの組み込みプロファイラを利用して、ドライバと分散方式で実行されるUDFにプロファイリング機能を拡張します。
PySparkパフォーマンスプロファイラの動作を見るための例に深く入りましょう。以下のコードをDatabricks Runtime 17.0のノートブックで実行します。
added.show()コマンドは、以下に示すようにパフォーマンスプロファイリング結果を表示します。
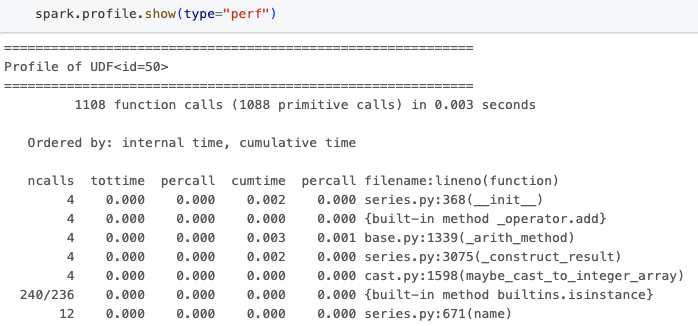
出力には、関数呼び出しの数、指定された関数で過ごした合計時間、ファイル名、およびナビゲーションを支援する行番号などの情報が含まれます。この情報は、PySparkプログラムのタイトループを特定し、パフォーマンスを改善するための決定を下すのに不可欠です。
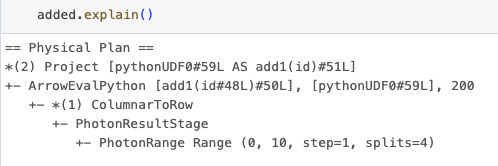
これらの結果におけるUDF idが、Sparkプランで見つかったものと直接相関していることに注意が必要です。これは、データフレームに対してexplainメソッドを呼び出すときに明らかになる「ArrowEvalPython [add1(...)#50L]」を観察することでわかります。
最後に、以下に示すようにプロファイリング結果をフォルダにダンプし、結果プロファイルをクリアすることができます。
PySparkメモリプロファイラ
これはメモリプロファイラに基づいており、ドライバのプロファイルを作成することができます。詳細はこちらをご覧ください。PySparkは、分散して実行されるエクゼキュータ上で実行されるUDFのプロファイリングを含むように使用範囲を拡大しました。
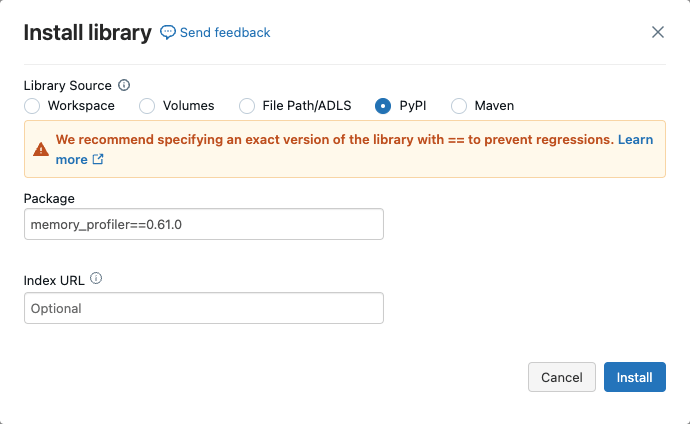
クラスターでメモリプロファイリングを有効にするには、以下に示すようにクラスターにメモリプロファイラをインストールする必要があります。
上記の例では、最後の2行を次のように変更します:
その後、以下に示すようにメモリプロファイリング結果を取得します。
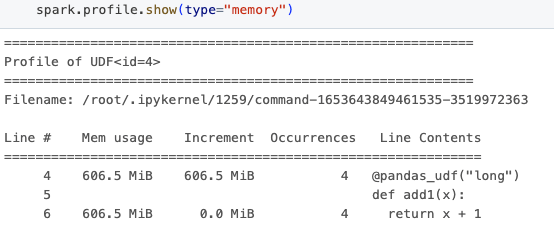
出力には、メモリ使用量の観点からコードのパフォーマンスを包括的に把握するためのいくつかの列が含まれています。"Mem usage"は、その行を実行した後のメモリ使用量を示します。"Increment"は前の行からのメモリ使用量の変化を詳細に示し、メモリ使用量が急増する場所を見つけるのに役立ちます。"Occurrences"は各行が実行された回数を示します。
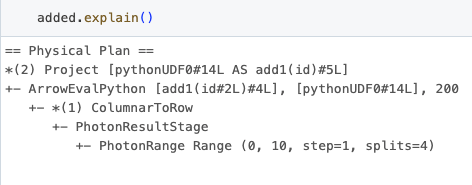
これらの結果のUDF idは、Spark計画で見つかったものと直接相関し、パフォーマンスプロファイリング結果と同じで、データフレームのexplainメソッドを呼び出すときに明らかになる“ArrowEvalPython [add1(...)#4L]”を観察することでわかります。
この機能を使用するためには、memory-profilerパッケージがクラスタにインストールされている必要があることに注意してください。
まとめ
PySpark統合プロファイリングは、UDFのパフォーマンスとメモリプロファイリングを含み、Databricks Runtime 17.0で利用可能です。統合プロファイリングは、関数呼び出しの頻度、実行時間、メモリ消費量などの重要な側面を観察するための効率的な方法を提供します。ボトルネックの特定と解決のプロセスを簡素化し、より高速でリソース効率的なUDFの開発を促進します。
もっと探求してみませんか?PySpark APIドキュメンテーションをチェックして、詳細なガイドと例を確認してください。
最新の投稿を受信トレイで受け取る
ブログを購読して、最新の投稿を受信トレイにお届けします。