How Indra unified EV charging data on Databricks
From fragmented tools to governed self-service analytics
by Jack Yallop
- Indra unified EV charging, fleet, and operational data on Databricks after starting with multiple Azure tools and duplicated pipelines.
- The company reduced platform sprawl, improved governance, and replaced manual reporting and brittle functions with a single governed data platform.
- The result was lower cost, faster queries, self-service dashboards, and a foundation for streaming and AI.
When data grows faster than the systems around it, complexity becomes the default. That was the challenge for Indra Renewable Technologies, one of the fastest-growing electric vehicle (EV) charging companies in the United Kingdom, which designs, engineers, and manufactures smart chargers for commercial and home locations. As their data estate expanded, so did the number of tools, pipelines, and costs attached to it.
The result was familiar: fragmented systems, duplicated logic, and a lot of time spent maintaining infrastructure instead of using data to move the business forward.
Indra’s response was not to add another point solution. It was to consolidate on Databricks, creating a single governed platform for analytics, reporting, and self-service access across the business.
Watch Indra's CTO Matthew Noonan and Data Engineer Meghana Ganatra share their journey with Databricks.
Indra’s journey with Databricks began with a parallel prototype migration from Synapse. Once the results met expectations, the team expanded to monthly Delta tables, consolidated its fleet pipeline, and shifted more operational load from Cosmos DB to Databricks. The next phase focused on making the governed data useful beyond engineering, with automated AI/BI dashboards and Genie Agents giving business teams direct access to answers.
The starting point: too many tools, too much overhead
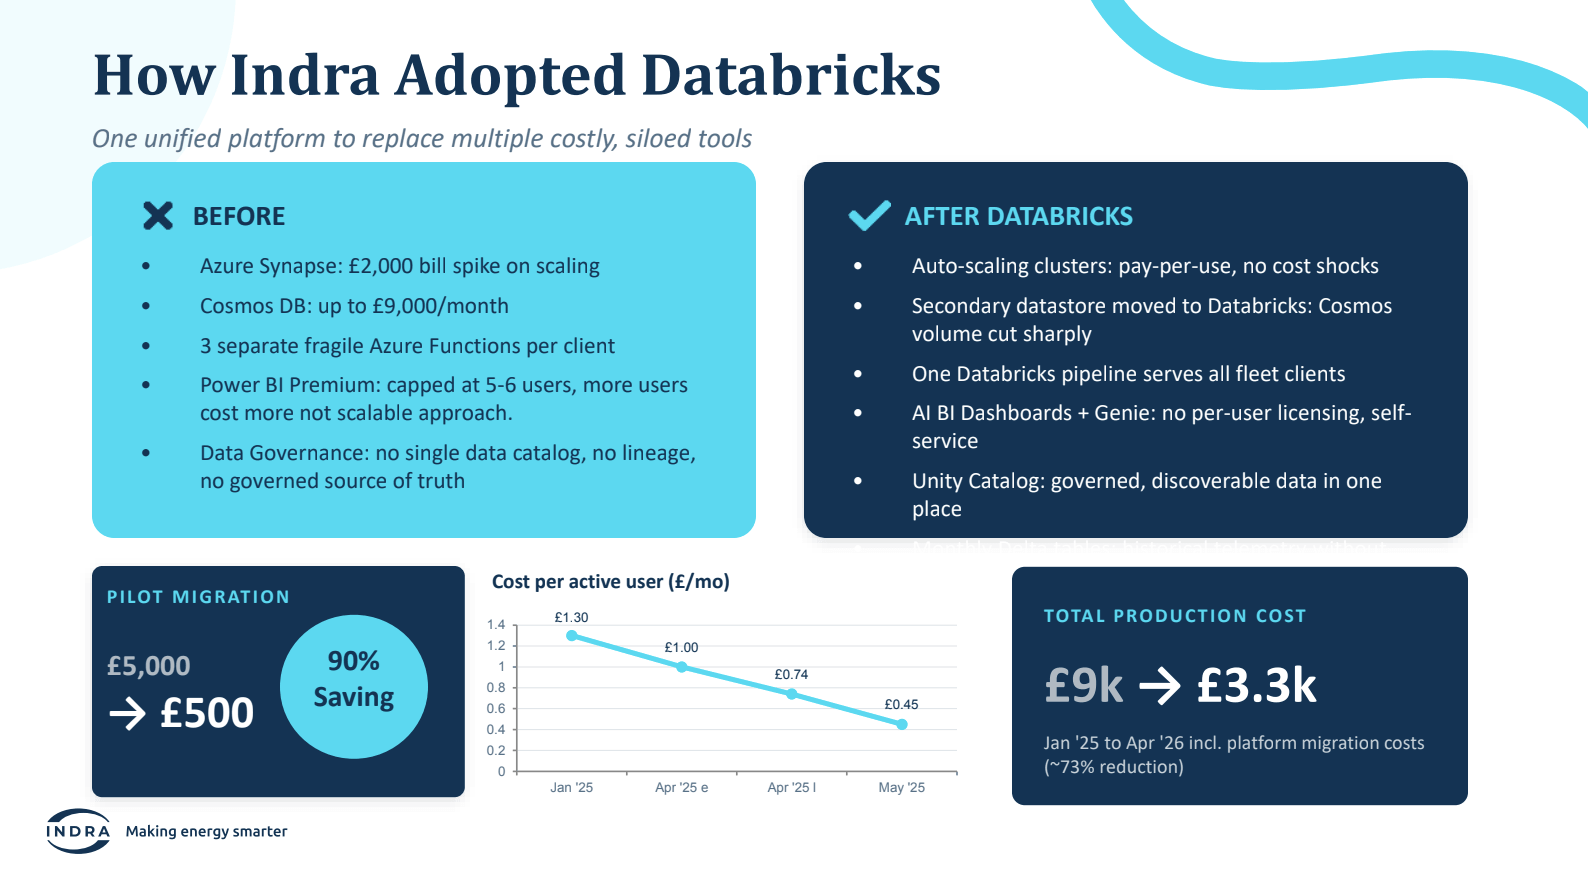
Indra’s data was spread across Cosmos DB, Synapse, Azure Data Lake Storage, Azure Functions, Power BI, and other Azure services. Each use case had evolved its own path.
That created a few problems:
- Costs grew organically across multiple tools
- Pipelines were built individually, with little standardization
- Data was fragmented
- Governance was limited, with no single catalog or lineage view
- Business teams still depended on data teams for routine numbers
The architecture worked, but it was expensive and difficult to scale cleanly.
Why a single platform mattered
Databricks gave Indra a way to bring these pieces together.
Instead of maintaining multiple separate services, the team moved to one platform with governed datasets, standardized workflows, and central visibility through Unity Catalog. That shift changed the operating model as much as the technology stack.
The team no longer had to treat every use case as a separate build. They could build once on top of governed data and reuse the platform across teams and workloads.
In practice, that meant one centralized data platform serving multiple use cases, rather than a siloed set of tools sitting beside each other.
What changed for engineering, business users, and clients
The benefits were not limited to the data team:
- For engineering, Databricks became the foundation for building on governed datasets rather than scattered sources
- For business users, it reduced the need to request numbers from the data team
- For external clients, it created a single source of truth delivered from one platform
- And for the data team, it made the system easier to support, more scalable, and simpler to extend
That shift from fragmentation to standardization is one of the biggest gains in any platform consolidation: the value is not only in lower costs, but in fewer handoffs and less operational friction.
Replacing fragile pipelines with a medallion architecture
One of Indra’s clearest examples was its fleet data pipeline.
Previously, the system relied on multiple Azure functions and separate stages to move data through the stack. The pipeline ingested telemetry and transactions, processed them through a chain of services, and then pushed outputs to reporting tools or client delivery layers.
The new architecture simplified that path. Using a medallion design, Indra brought its fleet data into a bronze layer as the raw single source of truth, transformed it in silver with PySpark, and published business-ready gold tables for reporting and client delivery.
That consolidation removed the need for three legacy Azure functions and allowed one pipeline to serve three clients on a daily schedule.
The impact was straightforward:
- One codebase instead of duplicate logic
- Fewer moving parts to maintain
- 60% to 70% performance improvement over the legacy functions
Turning reporting into self-service
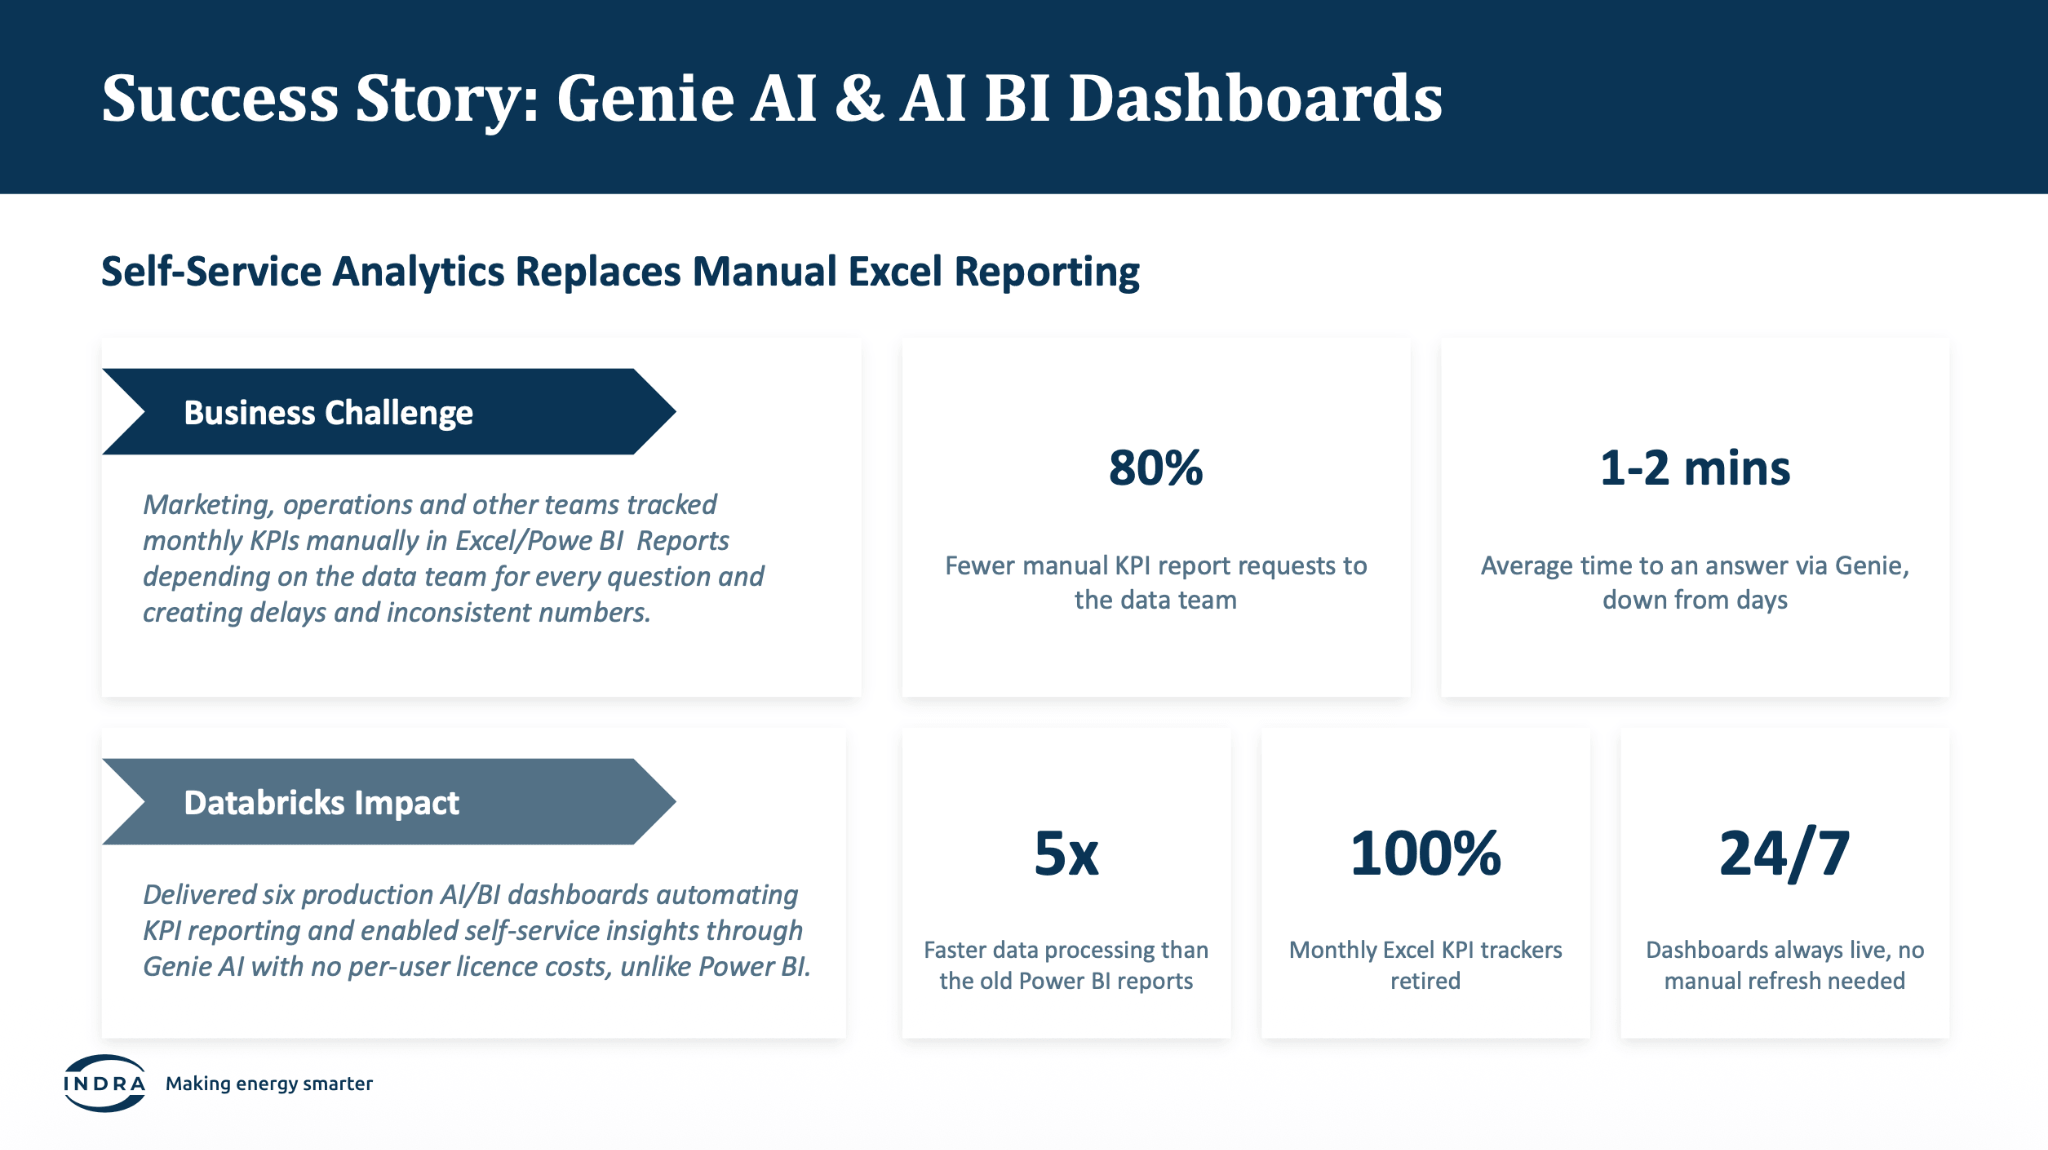
Indra also tackled a common pain point: manual reporting. Monthly KPIs had been tracked in Excel, and some reporting had lived in Power BI with licensing constraints. That slowed decision-making and kept business users dependent on the data team.
The new production pattern runs from governed gold tables in the medallion architecture, cataloged through Unity Catalog, and served through a serverless SQL warehouse. AI/BI dashboards refresh automatically on schedule and have replaced the manual Excel trackers previously maintained by marketing, operations, and other teams. With Genie One embedded directly in the dashboard canvas, users can move from a fixed visual to a natural-language conversation with the underlying data without leaving the page.
The dashboards support practical operational decisions. A Device Voltage Report monitors compliance across the in-field charger population, while the Charger Uptime Analysis dashboard helps teams understand fleet health, for example, showing 14,975 devices with an average uptime of 90.25% over a selected period. A Grid Voltage dashboard for Worcester adds geographic context, helping the team identify overvoltage and undervoltage hotspots and understand where local conditions may affect charger design.
Genie Agents extend the same governed data to conversational analysis. Indra has Agents for telemetry, device firmware, and users, devices, and vehicles. A marketing or operations user can ask how many devices delivered power to EVs in a given month; engineering can check device counts by model or firmware version; and product teams can explore the vehicle makes represented on the platform. Genie generates the SQL, returns the result, and supports follow-up questions without requiring a new request to the data team.
Together, these capabilities automate reporting, keep dashboards updated without manual refresh, let users ask questions in plain English, and give teams answers without waiting for ad hoc support—moving routine questions from days to minutes while creating a shared, governed view of the data.
The numbers behind the shift and what they enable
Indra’s architectural simplification delivered measurable results:
- 80-90% business cost savings from the Synapse to Databricks migration, alongside 90% storage cost savings
- Per active user cost reduced from £1.30 in January to 45p in May
- Query latency improved from 24.4 seconds to 3.5 seconds
These gains came from a broader change in how Indra handled data: fewer systems, more reuse, and a governed data platform that supports current reporting, operational monitoring, and future AI work. The value of data increases when more people can use it. A governed platform is not just a control layer; it is what makes self-service practical.
From platform consolidation to data-driven operations
EV charging is a data-intensive environment. Chargers generate telemetry continuously, local grid conditions vary, and operational performance can change quickly. That makes it important to have a system that is both reliable and flexible.
Indra’s dashboards and Genie spaces help the team monitor that environment without forcing every question through the data team. Its architecture also leaves room for the next step: streaming, Delta tables, Lakeflow pipelines, and future AI-driven use cases.
The team’s advice is practical: stay curious, read the documentation, ask questions early, collaborate with Databricks experts, and keep exploring new capabilities. That mindset matters because platform value compounds over time. The first win may be cost reduction; the bigger win is when the same platform starts unlocking new ways of working across the business.
Indra’s journey shows what happens when a fragmented data estate is replaced with a governed platform built for reuse. The company reduced costs, simplified operations, improved performance, and gave business users faster access to the numbers they need. Just as importantly, it laid the foundation for streaming and AI without adding further sprawl.
For teams facing the same mix of tool fragmentation, rising costs, and manual reporting, the lesson is simple: standardize the platform first, then scale the use cases from there.
Ready to learn more? Watch the full demo and expert deep-dive from our Energy Virtual Industry Forum: Power the energy transition with unified data, real-time insights, and AI at scale.
FAQ
What data challenges do EV-charging companies face?
Data often spans databases, cloud storage, BI tools, and separate pipelines, creating duplicated logic, fragmented telemetry, limited governance, and rising costs. A unified platform provides consistent, governed metrics.
How does Databricks enable self-service EV analytics?
Genie One lets users query governed telemetry, device, firmware, and vehicle data in natural language, while dashboards provide consistent metrics and operational context.
How can EV-charging companies prepare for streaming and AI?
A governed Databricks foundation supports reporting today while providing a path to streaming, Delta tables, Lakeflow pipelines, and AI without adding platform sprawl.
What does Databricks offer energy companies?
Databricks combines data engineering, SQL analytics, machine learning, and AI for smart-meter analytics, grid monitoring, EV charging, demand forecasting, theft detection, and regulatory reporting.
Get the latest posts in your inbox
Subscribe to our blog and get the latest posts delivered to your inbox.