Top 5 System Table Queries for Understanding Your Databricks Costs
Five SQL queries that surface cost trends, attribute spend by team, flag anomalies, and forecast next month's bill
- See where your money is going today, not next month. Three SQL queries break down Databricks spend by product, SQL warehouse, and team, using system tables that refresh in near real time.
- Catch cost spikes the day they happen. A rolling 14-day baseline flags anomalous days against a moving average, ready to wire into a DBSQL alert.
- Project where you're headed. AI_FORECAST extrapolates your recent usage into a 30-day spend projection in a single query — no manual time-series modeling.
Databricks system tables provide a wealth of information into how you use Databricks and what it costs. Focusing in on cost, the `system.billing.usage` table provides a globally aggregated view on costs for your entire Databricks account and it along with the `system.billing.list_prices` can give you deep insight into where spend is being allocated. Databricks offers a prebuilt Usage Dashboard that provides an excellent starting point for understanding costs but understanding the underlying tables and building queries on them allows you take your insights to the next level, especially when leveraging the visualization capabilities of Databricks.
Below are five queries to use as a starting point in better understanding your spend. We start with a simple daily breakdown of spend by product, then progress to understanding spend through the lens of specific SQL Warehouses and Tags, and finally identify days with anomalous spend as well as forecasting future spend with AI. All of the queries provide insight via the returned results but are even more effective when used as datasets in an AI/BI dashboard where the data can be visualized and further interrogated with Genie.
Query 1: Daily Spend by Product
What the Query shows
Our first query is simply just a breakdown of spend by day and by product. We join the usage table (our fact) with our pricing table (an SCD Type 2 dimension) to get our spend over time at list pricing. As mentioned above, you could substitute the provided list price table with a custom table that incorporates any relevant discounts to see exact costs.
When to Use the Query
This query is perfect for getting a feel of how your Databricks environment is being used, what products are growing or shrinking in usage, and what total spend is. I would always start here when examining Databricks spend.
What to Watch Out for
The `system.billing.usage` only contains Databricks costs. This means that in any instance where non-serverless compute is being used, cloud infrastructure spend is not included and would need to be reviewed via the relevant cloud console (compute, networking, storage, etc.)
Query 2: Warehouse Cost Trends
What the Query Shows
Databricks SQL Warehouses are an incredibly powerful tool for powering SQL analysts, dashboards, and Genie Agents, and understanding their cost trends is critical for anyone managing a Databricks account. Query 2 allows you to see trends in daily usage of warehouses, which, since you pay for consumption, is analogous to their usage.
When to Use the Query
With Databricks, you pay for consumption so being able to see trends in cost for a warehouse is analogous to seeing trends in their usage (at least in the sense that uptime tracks to usage). This query then essentially can show usage of warehouses where higher usage could be due to higher uptime or more time spent scaled up. After identifying a warehouse for further analysis with this query, you could then further investigate that warehouse with the `system.compute.warehouse_events` system table or the monitoring page for the warehouse, and see if the warehouse could use different scaling or autostop settings. The warehouse usage can also give quick insights into how dashboards or genie spaces built on top of them are being used, and if more should be done to advertise them to business users.
What to Watch Out for
By default, this query includes all warehouses that were active in the examined time period, including ones that have been deleted. There is an included column (is_deleted) that can be used as a further filter if you want to remove deleted warehouses from analysis.
Query 3: Tag-Based Cost Attribution
What the Query Shows
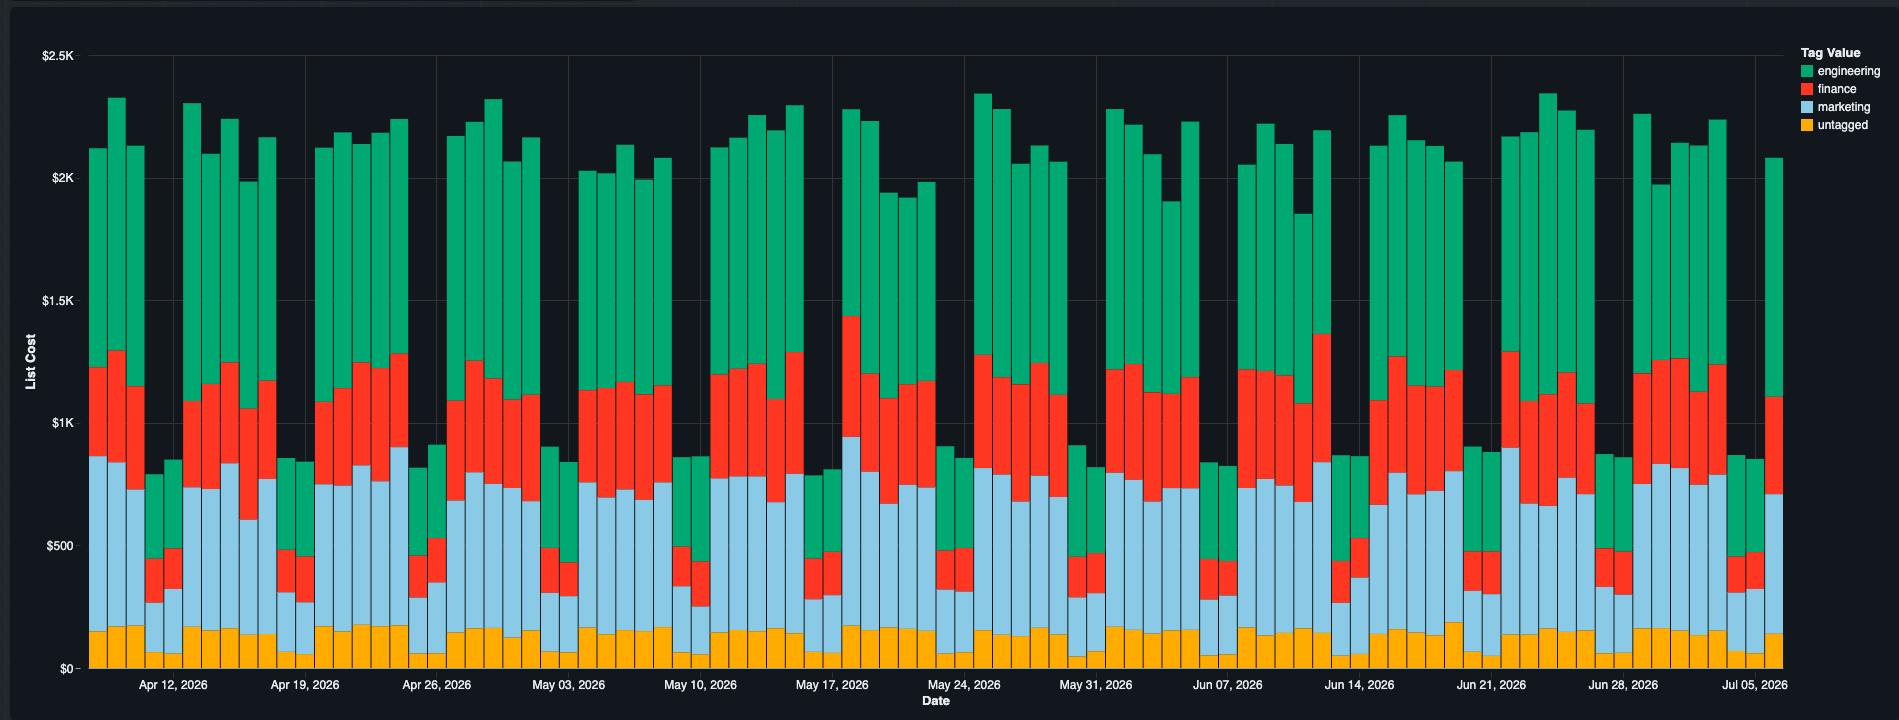
Tags are a powerful feature that can be used to track usage across users, projects, teams, or workspaces. Specifically, custom tags can be enforced via compute policies and serverless usage policies, and then you can use those tags when analyzing system table usage data. For example, you could choose to enforce tagging by team where the allowed values map to business units, like marketing, finance, and engineering. Then using this query where you have parameterized the tag you are grouping on to see usage by team.
When to Use the Query
This query can be used anytime a tagging strategy is used and you want to see costs based on the values of the tag. Not every record in your table needs to be tagged, if the tag key does exist on the record it will be recorded as untagged and can then be filtered out of your analysis or can be used to identify places where tagging is not being properly enforced.
What to Watch Out for
As mentioned before, records that are not tagged will come back as untagged which can be useful in identifying areas where tagging is not being enforced but may also be undesirable because the tag may only be relevant to a subset of usage. You could modify the query by including `u.custom_tags[:tag_key] is not null` in the where clause to filter out records without the tag at all or take it further by filtering on more than one tag or adding multiple tags to the queries group by.
Query 4: Daily Cost Anomaly Detection
What the Query Shows
Good controls via compute policies, job timeout settings, and budgets help Databricks platform administrators keep spend within spending limits but there is always the possibility of a user with sufficient permissions creating a job or warehouse that runs long or stays scaled beyond expectations and causes an unexpected spike in spending. Query 4 is built to help detect that as soon as possible. Simply, it uses the rolling 14 day average of spend and categorizes daily spend as elevated if more than one standard deviation above the average or an anomaly if it is more than two.
When to Use the Query
This query is perfect to be used in a cost monitoring dashboard or, you could use this idea as a base for an alert which would automatically email administrators if the previous day was elevated or anomalous.
What to Watch Out for
If your workload is very inconsistent day to day, the standard deviations in your usage may be very high and this query is unlikely to catch all but the largest usage spikes.
Query 5: Spend Forecast
What the Query Shows
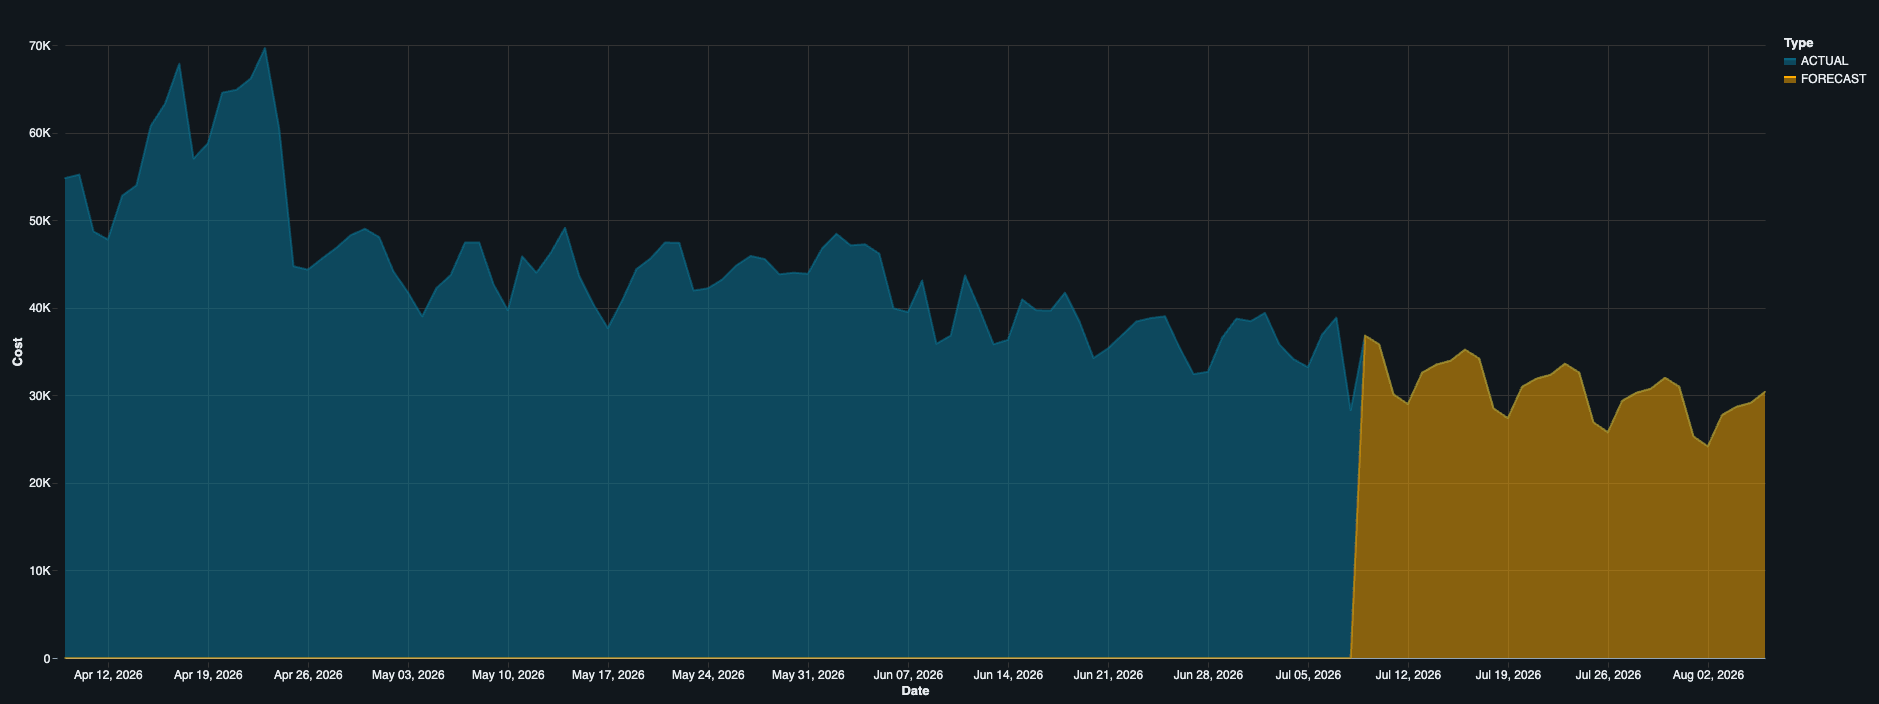
In the previous four queries, we have focused on looking back at spend but future spend is critical in understanding the full picture or your Databricks usage. Normally, this might require complex forecast modeling but among the Databricks SQL AI Functions, is the powerful ai_forecast which allows you to extrapolate a time series dataset, like one’s Databricks usage data, into the future. One can tweak the amount of data fed into the function, visualize the results in a graph, and very quickly produce a forecast of your Databricks spend.
When to Use the Query
Again, this query is perfect for adding to a cost monitoring dashboard so you can have an idea of what your spend will be in the future to help with planning and budgeting.
What to Watch Out for
This query is forecasting based on previous data so if you are using it for future planning just make sure you consider any future net-new workloads you might be planning that would not be predicted by this forecast.
Try System Table Queries
Running these queries once tells you what happened. Pinning them to an AI/BI dashboard changes how your team manages spend. Drop each one in as a dataset, wire up date-range and tag parameters, and make the dashboard your weekly cost review. From here, two next steps: bookmark the Databricks system tables reference for the full catalog of tables you can query, and explore more example queries to expand your toolkit beyond these five. No workspace yet? Start a free trial.
Get the latest posts in your inbox
Subscribe to our blog and get the latest posts delivered to your inbox.