How to Display Model Metrics in Dashboards using the MLflow Search API
by Avesh Singh, Jules Damji and Max Allen
Machine learning engineers and data scientists frequently train models to optimize a loss function. With optimization methods like gradient descent, we iteratively improve upon our loss, eventually arriving at a minimum. Have you ever thought: Can I optimize my own productivity as a data scientist? Or can I visually see the progress of my training models’ metrics?
MLflow lets you track training runs and provides out-of-the-box visualizations for common metric comparisons, but sometimes you may want to extract additional insights not covered by MLflow’s standard visualizations. In this post, we’ll show you how to use MLflow to keep track of your or your team’s progress in training machine learning models.
The MLflow Tracking API makes your runs searchable and returns results as a convenient Pandas DataFrame. We’ll leverage this functionality to generate a dashboard showing improvements on a key metric like mean absolute error (MAE) and will show you how to measure the number of runs launched per experiment and across all members of a team.
Tracking the best performing training run
Some machine learning engineers and researchers track model accuracy results in a set of spreadsheets, manually annotating results with the hyperparameters and training sets used to produce them. Over time, manual bookkeeping can be cumbersome to manage as your team grows and the number of experiment runs correspondingly increases.
However, when you use the MLflow Tracking API, all your training runs within an experiment are logged. Using this API, you can then generate a pandas DataFrame of runs for any experiment. For example, mlflow.search_runs(...) returns a pandas.DataFrame, which you can display in a notebook or can access individual columns as a pandas.Series.
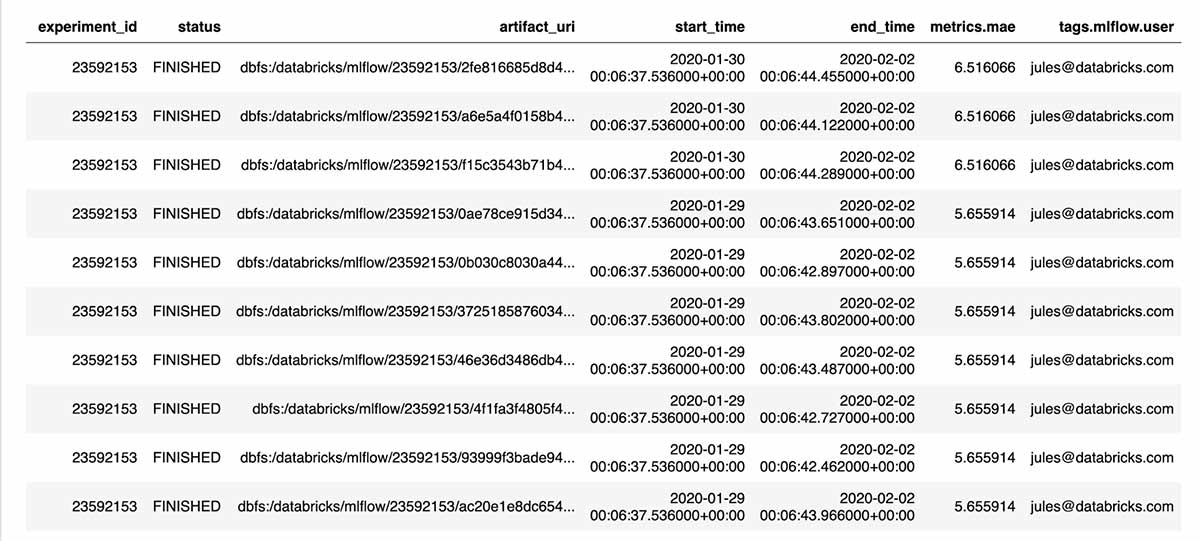
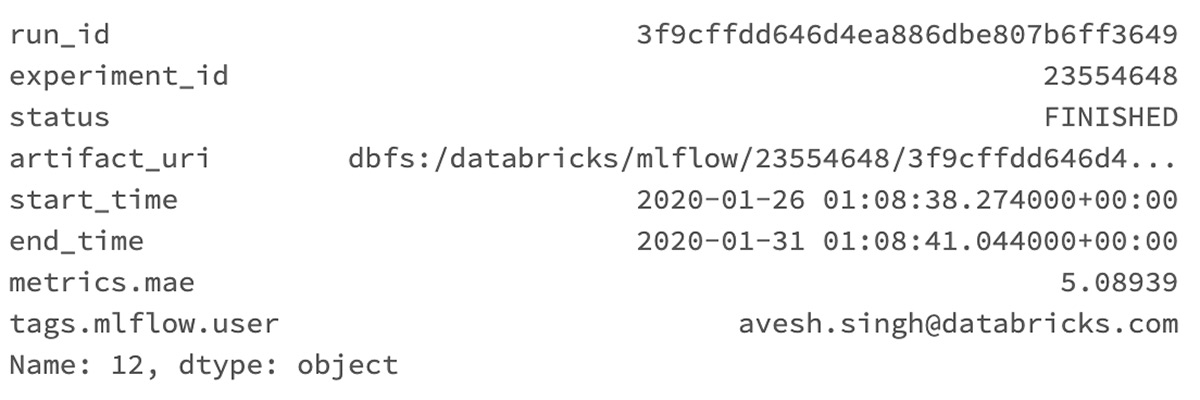
With this programmatic interface, it’s easy to answer questions like "What’s the best performing model to date?"
Using pandas DataFrame aggregation and the Databricks notebook’s display function, you can visualize improvements in your top-line accuracy metric over time. This example tracks progress towards optimizing MAE over the past two weeks.
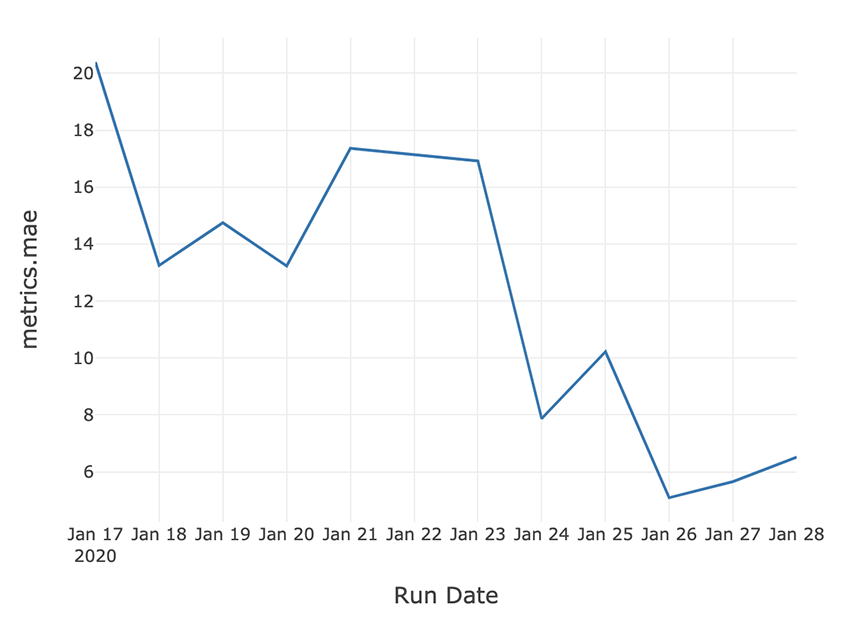
If you are running open source MLflow, you can use matplotlib instead of the display function, which is only available in Databricks notebooks.

Measuring the number of experiment runs
In machine learning modeling, top-line metric improvements are not a deterministic result of experimentation. Sometimes weeks of work result in no noticeable improvement, while at other times tweaks in parameters unexpectedly lead to sizable gains. In an environment like this, it is important to measure not just the outcomes but also the process.
One measure of this process is the number of experiment runs launched per day.
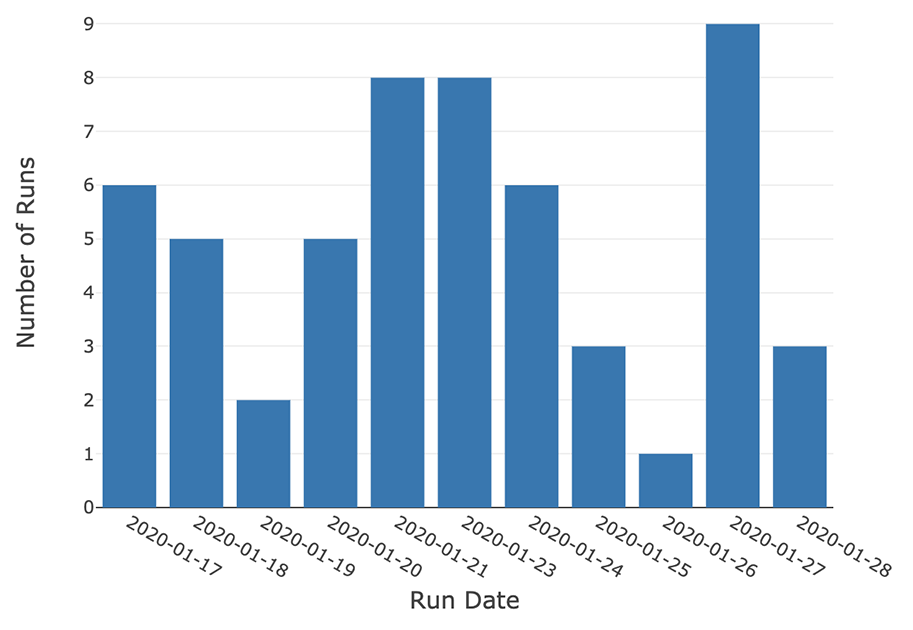
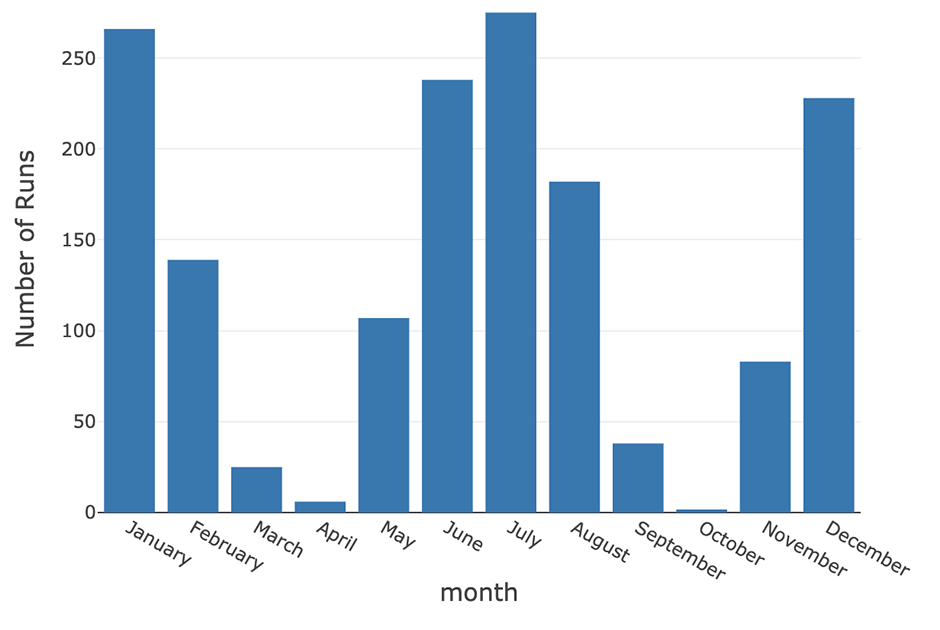
Extending this example, you can track the total number of runs started by any user across a longer period of time.
Creating a model performance dashboard
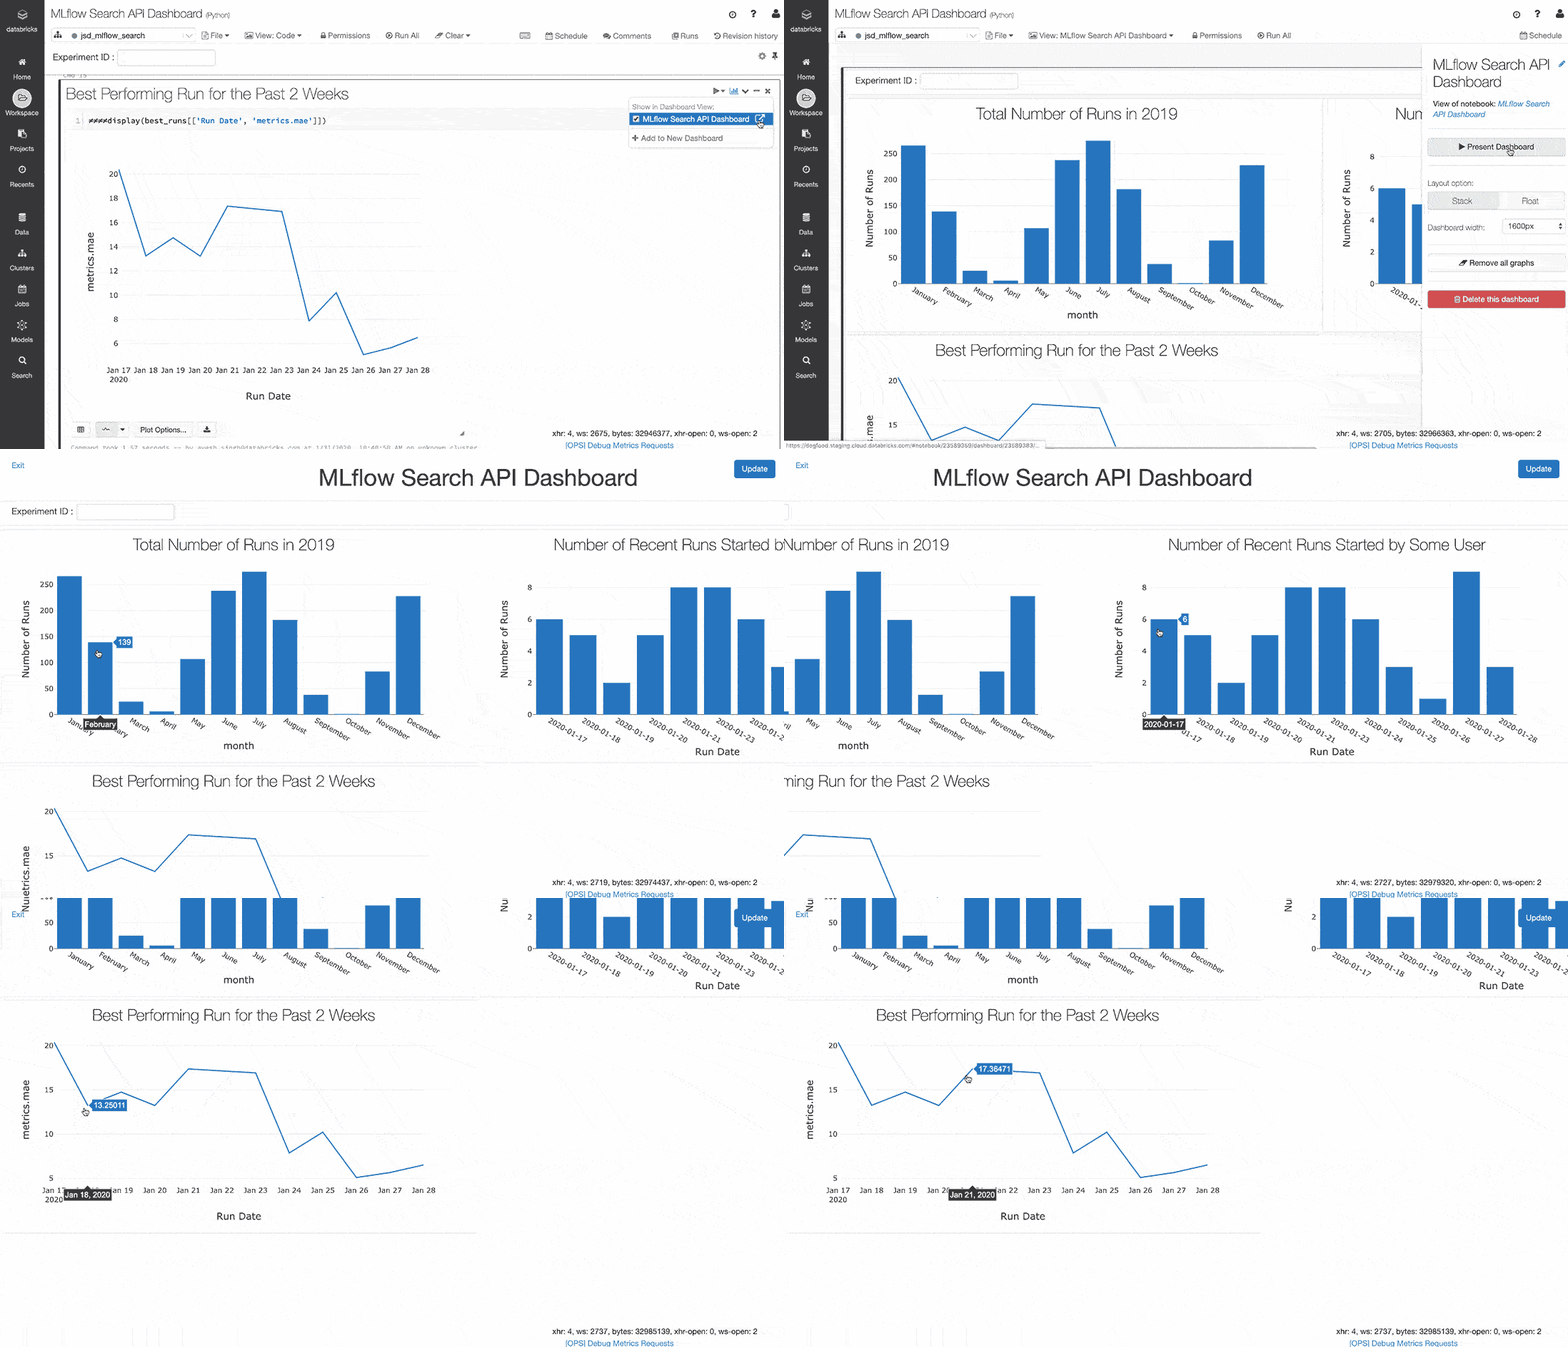
Using the above displays, you can build a dashboard showing many aspects of your outcomes. Such dashboards, scheduled to refresh daily, prove useful as a shared display in the lead-up to a deadline or during a team sprint.
Moving beyond manual training model tracking
Without tracking and measuring runs and results, machine learning modeling and experimentation can become messy and error-prone, especially when results are manually tracked in spreadsheets, on paper, or sometimes not at all. With the MLflow Tracking and Search APIs, you can easily search for past training runs and build dashboards that make you or your team more productive and offer visual progress of your models’ metrics.
Contributions: Max Allen was an engineering intern with the MLflow engineering team.
During his internship last year, he implemented the MLflow Search API, which we demonstrate in this blog.
Get started with MLflow Tracking and Search APIs
Ready to get started or try it out for yourself? You can see the examples used in this blog post in a runnable notebook on AWS or Azure.
If you are new to MLflow, read the MLflow quickstart with the lastest MLflow 1.6. For production use cases, read about Managed MLflow on Databricks.
Get the latest posts in your inbox
Subscribe to our blog and get the latest posts delivered to your inbox.