Query Tags: The Context Your Warehouse Queries Have Been Missing
Attribute costs, trace partner tool queries, and label workloads — with custom metadata on every SQL execution.
- Attribute shared warehouse costs by team, project, dashboard, or any custom dimension
- Monitor or troubleshoot queries from partner tools with automatic tagging for dbt (model name), PowerBI (report id), Tableau (workbook name) and more
- Tag queries from anywhere: SQL Editor, Notebooks, Dashboards, APIs, connectors, and drivers
Databricks SQL logs key attributes of every query automatically: who ran it, on which warehouse, and from which tool. But that's often not enough.
When a Power BI query is running slow, you know it came from Power BI, but not which dashboard to fix. When costs spike, you can see which users ran queries, but not which cost center or project to charge. The missing piece is custom context, and that's exactly what Query Tags adds.
Today, we're introducing Query Tags in Public Preview. Query Tags let you attach business context as multiple key-value pairs to every SQL execution, and query it all through system tables with standard SQL — or just by asking Genie. Query Tags are also visible in the Query Profile UI (search support in the Query History UI is coming soon).
Query Tags have already seen strong adoption, with hundreds of customers tagging millions of queries weekly.
Just tag it: introducing Query Tags
With Query Tags, you attach custom key-value pairs (e.g. “project” : “finance_planning”) to each SQL execution. These tags travel with the query and are recorded in the Query History System Table, making them available for grouping, filtering, and analyzing workloads.
Tags add value across three scenarios:
- Partner tools: When using dbt, Power BI, or Tableau, propagate identifiers like dbt model name, Power BI report ID, or Tableau workbook name into every query.
- Custom applications: When building apps through the SQL Statement Execution API or connectors, attach metadata like `customerid`, `applicationname`, or `app_version` to each execution.
- Ad-hoc work in the Databricks UI: Tag queries with dimensions relevant to you — dev vs. prod environment, cost center, experiment name, or team.
Let’s go deeper into these scenarios.
(1) Trace every partner tool query back to its source
Queries from dbt, Power BI, and Tableau flow into your warehouse — but without tags, they're untraceable beyond a user ID and which tool they came from. These tools solve this by injecting Query Tags automatically, with no manual tagging required.
dbt automatically tags every query with the model name, core version, adapter version, and materialization type. If a dbt model suddenly regresses in performance, you can pinpoint exactly which model, which version, and when:
Staff engineering leads Dipesh Bhundia and Dave Couse at ASOS added:
"Without having to configure anything, we can map each SQL workload to the dbt model it originates from. With Query Tags we can finally accurately split up warehouse costs by the teams that are running dbt on it."
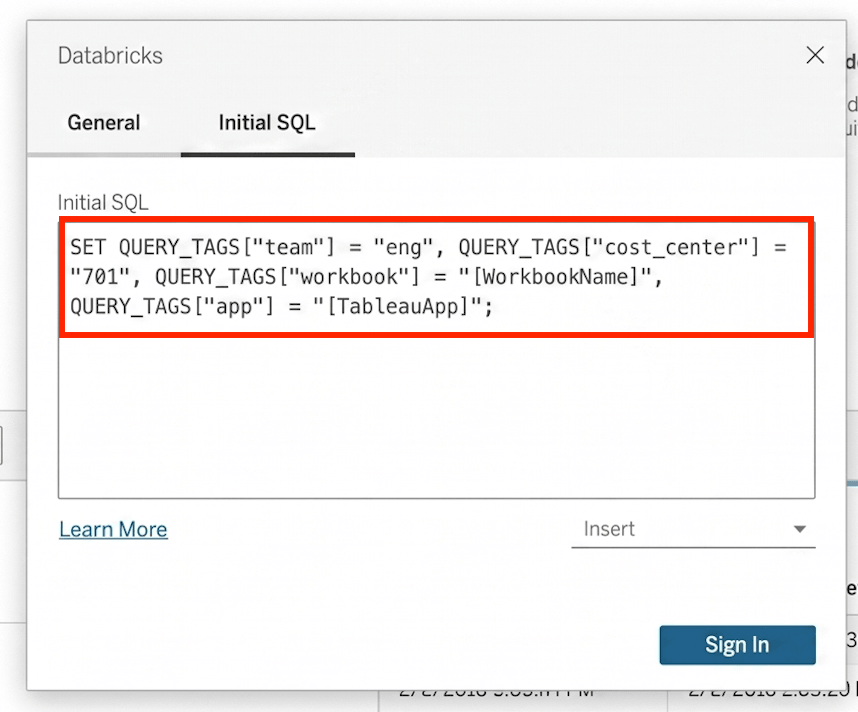
Power BI and Tableau support custom Query Tags at the connection level. Set them once, and every query from that connection carries them automatically. For Tableau, customers have found it useful to use parameters like [WorkbookName] as the tag value, so attribution is preserved even when the workbook is renamed.
For a full list of partner tools that support Query Tags, see the documentation. If your tool is not listed, reach out to your account team.
(2) Turn anonymous API queries into traceable workloads
Custom applications hit your warehouse through APIs and connectors, but the queries they generate carry no application context — no app name, no team name, no customer ID. Query Tags let you attach this metadata at the connection or statement level.
The SQL Statement Execution API supports tagging at the statement level. Tags passed as a parameter apply to that specific execution:
The Python Connector supports both connection-level and statement-level tagging . Set a team name on the connection; override it per-statement when needed:
Matthew Haber, DevOps Engineer, Unit21 shared:
"We moved from one warehouse per team to shared warehouses to cut costs, but lost visibility into which team was driving spend. With Query Tags, we just pass the team name from our Databricks SQL Connector for Python workloads and we have that attribution back – no need to split warehouses again"
For the full list of connector and driver support (Node.js, Go, JDBC, etc), please check the documentation.
(3) Label your own work so it doesn't get lost in the noise
Analysts run hundreds of queries a week (exploration, production, debugging, etc) and without labels, they all look the same in system tables. Query Tags let practitioners tag as they go with one line of SQL, anywhere they submit queries: SQL Editor, Notebooks, Dashboards, and Alerts.
Once set, all subsequent statements in the session automatically carry those tags. No need to annotate every query individually. For example, adding the SET QUERY_TAGS statement to each dataset query in an AI/BI dashboard tags every query from that dashboard with ‘environment: production’.
Data practitioners can use this to:
- Tag ad-hoc analysis by project or team
- Mark experiments or A/B tests
- Identify dev vs. prod workloads
- Attach debugging context when investigating issues
From tags to answers: monitoring with System Tables
Once queries are tagged, the tags are recorded in the query_tags column of the Query History System Table. Now the hard questions become simple SQL.
Which team is driving warehouse costs?
Many organizations need to allocate shared warehouse costs by team or product. With Query Tags, this is a single query — no warehouse splitting or guesswork.
Which dbt model introduced a regression?
When a pipeline slows down, you need to know which model, not just which warehouse. Filter system.query.history by the auto-injected dbt model name tag to isolate the problem.
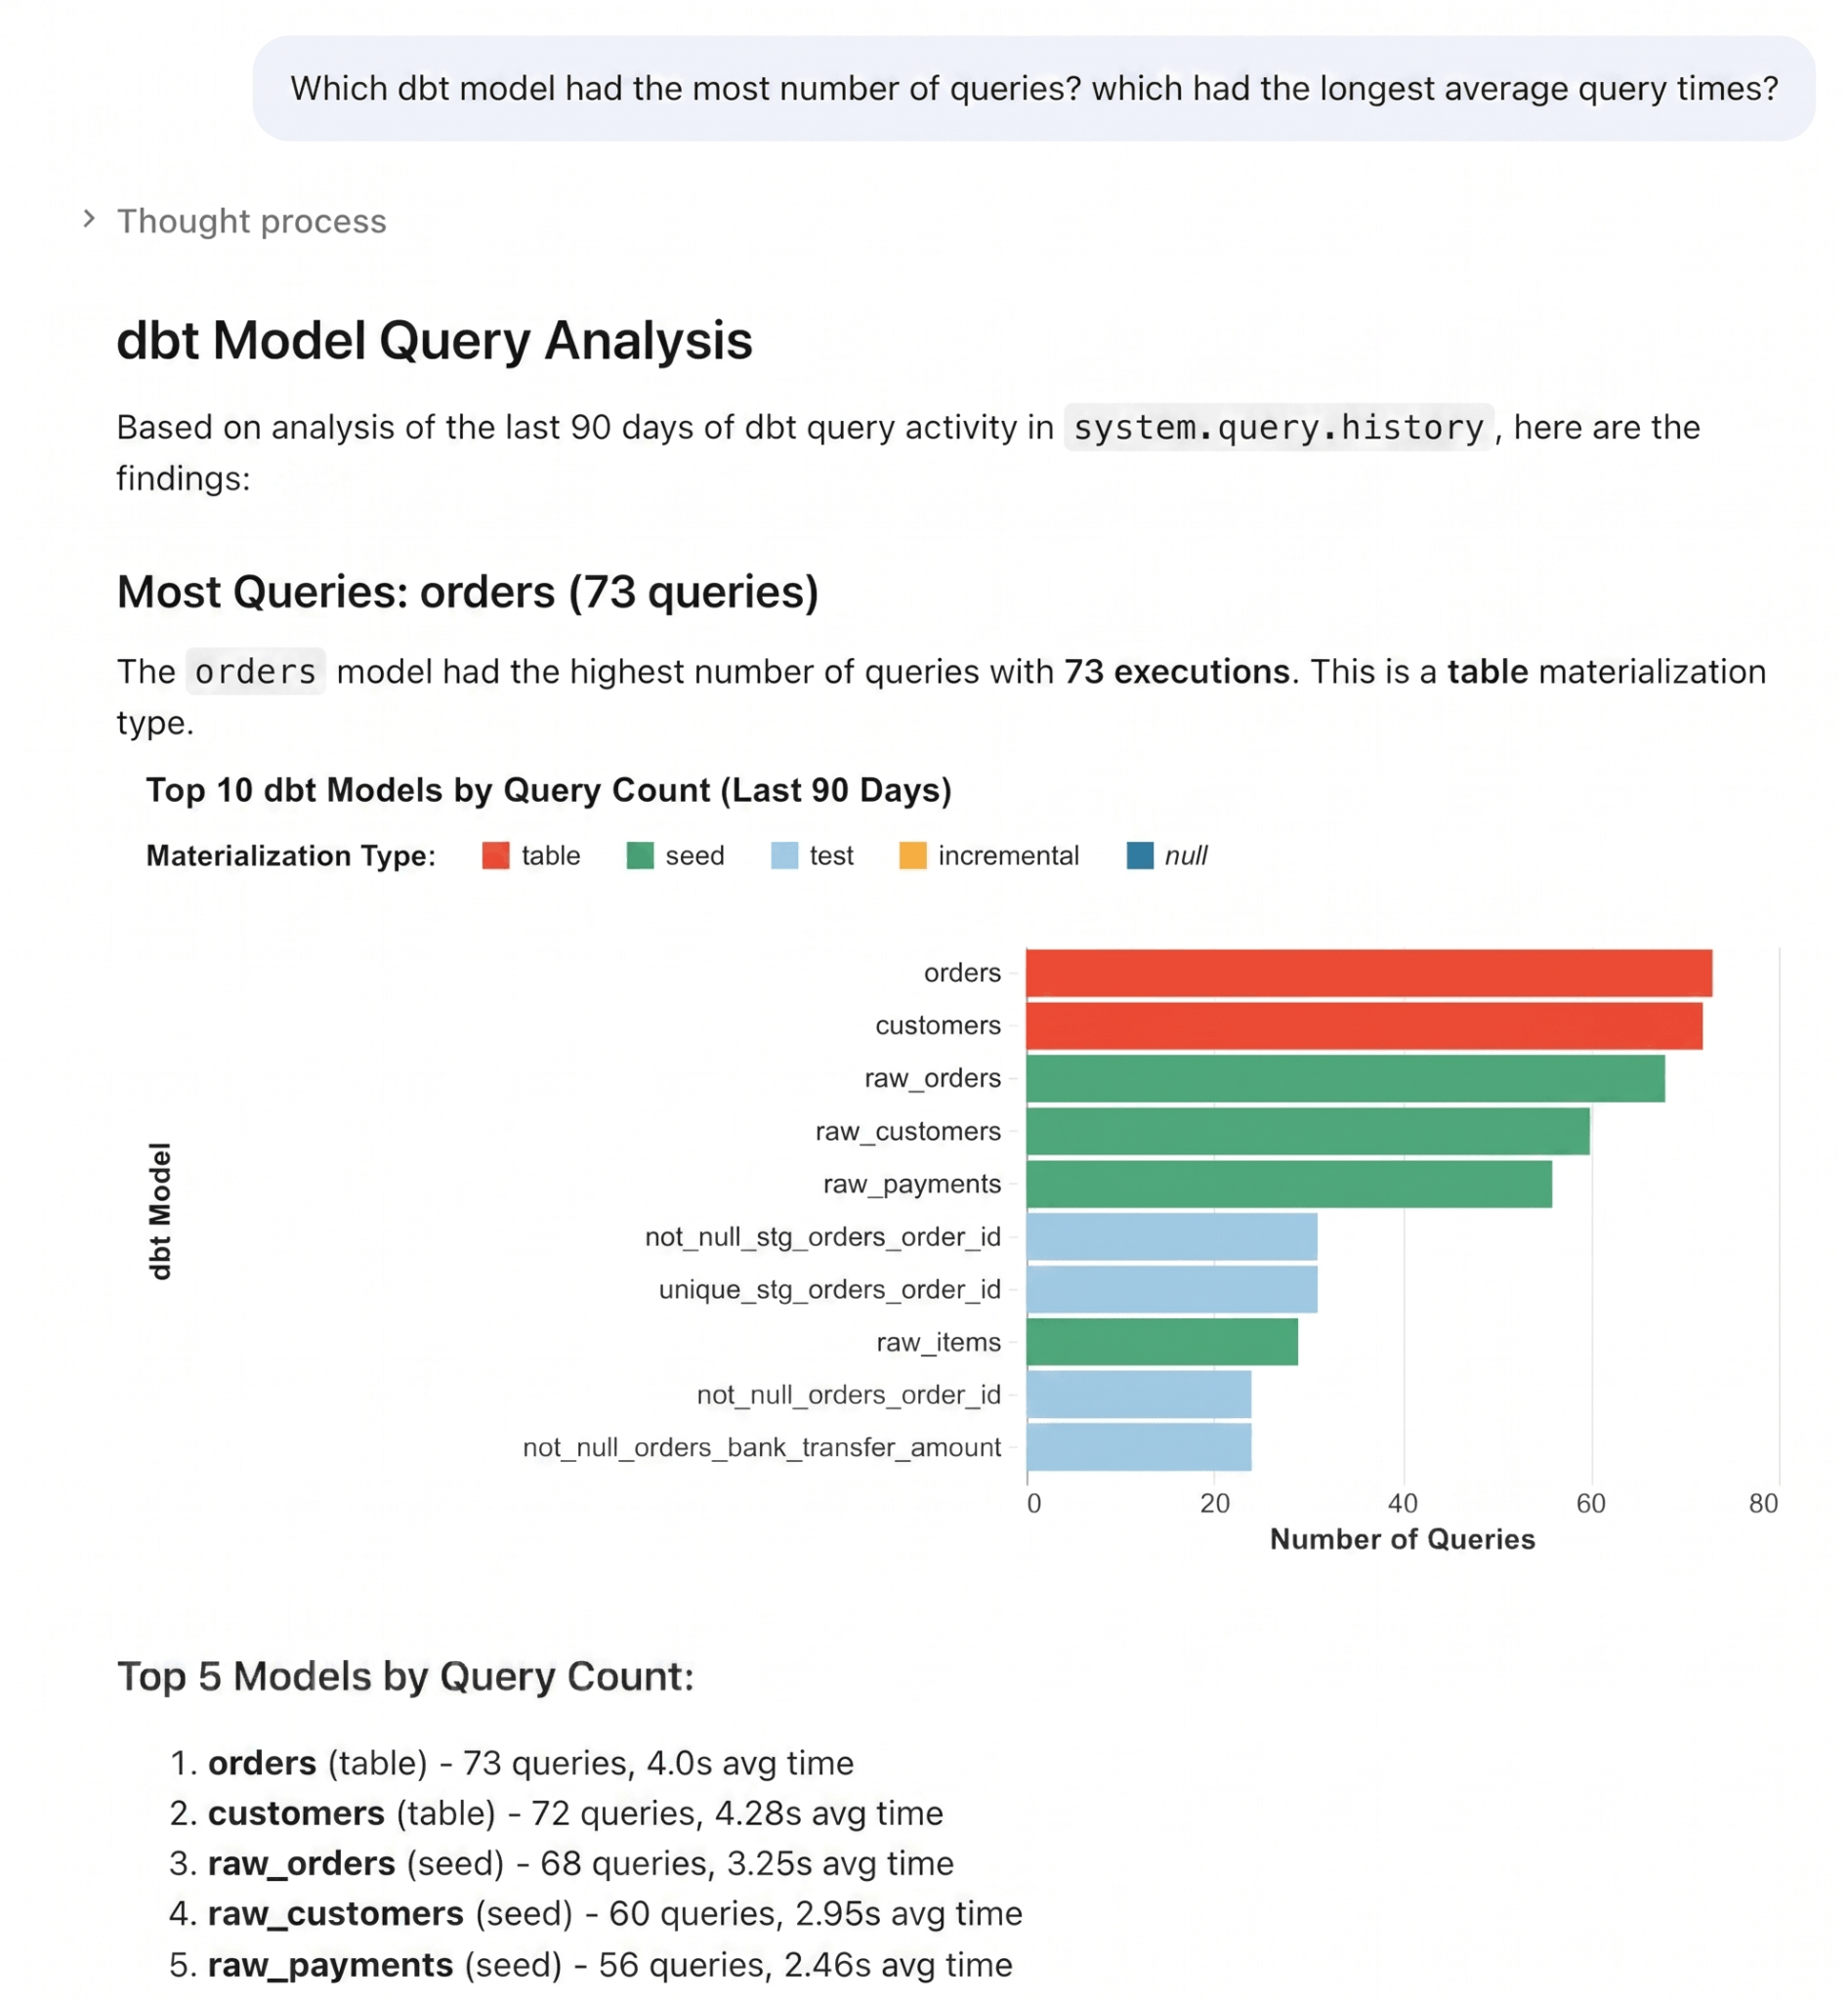
Or, skip writing SQL entirely, by asking Genie. Because Query Tags store business context in System Tables, Genie can reason over your workload data in natural language. For example: "Which dbt model had the most number of queries? Which had the longest average query times?”
Query Tags unlock many more monitoring use cases:
- Group by query_tags['cost_center'] for chargeback
- Filter by query_tags['@@dbt_model_name'] to monitor pipeline health
- Identify long-running queries per Tableau workbook
- Compare query_tags['env'] to separate dev from prod traffic
What’s next
Query Tags are in Public Preview today for SQL Warehouses, and we're already working on making it even more helpful for our customers’ monitoring experiences. Please refer to the documentation for updates.
- Power BI automatic tagging: Power BI will automatically attach metadata like DatasetId and ReportId to every query with zero configuration. You can manually enable this today by following the steps in the documentation. Automatic tagging will be on by default in the next Power BI release.
- Broader connector support: In addition to Python, statement-level tagging is now available for Go, and Node.js.
- Searchability in the UI: We will soon support search in the Query History UI, so you can search for queries with a specific tag (e.g. "@@dbt_model_name": "my_model")
- Support beyond SQL warehouses: We're bringing Query Tags to Serverless Notebooks and Jobs, so the same tagging and attribution model extends to notebook workloads.ads.
Try out Query Tags today
Every untagged query is a missed opportunity for attribution. Whether you need to split warehouse costs by team, trace a slow query back to a specific dashboard, or label analyst work by project — Query Tags give you the context to do it.
If you use dbt, you're already tagging (check your Query History System Table). For Power BI, Tableau, and custom applications, setup takes minutes. For ad-hoc work, it takes one line of SQL.
Query Tags are available today in Public Preview across all clouds. Get started with the documentation.
Get the latest posts in your inbox
Subscribe to our blog and get the latest posts delivered to your inbox.