Sustainability in Aluminum Production
Reframing Batch Traceability with GraphFrames
by Greg Hansen and Varun Joshi
- Business value and typical challenges of tracing materials through an operational chain
- How GraphFrames represents the hierarchical relationships between input and output batches across the operational chain
- How to trace the full lineage of any batch using Pregel algorithms
Driving Sustainable Aluminum Production: How to Calculate the Material Recovery Ratio with GraphFrames
Sustainable production has become an imperative in today’s manufacturing market. According to a 2022 survey by the National Association of Manufacturers, 79% of manufacturers have specific sustainability goals. One global leader in aluminum sheet and foil production has embraced this challenge head-on, using Databricks to analyze production line data. This aluminium manufacturing company aims to enhance product quality, optimize resources, and reduce environmental impact.
The Challenge: Complexity in Production and Emissions Monitoring
Aluminum production is a complex process with many stages involved in transforming raw materials into finished products. To ensure sustainability throughout this process, the company has developed reporting systems that track the environmental impact from start to finish. One of the key metrics in this effort is the recovery ratio—the percentage of aluminum successfully recycled from scrap materials into new products. To accurately measure this, the company must first identify each step required in creating the end product (e.g., "batch tracing”) and then calculate the material waste associated with each stage.
The data, however, is massive. Production systems have recorded over 1 billion rows with up to 40 levels of linked production batches. Traditional DataFrame methods were not well-suited for parsing these relationships from the data. The company considered using Pandas UDFs, but these UDFs showed performance limitations as the size and complexity of the data increased. Identifying deeply-nested relationships in such a large dataset required modeling the relationships as a graph. A solution built with GraphFrames—a distributed graph-processing framework included in Databricks ML Runtime and optimized with Databricks’ Photon Engine—performed the end-to-end batch tracing with good performance and scalability.
Working with GraphFrames
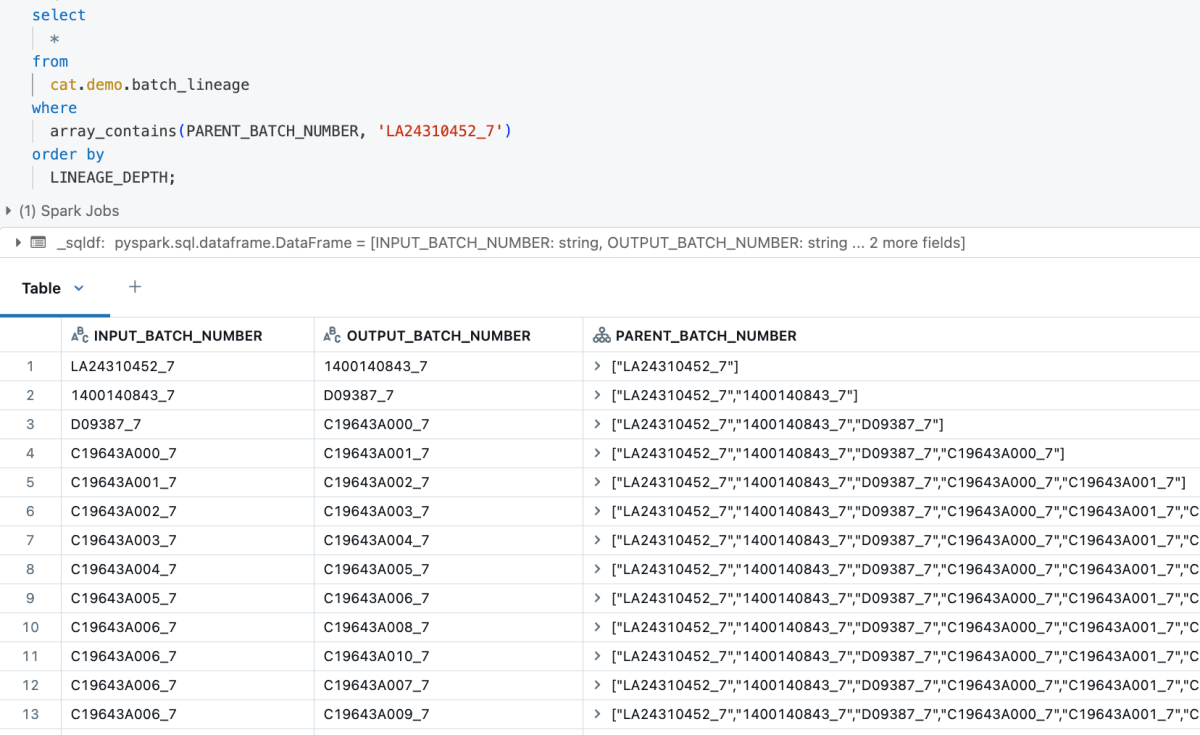
Manufacturing systems can refine a single raw material into hundreds of end-products with hundreds of intermediate steps. While each subprocess may emit information about its own input and output materials, measuring key sustainability indicators like the recovery rate requires analysis of the end-to-end sequence. The goal is to connect an output batch with a source batch through a series of intermediate batch IDs. Once the full trace is available, we can determine the material lost in each step.
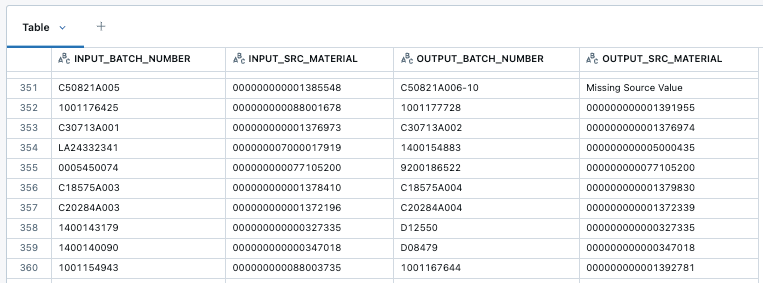
Tracing production batches stored as rows in a DataFrame—to compute the total material lost in the production of an end-product, for example—can be difficult. While DataFrames are useful for many analytical queries over sets of business objects, they lack functionality to model and analyze complex hierarchies of objects. GraphFrames are a useful data structure for dealing with large object hierarchies. They model hierarchies as graphs with:
- Vertices representing the business objects (e.g. Batch A from a manufacturing process)
- Edges representing the pairwise relationships between the objects (e.g. Batch A is the source for Batch B)
The GraphFrames library has many built-in tools for processing graph data. One class of algorithms, Pregel, sends information along the graph edges to compute results. For batch tracing, we used Pregel to send information about previous production steps (e.g. the output batch number) along the graph, generating a full list of all upstream material batches for each end-product.
Understanding Pregel
Pregel is a framework that allows users to build custom, parallelized message-passing algorithms suited to their unique business problems. Each vertex is initialized with a default value. Results are computed over iterations called supersteps. In each superstep, graph vertices can:
- Pass a message to their neighbors
- Aggregate messages received from their neighbors
- Process the messages and update their internal state
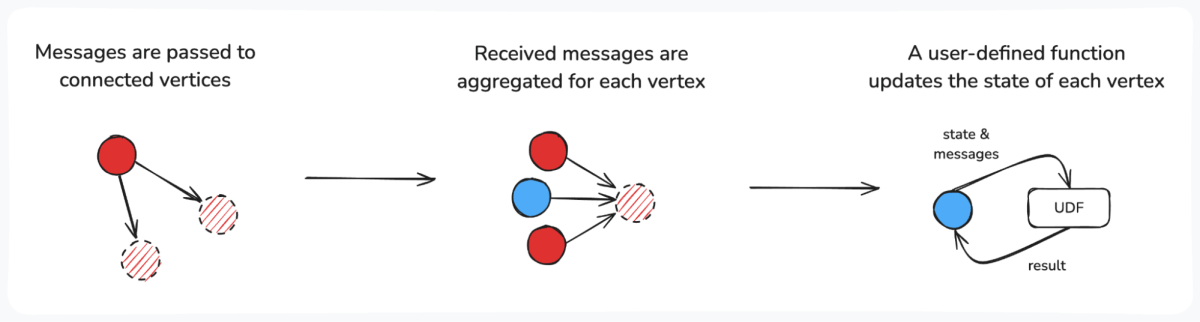
User-defined functions (UDFs) control how messages are passed and used to update a vertex’s state. This flexibility allows users to implement Pregel algorithms for a variety of use-cases. To trace batches in our manufacturing process, we sent the input batch number from one vertex to another, updating each vertex’s depth and source batch numbers when a message was received.
Defining Functions for Batch Tracing
To implement batch tracing with Pregel, we wanted to send batch numbers along the graph. We started by defining a message structure—ours included the depth of the node, the batch number, and any previous batch numbers (a.k.a. the “trace”). With our message schema defined, we created a UDF to ensure messages were sent from parent to child batch based on each vertex’s depth.
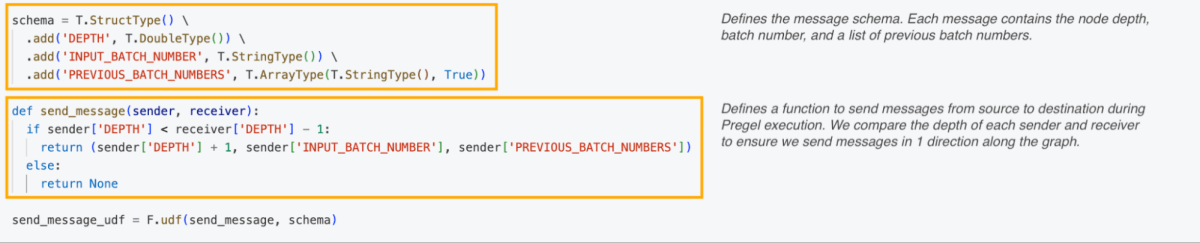
Because manufacturing systems can involve several inputs, we needed a way to handle messages from multiple upstream vertices. We created a function to collect a single list of batch numbers received from each upstream production line.

Finally, we created a function to update each vertex with the aggregated batch numbers.

Pre-Processing the Data
Our first step was to identify source batches in our dataset. We created a GraphFrame from our batch data and used the inDegrees property to determine the number of input batches for each output batch.
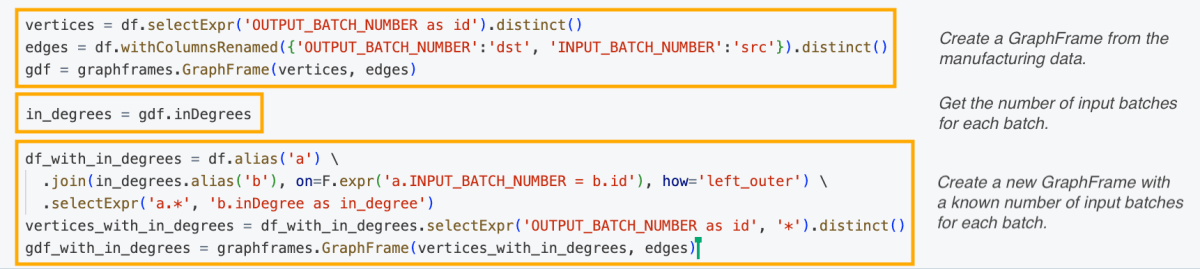
Once we had found the source batches, we were able to construct a Pregel algorithm to pass the batch number along each edge, from input to output until the full lineage was traced for every batch.
Running the Pregel Algorithm
The image below shows the Pregel framework calls to execute the algorithm and trace the lineage.
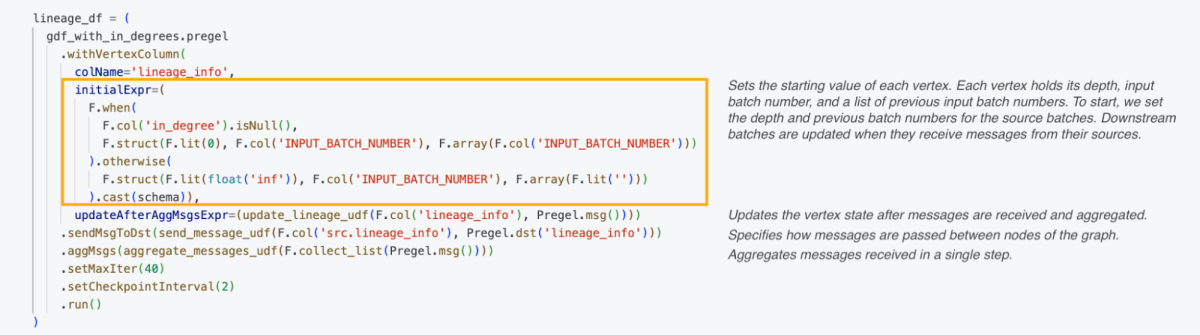
GraphFrames sped-up hierarchical traversal by 24x (4 hours to about 10 minutes) for 1 million batches vs. Pandas UDFs running on the same cluster. Whereas Pandas UDFs could only be scaled by increasing the worker size, tests showed that GraphFrames scaled horizontally when workers were added to the cluster.
Conclusion
Using GraphFrames on Databricks has provided this manufacturer greater visibility into its production process. With reporting developed from batch tracing data, operations managers can identify defects early, reduce waste, and deliver more consistent product quality. Tracking waste and emissions more accurately will help the company minimize its environmental impact, ensure compliance with increasingly stringent regulations, and better align with its customers’ values.
Embracing data-driven solutions helped this manufacturer find more efficient, sustainable ways of producing goods. GraphFrames provides convenient, Spark-native graph functionality that can be used by many manufacturers to understand their production processes at scale.
Interested in driving sustainability in your business? Check out our ESG Performance Analysis solutions accelerator to get started!
Get the latest posts in your inbox
Subscribe to our blog and get the latest posts delivered to your inbox.