Approximate answers, exact decisions: New sketch functions for analytics
Four new sketch functions in Databricks speed up percentiles, distinct counts, and top-K queries by orders of magnitude
by Daniel Tenedorio, Kent Marten, Gengliang Wang and Chenhao Li
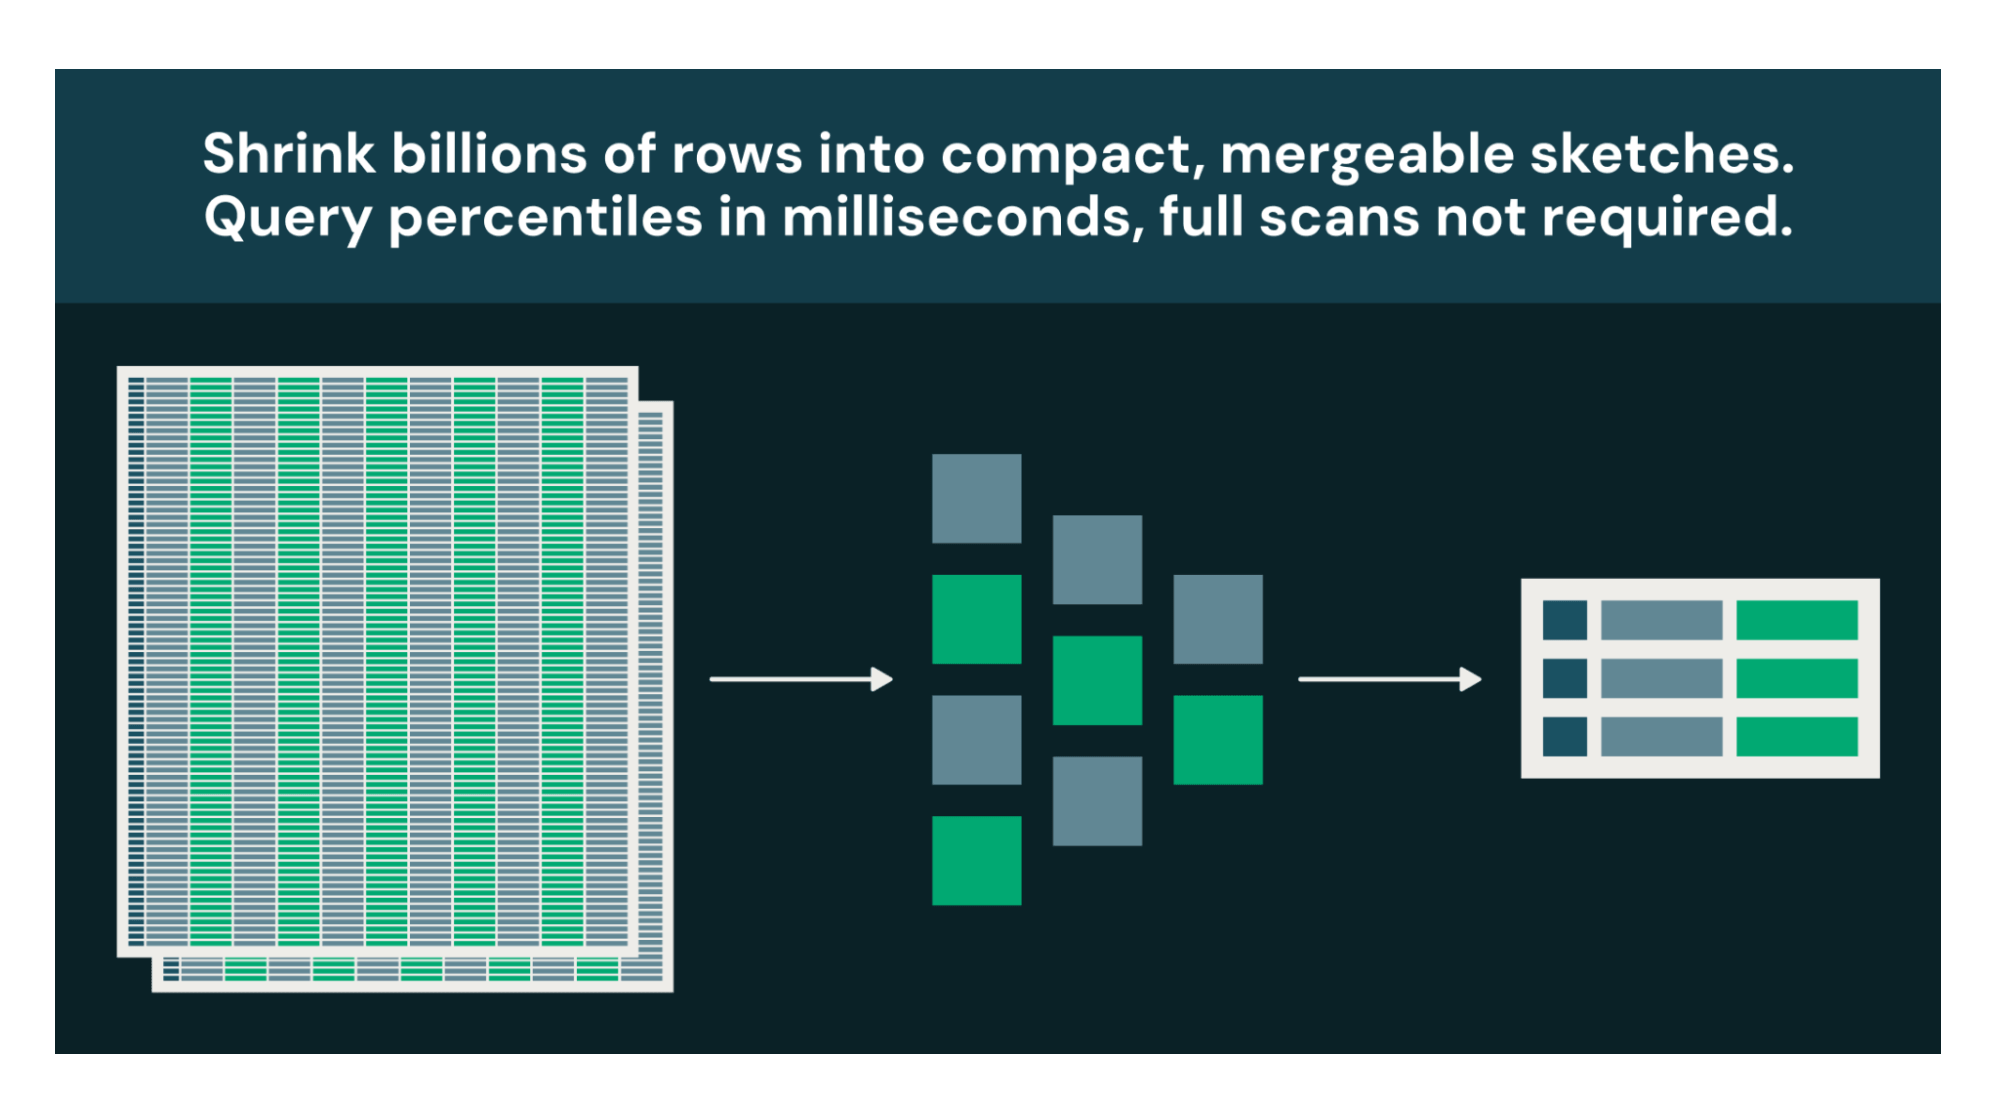
- Percentiles in milliseconds, not minutes: KLL quantile sketches compute P50, P90, P99 over massive datasets in constant memory. Store sketches and merge them for instant incremental updates.
- Audience overlap at a fraction of the cost: Theta and Tuple sketches perform unions, intersections, and set differences on distinct value sets. Tuple sketches also associate metrics (sums, mins, maxes) with each key for combined counting and aggregation.
- Real-time trending without reprocessing: Approximate top-K functions identify the most frequent items in bounded memory, mergeable across time windows.
Many analytical questions are decision-support, not audit. If knowing "~4.7M unique users ±1%" leads to the same decision as "4,712,389 unique users," the approximate answer at a fraction of the cost is strictly better.
Every warehouse has a handful of queries that burn the most compute: percentiles that force global sorts, distinct counts that track every unique value, top-K rankings that reshuffle entire datasets. Databricks now supports four new sketch function families, built on Apache DataSketches, that replace these exact computations with bounded-memory approximations. The tradeoff: 1-2% configurable relative error. The payoff: orders-of-magnitude less compute, plus sketches you can store, merge, and requery without touching raw data.
Percentile calculations in milliseconds, not minutes
When you call PERCENTILE(response_time_ms, 0.99) on a billion-row table, the engine must sort every value globally. A full cluster shuffle could take minutes and consume gigabytes of memory. For a dashboard that refreshes every 5 minutes, you're paying that cost over and over.
KLL sketches are compact and mergeable summaries, built to answer quantile questions. They let you replace this sort while using the same bounded memory, whether you process a thousand values or a trillion. Typical relative error is 1-2% and is configurable, well within the actionable range for latency monitoring, capacity planning, and anomaly detection.
The real advantage is the workflow sketches enable. Build them once during your daily ETL. Store them as columns in Delta tables. When a dashboard needs P50/P90/P99 for any time range, merge the precomputed sketches in milliseconds instead of rescanning raw data. Extract multiple quantiles from a single sketch in one pass with kll_get_quantile_bigint(sketch, ARRAY(0.5, 0.9, 0.99)).
Audience overlap analysis without the compute bill
How many users saw your Super Bowl ad but not your Instagram campaign? Audience overlap analysis is core to marketing measurement. You need to know total reach (users who saw any campaign), overlap (users who saw multiple campaigns), and exclusive reach (users who saw only one campaign). But exact computation requires collecting every user ID into memory and performing set operations across potentially billions of identifiers. At scale, this becomes impractical or impossible.
Theta sketches summarize a set of distinct values in bounded memory and support full set algebra: unions, intersections, and differences. Build a sketch per campaign, then combine them mathematically:
The exact approach would require a UNION to deduplicate, then a JOIN to find overlap, possibly shuffling raw user IDs twice across your cluster. With Theta sketches, you generate compact binary objects measured in kilobytes, and the set operations happen locally in microseconds. This makes daily reach curves, incrementality measurement, and cross-channel deduplication practical.
Real-time leaderboards without reprocessing raw data
What's trending right now? It's a simple question with an expensive exact answer: count every distinct value, store all those counts, shuffle them across your cluster, sort globally. For high-cardinality event streams like search logs or clickstreams, this is a batch job, not a live query.
Approximate top-K sketches track your most frequently occurring items in bounded memory and let you merge across partitions and time windows to extract results instantly. Rare items might be dropped, which is fine, because that’s not what you’re looking for.
With approx_top_k_combine, your "trending this week" dashboard becomes a merge of 168 pre-computed sketches rather than a scan of billions of raw events. For streaming workloads, merge each micro-batch's sketch into a running total and display results in real time. What was once a batch job becomes a live leaderboard.
Cardinality and revenue attribution in one pass
Counting distinct customers is one query. Summing their revenue is another. Doing both correctly, without double-counting customers who appear in multiple periods, is the challenge.
Consider a common analytics question: “How many unique customers made a purchase this month, and what was their total revenue by region?” Typically, you would start with a large GROUP BY, deduplicating customer IDs while summing purchases across billions of transactions. And you can't simply add prior results together, customers appearing in both periods get double-counted and their revenue overstated.
Tuple sketches solve this by combining distinct counting and metric aggregation in a single, mergeable structure.
Each sketch maps a distinct customer to its aggregated spend. When you merge across days, customer counts deduplicate automatically and revenue sums accumulate. Exact incremental computation would have you reprocessing from raw data every time the data range changed.
Getting started with the right sketch
Function Family | Use Cases |
KLL Quantile Sketches | Percentiles (P50, P90, P99) |
Theta Sketches | Set operations on distinct values |
Approximate Top-K | Most frequent items |
Tuple Sketches | Distinct counts and metric aggregations |
When to use sketches: Dashboards, trend analysis, monitoring, marketing attribution -- any query where approximate answers are acceptable. The larger your dataset, the better. If you’re not sure what sketch to use, ask Genie Code to help you know the right choice.
When to stay exact: Financial auditing, compliance reporting, or any use case where regulatory or business requirements demand precise values.
These four function families turn long-running queries into the cheapest in your warehouse. Build sketches once during ETL, store them in Delta, merge them on read. The raw data is still there when the auditors ask. For everything else, a 1% error margin and a 1000x speedup is a welcome trade-off.
All functions work in SQL, DataFrame, and Structured Streaming pipelines. Sketches created in Spark are interoperable with other systems in the Apache DataSketches ecosystem. See documentation (1, 2, 3, 4) for function signatures and examples and get started with sketches today.
Special mention to Christopher Boumalhab (cboumalh on GitHub) for implementing and contributing the Theta sketch and Tuple sketch function families in Apache Spark.
Get the latest posts in your inbox
Subscribe to our blog and get the latest posts delivered to your inbox.