How Databricks Helps Baseball Teams Gain an Edge with Data & AI
Turning pitch data into dugout decisions with Unity Catalog, Agent Bricks, and Lakebase
by Nick Ragonese and Wesley Pasfield
- How a clubhouse actually uses AI: what the hitting coach, pitching coach, manager, and GM ask a count‑aware assistant in real situations.
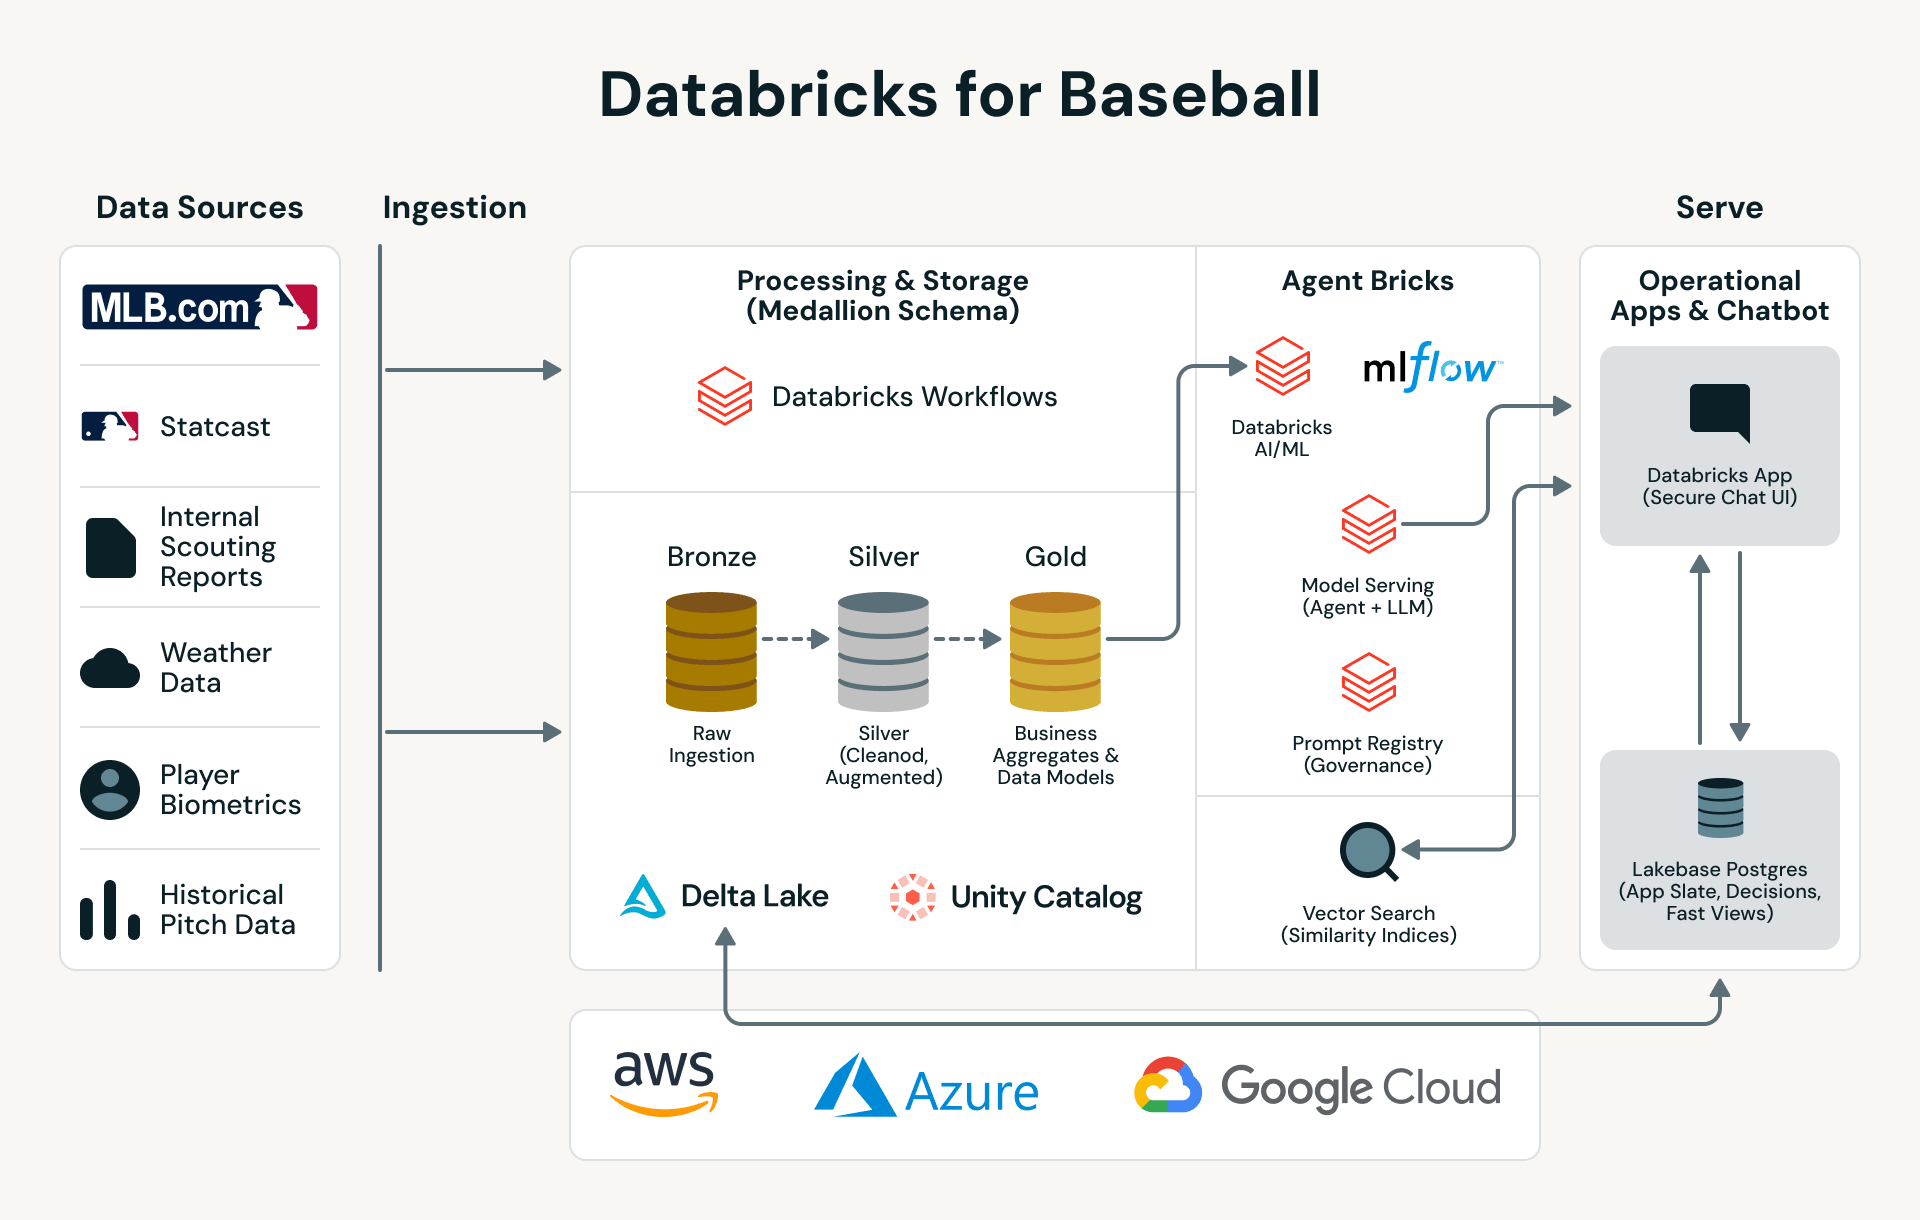
- Which Databricks products power each moment: Genie in prep and front office work, Agent Framework and Model Serving on game day, Unity Catalog and AI Search underneath, and Lakebase Postgres for stateful apps.
- Why one platform matters: the same governed data and tools drive real‑time decisions, scouting reports, and roster strategy, without CSVs or one‑off scripts.
Baseball moves fast, defined by small moments: one pitch, one matchup, one decision. This story follows how a modern clubhouse uses Databricks to turn high-fidelity pitch data into decisions that help win games.
Game day, 2:00 PM
Hitter’s meeting with Genie and Unity Catalog
The hitters file into the video room. The coach does not want a 30‑page printout; they want a crisp plan for tonight’s starter.
Earlier that day, the analyst sat at their laptop and opened Genie, on top of Unity Catalog, where Statcast and team‑derived tables live with consistent schemas, permissions, and lineage. They asked:
“For tonight’s starter, show first‑pitch mix and locations to our right�‑handed hitters and left‑handed hitters over the last two seasons. Highlight trends when runners are on base.”
Genie compiled the answer from governed Delta tables in Unity Catalog. As part of that work, the analyst also registered a set of Unity Catalog SQL functions that encapsulate the key queries, such as tendencies by count, hand, and base‑runner state, so they can reuse them in future planning and in automated agents.
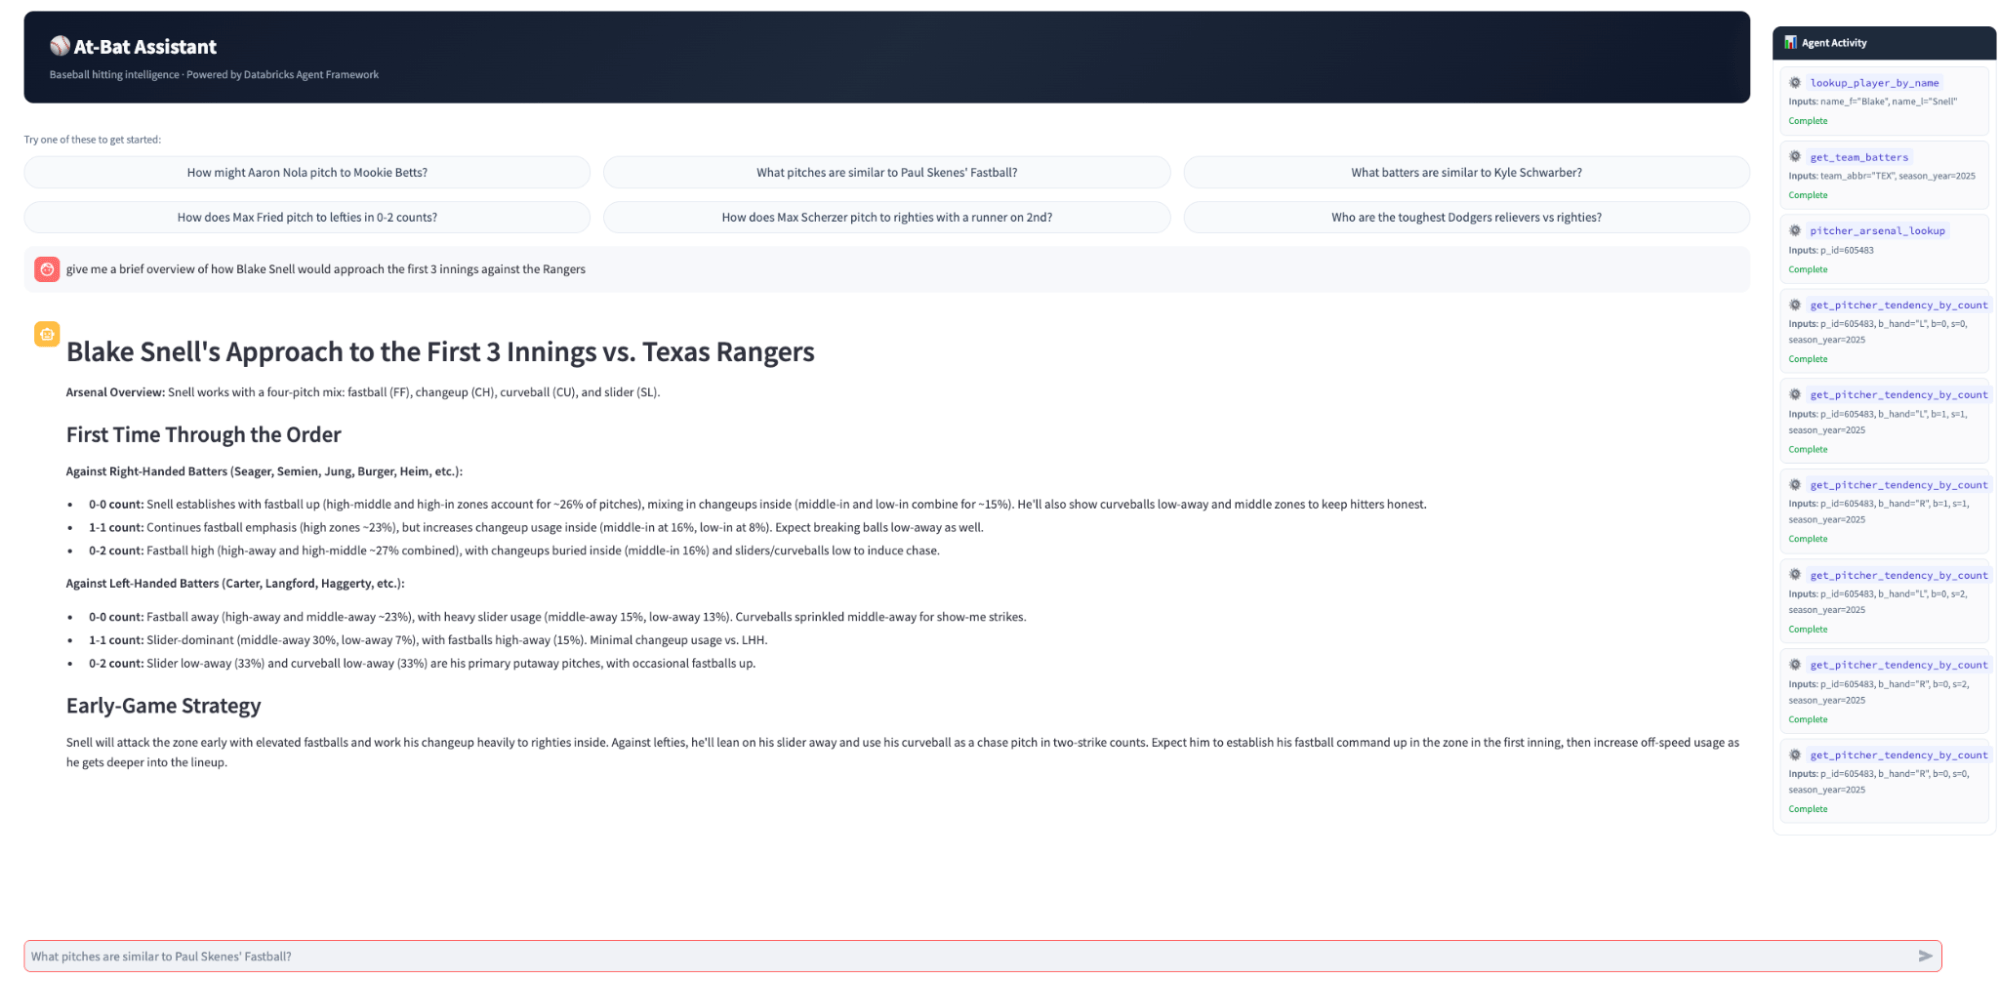
The analyst exported the results into a simple one‑pager the staff could print or include in hitters’ binders. The key points were:
- Righties: high cutters and four‑seamers early, especially with bases empty.
- Lefties: more changeups and sinkers when there is a runner on second.
- Two strikes: slider down and away appears in most big punch‑outs.
The hitting coach walks into the meeting with three clear talking points. By the time players head to batting practice, the first two trips through the order are not guesses; they are anchored in a shared view of how tonight’s starter actually pitches.
Pre‑series bullpen prep
Scripting pitching changes with Agent Framework and Model Serving
The staff knows there will be a point in most games when the starter is near 100 pitches and the heart of the order is coming up. The choice between a sinkerballer and a slider‑first righty will feel like a gut call in the moment, but the work happens earlier.
In the clubhouse before the series, the analyst uses a Multi-Agent Supervisor, built with Agent Bricks and deployed on Model Serving, to simulate the pockets the staff cares about: heart of the order in the sixth, bottom third in the seventh, lefty‑heavy clusters in the late innings.
For each decision, the agent:
- Resolves the relevant hitters’ names to IDs using a lookup function in Unity Catalog.
- Calls UC SQL functions that compute pitch‑type and location outcomes by count, hand, and base‑runner state.
- Compares each reliever’s arsenal to that pocket of hitters and explains which profiles play best and why, in plain baseball language.
The analyst turns this into a short bullpen card. For example:
- “If these three hitters are due up and the starter is tiring, the slider‑first righty is favored; here is how his mix has played in similar pockets.”
- “If the bottom third is due, the sinkerballer’s ground‑ball profile wins more often; here is the evidence.”
The staff prints the card and reviews it together. When the actual sixth‑inning situation appears during the game, no one is logging into Databricks. The pitching coach is following a decision tree the staff already pressure‑tested with the agent hours before.
Late‑inning offense
Pinch‑hit decision planning with the same agent and tools
Pinch‑hit choices in the eighth inning are rehearsed the same way.
As part of pre‑game prep, the analyst asks the Databricks agent:
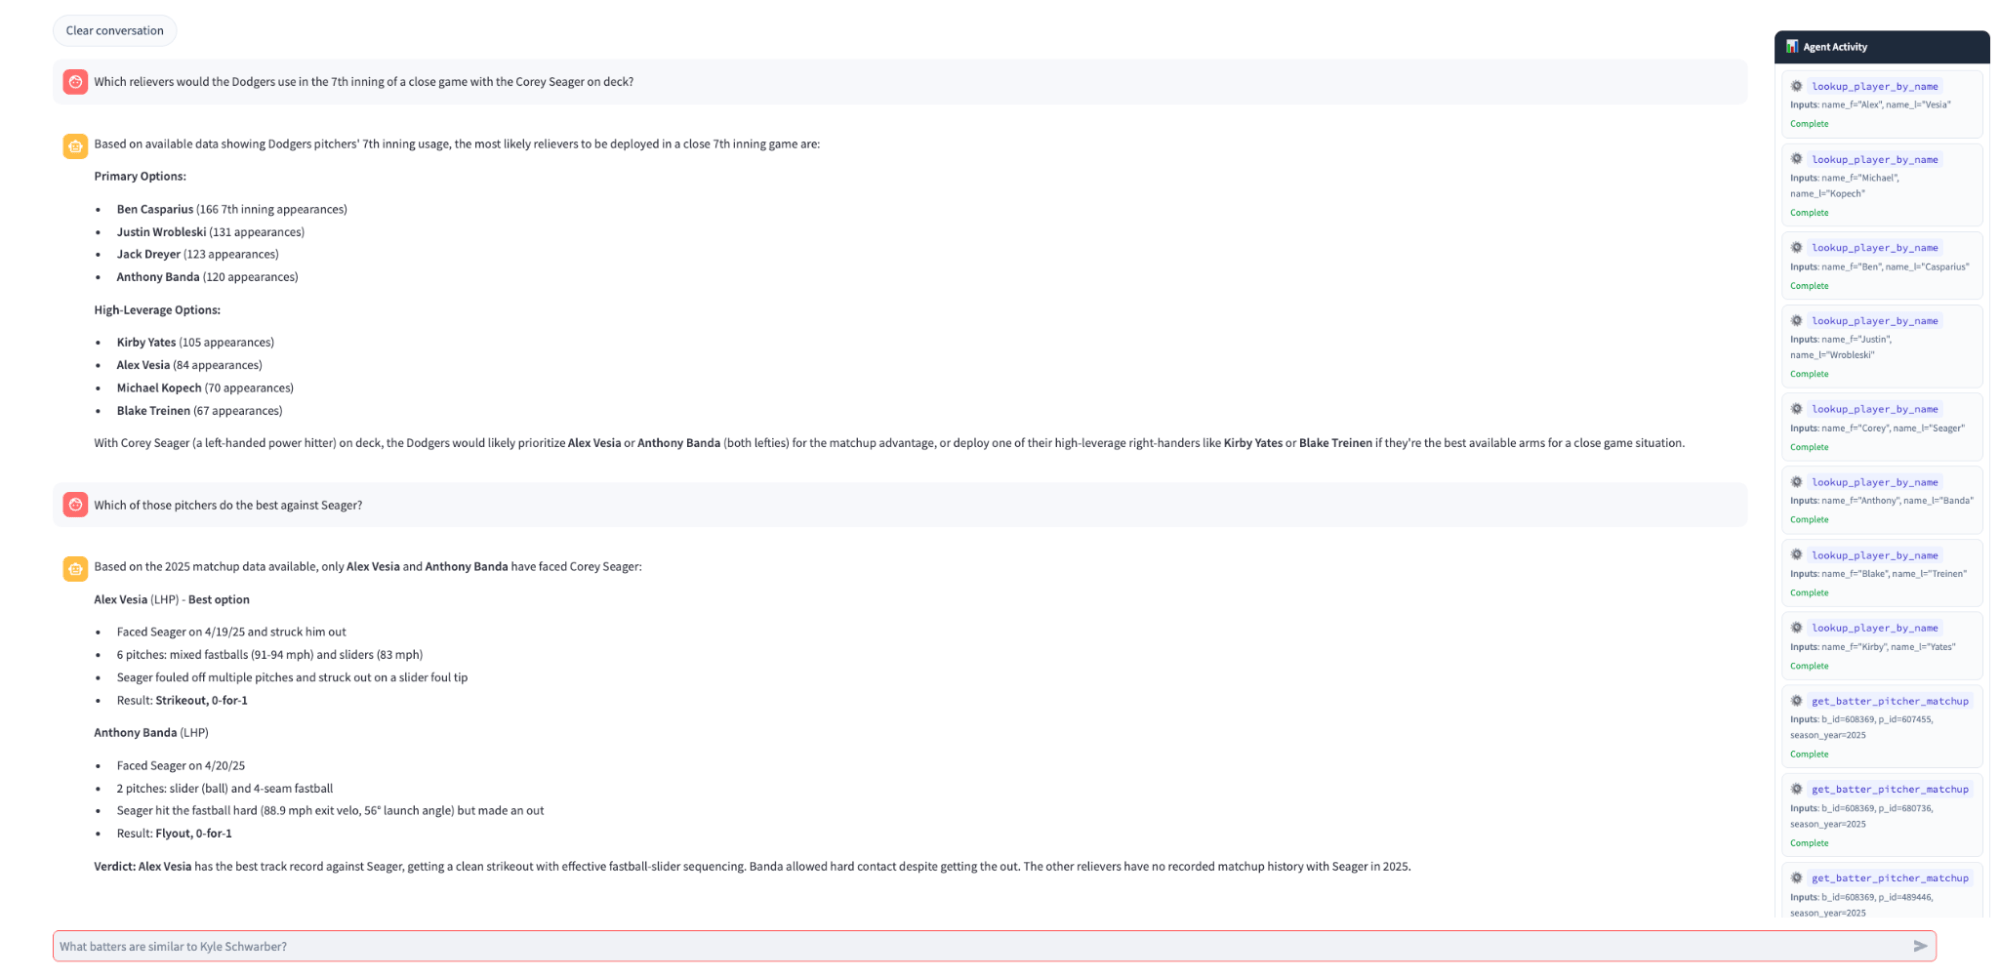
“For the likely late‑inning relievers we will see in this series, rank our bench bats by expected outcome, and explain when each is the better option.”
The agent calls the same UC functions and Delta tables in Unity Catalog to:
- Combine each reliever’s usage pattern with each bench hitter’s outcomes by pitch type, location, and count.
- Simulate likely late‑game scenarios, such as runners on first and second, one out, facing a right‑handed reliever who leans on cutters.
- Produce straightforward guidance, such as: “Against Reliever X, Hitter A profiles better with runners on, while Hitter B is a better fit in bases‑empty spots when he leans on sinkers.”
The analyst drops these recommendations into the manager’s game card or a small one‑page “pinch‑hit grid” that can be reviewed in advance. Once the game starts, the card becomes the reference point. The manager is choosing between options they have already walked through, with the data distilled into a format that respects league rules about devices in the dugout.
Travel day
Advance scouting with AI Search and Unity Catalog
On the off day between series, the analyst turns from single‑game tactics to what is coming next. Two upcoming starters have limited direct history against the lineup.
Back in Genie, they ask:
“Find pitchers whose arsenals and movement profiles are most similar to our upcoming starters, then show how our lineup has fared against those comparable arms.”
Here, Genie hands part of the job to Databricks AI Search. Pitcher and hitter embeddings, stored in Unity Catalog from prior processing, are indexed so the system can find “similar pitchers” without guessing by eye.
The workflow is:
- Genie analyzes the new starters’ pitch mix and movement from Unity Catalog tables.
- AI Search finds pitchers with similar pitch profiles.
- UC SQL functions compute lineup outcomes versus those comparable pitchers.
- Genie summarizes the patterns into a scouting report the hitting coach can use.
When head‑to‑head Statcast history is thin, this combination of AI Search and Genie gives the staff a way to say, “Here is how we have hit pitchers who look like this,” and bake that into the series plan. Those insights are then exported into the advance report, ready for the next road meeting.
Front office day
GM and analysts with Genie, Lakehouse, and Lakebase
Winning seasons are built on more than one game. The GM and analysts use the same platform to make calls about value, fit, and risk.
In Genie, they explore questions like:
“Show how our number three starter’s profile plays against the top lineups in our division by count and hand. Where does his value come from, and where are we exposed?”
“For left‑handed bats around the league, identify players whose strengths match up with how our division is pitched in late innings.”
These questions are answered directly from the lakehouse in Unity Catalog. Pitch‑level data, embeddings, and derived features are all governed in one place. Genie turns them into natural‑language answers, but under the hood the logic is still reusable UC SQL functions.
Meanwhile, the baseball operations app that coaches, scouts, and the front office use is backed by Lakebase Postgres. That app is where:
- Scouts enter reports on potential trade targets.
- Coaches tag higher‑level decisions, such as “Went slider‑first in sixth versus heart of order,” after the game.
- The GM records final calls on trades, extensions, and roster moves.
Because Lakebase Postgres is part of the Databricks platform, app state is kept close to the source data:
- App writes (reports, tags, decisions) go into Lakebase Postgres and are available immediately to analysts and agents who have access.
- Scheduled jobs or pipelines publish curated slices of Unity Catalog tables into Lakebase Postgres, so the app UI always has the latest stats and features without manual CSV exports.
The result is shared memory. What happened, why it happened, and how it was justified are stored in one place, with timestamps and user identity.
Why this wins games
- Smarter roster bets: Player moves align with how the league is pitched, especially in the division and in October.
- Higher quality plate appearances: Hitters sit on what a pitcher actually throws in that moment, not what he throws in general.
- Cleaner bullpen matchups: Each reliever’s best situations are obvious in seconds, reducing guesswork under clock pressure.
- Fewer waste pitches in leverage: Knowing the put‑away pitch by hitter and count reduces deep counts and free passes.
- Better first‑pitch outcomes: Attack plans that flip expected choices create early contact on the team’s terms.
All of that only matters if the numbers are right. By running these agents and apps on top of a single governed lakehouse instead of scattered one‑off tools, clubs can see that the logic matches the work they already do and lean on it in big spots. When the data points to a specific matchup or move, it feels like an extension of the game plan, not a black box.
Learn more about Databricks Sports, or request a demo to see how your organization can drive competitive insights.
Get the latest posts in your inbox
Subscribe to our blog and get the latest posts delivered to your inbox.