How Zalando built a unified data foundation for AI and analytics on Databricks
Zalando separates data creation from consumption, standardizes metric definitions, and enables reliable natural language queries across dashboards and AI.
by Fabian Halkivaha, Mukrram Ur Rahman, Maria Vedenina and Timur Yüre
- Zalando built a unified data foundation on Databricks with Unity Catalog, Metric Views, and Genie to govern data, standardize metrics, and enable natural language analytics.
- They centralized business logic using Metric Views (“metrics as code”), solving inconsistent metric definitions across dashboards, SQL, and pipelines.
- By grounding Genie in this semantic layer, Zalando delivers reliable natural language queries, reducing time to answer new questions and improving trust in results.
At Zalando, a leading European online platform for fashion and lifestyle, we orchestrate a massive digital ecosystem that connects over 50 million active customers with more than 7,000 brands and partners across Europe. Every customer interaction (browse, order, return, etc.) generates a pulse of data that drives our decision-making, from personalized recommendations to logistics optimization.
Operating at this scale comes with a unique set of challenges. Our data landscape is vast and complex, fed by a microservices architecture that streams terabytes of events into our central data lake. While this architecture allowed us to scale rapidly, it also made governance challenging and blurred the distinction between Transactional Data (day-to-day business operations) and Analytical Data (decision-making insights).
For years, we strived for a distributed approach to solve this by decentralizing ownership, so domain teams (like "Payments" or "Logistics") could manage their own data products. A centralized governance structure is crucial in this setup to ensure a manageable load on teams and prevent business risk. Additionally, without a unified layer to define truth, we face the metric divergence challenge: Why does the Marketing dashboard show a different "Net Revenue" than the Finance report? Since metrics live in silos, it is difficult to govern them and ensure they are discoverable and trustworthy for reusability throughout their lifecycle.
In this post, we will share how Zalando is achieving this by leveraging the full breadth of the Databricks Platform. We will dive into how we are building a Unified Semantic Layer that bridges the gap between Transactional Data and Analytical Data. Specifically, we will cover:
- The Foundation: How Unity Catalog enables federated governance and secure sharing across hundreds of teams.
- The Semantic Layer: How Unity Catalog Business Semantics, powered by Metric Views, lets us define business logic once and serve it everywhere.
- The Conversational AI-Powered Analytics: How we leverage the semantic layer through Genie, a generative AI-powered interface that allows users to query data using natural language without needing SQL expertise, helping us make faster, data-driven decisions.
The Foundation – Democratizing Governance with Unity Catalog
To manage our vast data landscape effectively, we decided to move away from resource-centric gatekeeping. In that model, every new dataset or consumer required bespoke IAM roles, S3 bucket policies, and exception handling. But we identified challenges: permissions were fragmented across thousands of resources, cumbersome to review, and prone to drift. Therefore, we shifted to an identity-based governance approach. Access decisions are expressed as reusable policies tied to people and groups. They are evaluated consistently across datasets and enforced centrally. This makes access easier to operate, audit, and evolve as teams and data change. We built this foundation using Databricks Unity Catalog and implemented a federated access control framework on top.
The Architecture
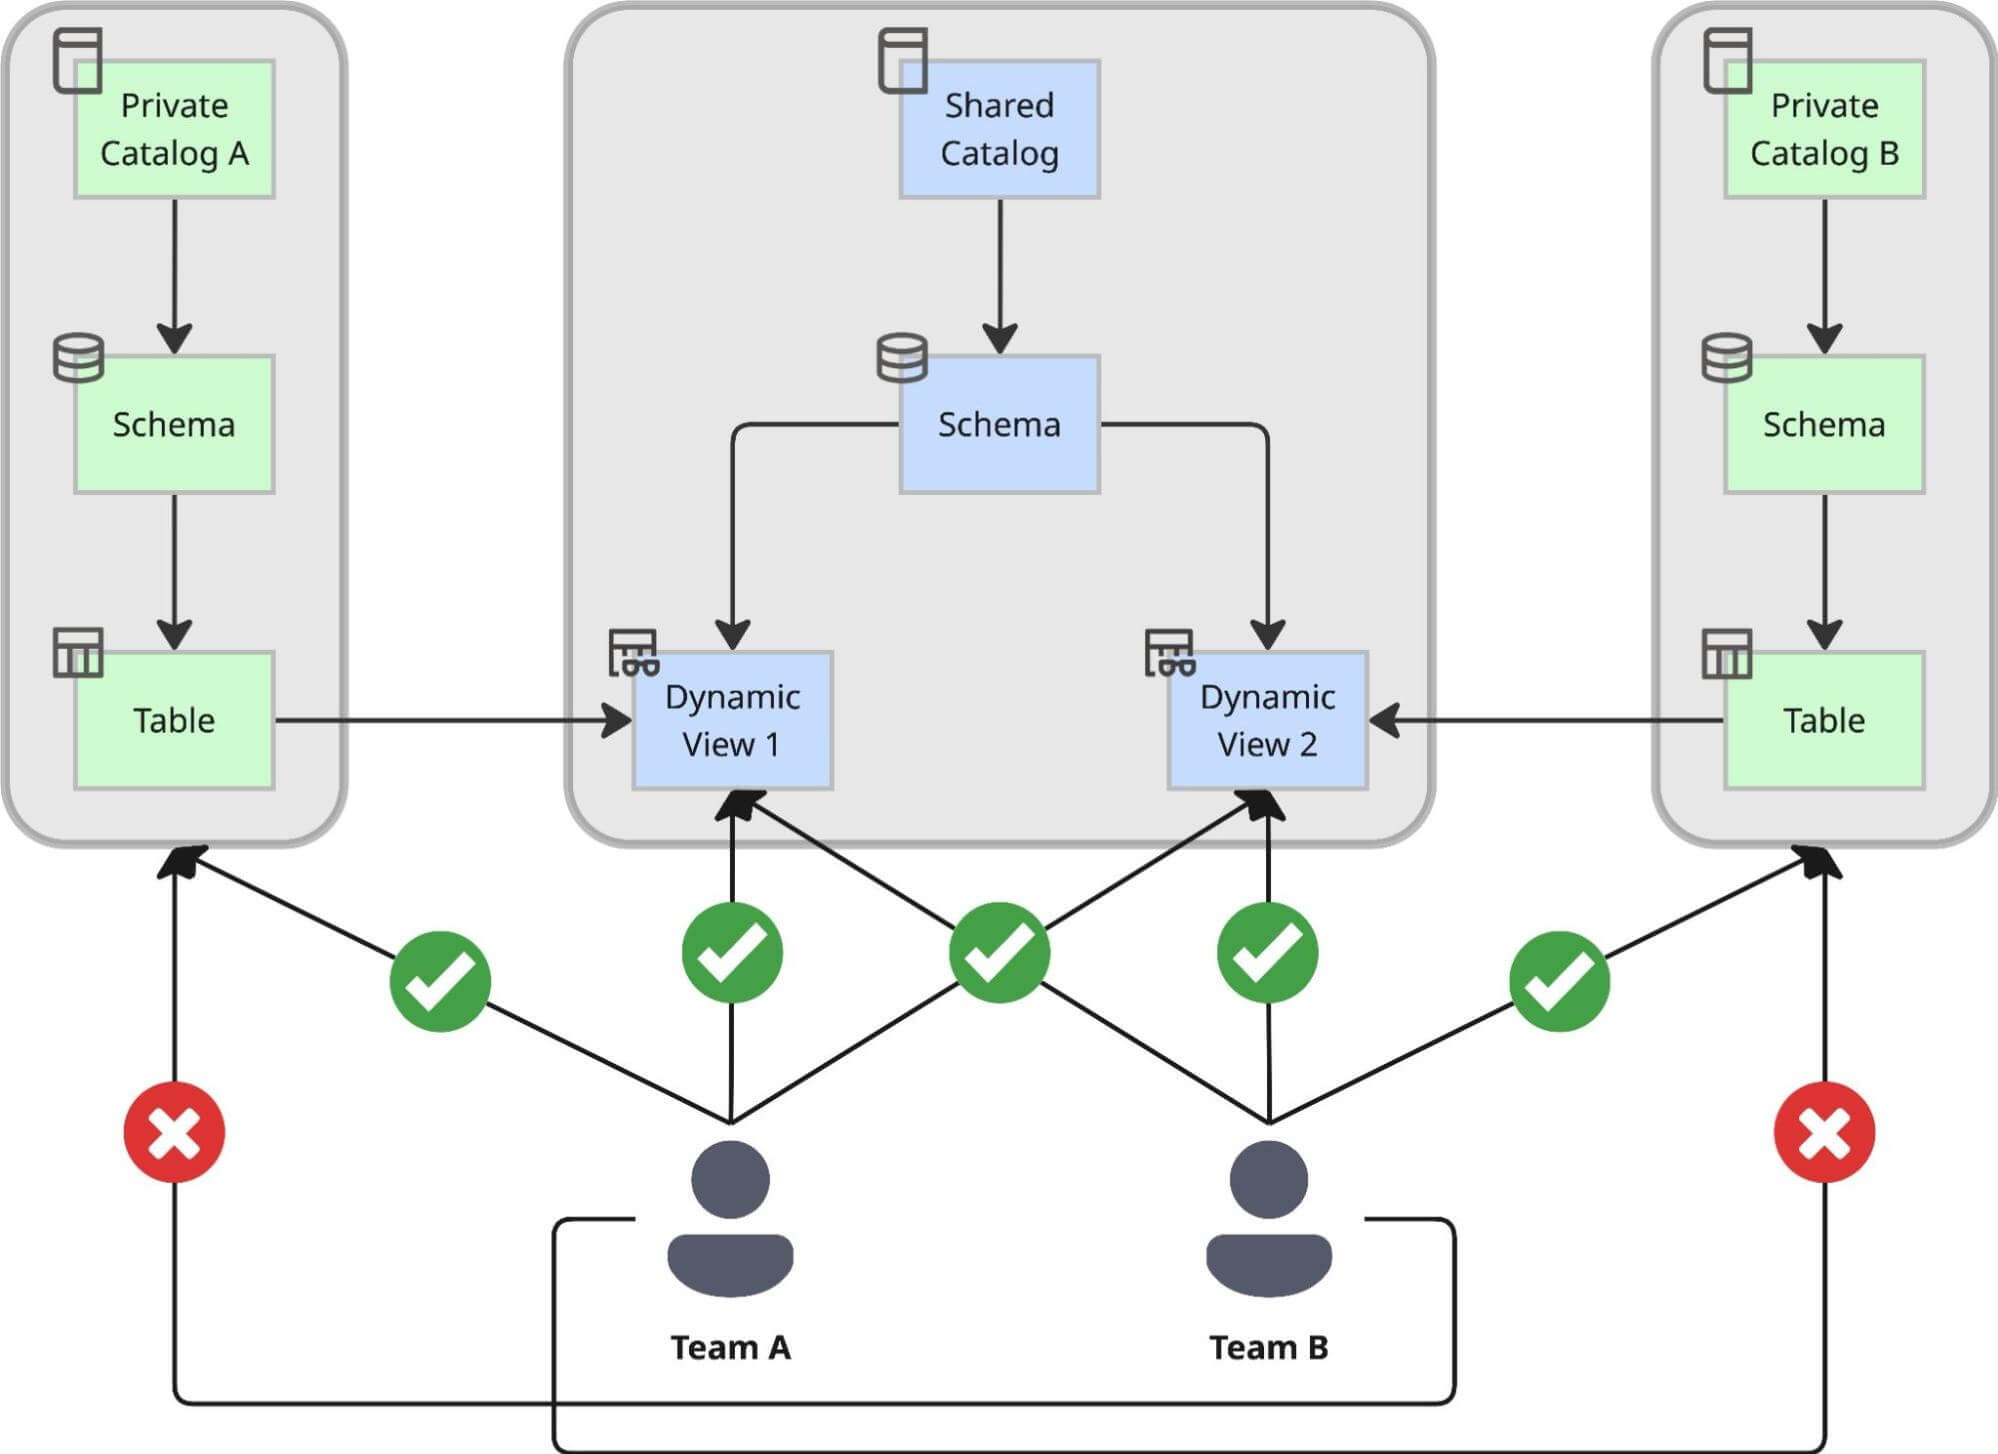
We designed a dual-catalog pattern that strictly separates the creation of data from its consumption, ensuring that agility doesn't come at the cost of control:
- Private Catalogs for Autonomy: Every domain team creates its own Private Catalog using an internal self-service solution. Inside this private environment, the team can create schemas, ingest raw data, and build tables at their own pace without waiting for central approval. This serves as their "factory," optimized for unrestricted development and iteration. The only limitation they face is that all objects created here are accessible solely by the team itself, plus a limited number of related contributors. This means the use cases built on top of these catalogs are not intended for company-wide use.
- The Central Shared Catalog for Governance: For use cases where various teams across the company need to use these datasets, we introduced a central shared catalog. This acts as the company-wide "showroom." All data shared across the organization must be exposed here via Dynamic Views, where it falls under strict central governance. The moment data lands here, it’s instantly discoverable through Unity Catalog.
Why Dynamic Views? Centralized Control and Auditability
We made a strategic decision to expose data in the shared catalog exclusively via Dynamic Views, rather than direct table pointers. This approach allows us to enforce a centralized access process capable of handling complex compliance rules.
By using Dynamic Views as the serving layer, we achieved:
- Custom Process Rules for GDPR: We inject custom logic directly into the view definition using functions like is_account_group_member(). This ensures robust access control by checking whether users meet antitrust requirements and are authorized to access sensitive data (like email).
- Default Compliant Insider Access: Due to an automated classification process, each column is classified. All non-sensitive columns are accessible to a wide variety of users by default, which speeds up data democratization and decision-making.
- Full Auditability: Because all cross-team access flows through these centrally managed views, we maintain a complete audit trail of access decisions. We know exactly which policy granted a user access to a specific row or column.
- Reliable Insights: To prevent the generation of incorrect data or misleading numbers due to partial aggregation, any query attempting to access a sensitive column without the necessary specific authorization will explicitly fail with a permission denied error.
Governance as Code: The Sharing Workflow
To keep this process efficient, we automated the sharing workflow using a GitOps approach:
- Pull Request to Share: When a team is ready to share a dataset from their private catalog to the shared catalog, they don't file a ticket. They open a Pull Request (PR) in a central repository with a configuration file pointing to their source table.
- Approval Rules: The Pull Request is checked for sharing criteria, uniqueness and other important decision factors.
- Automated Validation and Provisioning: Once the PR is approved and merged, our platform service automatically generates the corresponding Dynamic View in the central shared catalog and automatically classifies the columns.
This setup allows us to maintain the agility of distributed teams while enforcing a centralized, fully auditable governance standard that keeps our data easily discoverable, secure, and compliant.
The Semantic Layer – Defining "The Truth" with Metric Views
With the secure foundation we established for accessing data, we are now focused on ensuring consistent data interpretation.
We are actively centralizing business logic that was previously fragmented across the data stack:
- BI tools: Metric definitions embedded in individual dashboards
- SQL scripts: Logic duplicated across notebooks and pipelines
- Materialized tables: Precomputed metrics tied to specific use cases
We are unifying thousands of metric definitions into a single, governed layer. This allows us to break “logic lock-in”: the definition of “Net Merchandise Value” (NMV) in one dashboarding tool becomes fully accessible to a data scientist working in a notebook or to an AI bot answering a user’s question.
To achieve this, we are adopting Databricks Metric Views as our unified semantic layer. This decisively decouples the definition of a metric from its consumption, guaranteeing that users receive the exact same calculated result whether they query via a SQL editor, a dashboard, or an AI agent. In practice, this ensures that both technical and non-technical users use the same metric definitions.
Metric as Code: The Metric Lifecycle
We implement a rigorous "Metric as Code" approach to our semantic layer, just as we utilize GitOps for data sharing in Unity Catalog. We ensure consistency across all teams by centralizing and standardizing every KPI definition.
Our architecture manages the entire lifecycle of a metric:
- Definition in YAML: Metrics are defined in code (YAML files) stored in a central repository. This captures not just the aggregation logic (e.g., SUM(amount)) and relationships between tables, facts and metrics, but also critical metadata like ownership, description, and formatting.
- Automated Validation: Before a metric can be merged into production, our CI/CD pipeline runs a suite of automated checks. These include:
- Uniqueness: Ensuring no metric with the same name or definition already exists.
- Conformity: Enforcing naming conventions (e.g., snake_case) to ensure discoverability.
- Ownership: Verifying that a valid team ID is attached to the metric for accountability.
- Human in the loop: Through the 4-eyes principle, each Pull Request is reviewed by domain experts.
- Individual Development Environments: To allow teams to iterate quickly while still testing in an environment very close to production, every Pull Request deploys the Metric Views into a separate testing environment. This setup makes it possible to verify the implications of the change immediately.
Building a Star Schema for the Lakehouse
Under the hood, we rely on established dimensional modeling principles. Each Metric View in our production environment acts as a standard interface, typically mapping 1-to-1 with our Fact tables while inheriting attributes from conformed Dimension tables.
This setup is crucial for our scale. By enforcing that Metric Views are built on top of the trusted data in our Shared Catalog (from Section 1), we ensure that the semantic layer inherits all the security and compliance benefits of the underlying platform. A user querying a metric view is still subject to the same row-level and column-level security, and access rules we defined in the Unity Catalog layer. We will also enhance this setup later this year with an additional authorization layer via the Metric Views, so that users no longer need raw data access, but only metric and dimension level access.
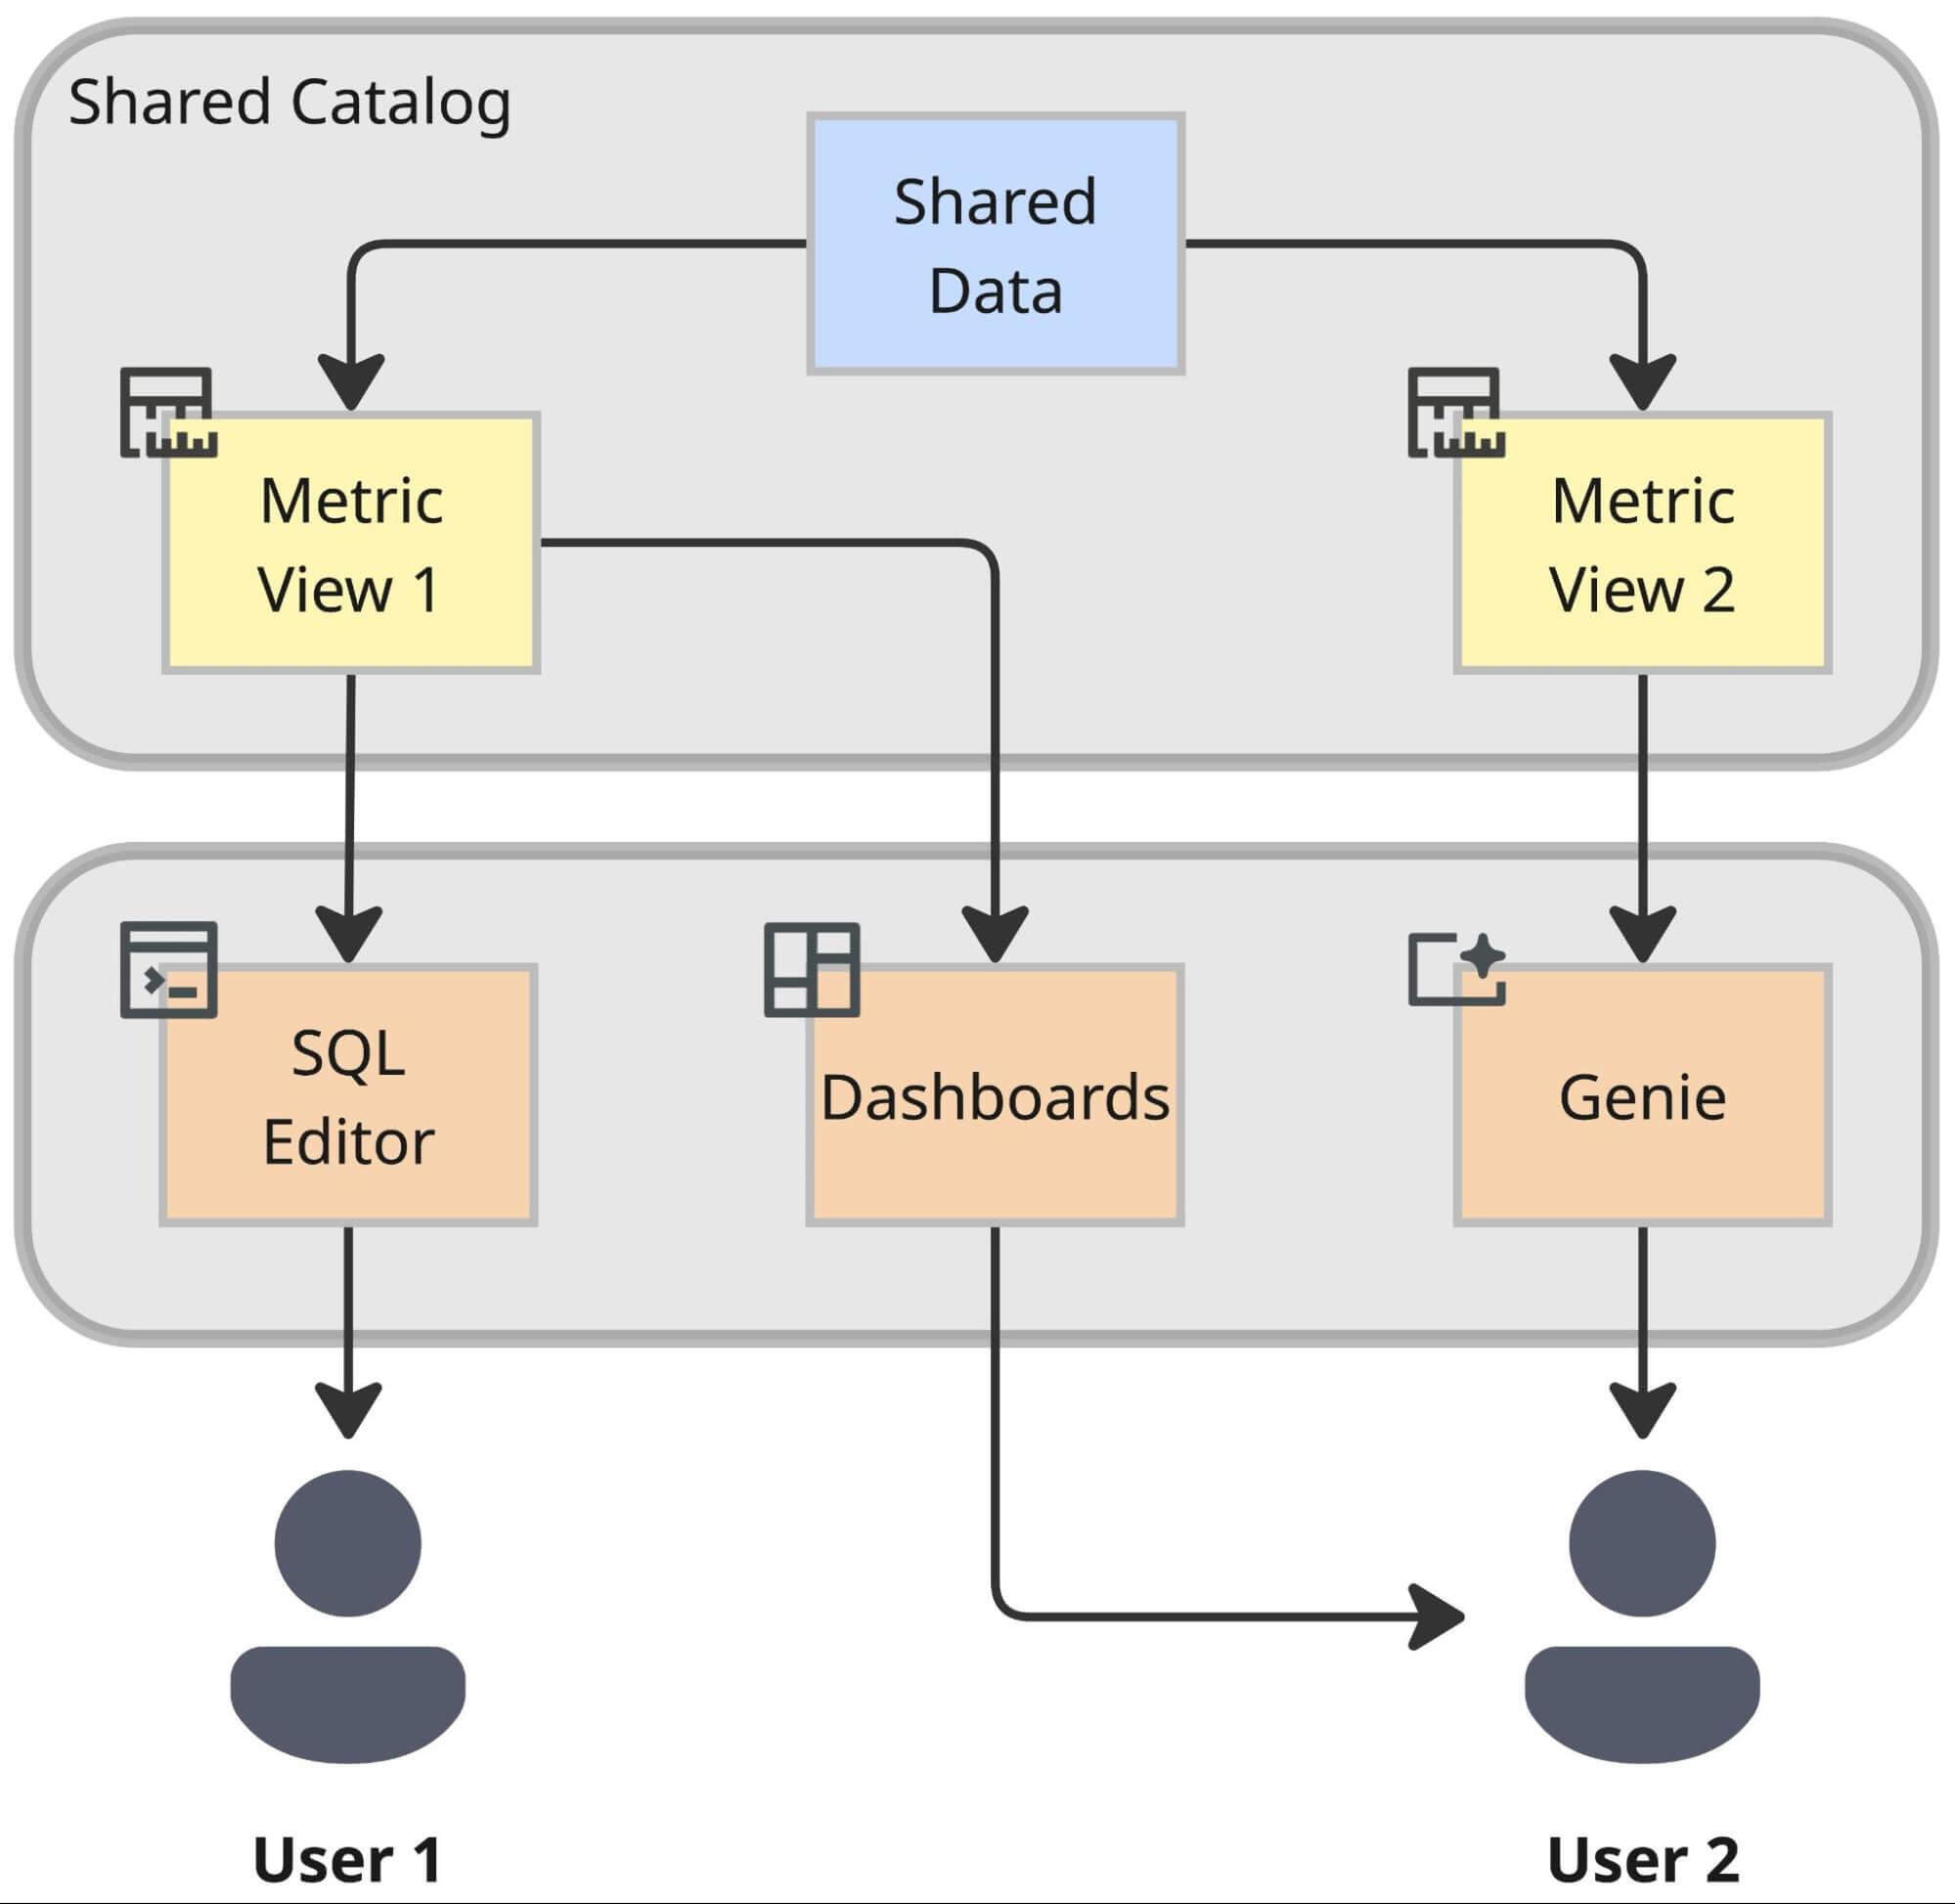
The Result: Interoperability
The payoff of this architecture is interoperability. By lifting business logic out of proprietary BI tools and into the Lakehouse semantic layer, we prepare ourselves for the future. A metric defined once in this layer becomes instantly available to:
- Databricks Dashboards for standard reporting.
- Genie for AI-powered analysis in a conversational interface using natural language.
- External Tools and Applications via standardized connectors.
This centralization is the key unlock for our next major step: empowering the business to "talk" to their data.
The Conversational AI-Powered Analytics
Dashboards are essential for answering everyday, recurring questions. However, the speed of business often outpaces the ability of standard reporting to capture everything. For instance, a Category Manager might need to know: "Which sneaker brands had a high click-through rate but didn't make it into the top 10 by number of items sold in Germany last week?" Answering novel questions like this one, not addressed by existing standard reports, frequently required the construction of a new dashboard. Even with self-service tools, a significant "time-to-insight" lag persisted. Users had to find the right dataset, configure widgets, and apply filters before they could get an answer. This often resulted in one-off dashboards, contributing to dashboard sprawl and reduced discoverability.
To optimize the user experience, we evaluated several “Talk-to-Data” solutions offering LLM-powered conversational interfaces, often referred to as AI chatbots. Genie performed best because it is grounded in a unified semantic layer, while solutions without this layer struggled to generate accurate SQL for complex business logic.
This is why the introduction of Metric Views proved instrumental for the conversational AI-powered analytics like Genie. By directing Genie towards the pre-established Metric Views (as detailed in Section 2), we achieved a critical breakthrough: consistent, reliable answers grounded in governed business definitions.
Why Metric Views increases AI accuracy drastically
The biggest barrier to adopting AI in analytics is trust. If an LLM hallucinates a SQL query, the numbers will be wrong, and users will lose faith.
Genie solves this by working with our semantic layer in Metric Views.
- No Guesswork: When a user asks for "NMV" (Net Merchandise Value), Genie doesn't try to calculate it from raw tables. It recognizes "NMV" as a governed metric in our metric view and simply queries the pre-defined logic. Thus, the metric view reduces the complexity of generating a SQL statement, leading to higher accuracy.
- Context-Aware: We heavily invested in enriching our Unity Catalog metadata, adding descriptions, synonyms, and sample queries. Genie uses this context to understand that when a user says "Cancellations," they specifically mean orders cancelled before shipment, matching our internal definition.
Empowering the Frontline
We tested Genie with non-technical teams, such as Merchandisers, Buyers, and Pricing Analysts, who had historically relied on Excel exports or BI tools. The feedback was immediate: users could get quick answers to granular questions (e.g., specific market performance paired with specific device type) without needing to know a single line of SQL or spending time building a custom report view.
The introduction of the new Agent Mode has significantly enhanced the user experience. The Agent Mode automatically analyzes data to pinpoint the root cause of analysis results, allowing users to simply ask "why" something happened. At Zalando, this could reduce the preparation time for our regular performance meetings—where critical steering decisions are made—from several hours to just a few minutes.
However, with its extensive functionality, Genie can also get expensive if not set-up correctly, for example, on unaggregated tables and views. That is why it’s critical to carefully curate the data and context Genie uses. Additionally, we recognize the potential for further enhancement, such as the benefit of introducing full Genie version control and enabling programmatic updates to Genie configurations, which Databricks is already working on and which is currently already partially supported.
Scaling Genie for the Enterprise Adoption
We aren't just treating Genie as a sandbox experiment; we are integrating it into our enterprise operations. Our focus areas for scaling include:
- Establishing Governance: Curated Genie spaces will be underpinned by governed and properly maintained Metric Views.
- Ensuring Data Reliability: We are collaborating with data-owning teams to establish curated Genie spaces. These spaces will offer analytical representations of their data via Metric Views, ensuring data quality is maintained by the data owners themselves.
- Integrating with Agent Bricks or using Genies in Databricks One: We plan to orchestrate these curated Genie spaces using either Agent Bricks or using Genies within Databricks One. This approach ensures users have a single, unified entry point for all their data inquiries.
By combining the governance of Unity Catalog, the standardization of business logic through Metric Views, and the intelligence of Genie, we are building a data culture where "asking the data" is as easy as asking a colleague.
Thank you to Merve Karali, Tobias Efinger, and Roberto Bruno Martins for contributing to this post.
Get the latest posts in your inbox
Subscribe to our blog and get the latest posts delivered to your inbox.