Tutorial: How to ship AI/BI Dashboard changes safely at scale with Databricks Asset Bundles
Deploy analytics with confidence: A complete walkthrough to build trusted, scalable AI/BI dashboards without manual processes
by Eason Gao, Noah Sommerfeld and Jen Lim
- Deploy org-wide and impactful dashboards with confidence and stability.
- Maintain trust with visible, reviewable, and reversible changes and history.
- Update dashboard metrics and logic as business definitions change - without disrupting production reporting.
The thought of a board meeting starting with a dashboard full of errors should keep analytics teams up at night. So should discovering, after the fact, that a hiring plan, product launch, or revenue forecast was based on an incorrect metric. Or that a support team issued way too many refunds because a dashboard misrepresented a customer’s purchase history.
These failures are rarely caused by bad analysis. Like any production system, they often stem from dashboards being updated manually as data models and requirements evolve - without versioning, without a reliable review process, or without a repeatable way to promote changes across environments.
This blog post makes a simple case: production-grade dashboards that drive the business must be managed with the same discipline as production code. Because Databricks AI/BI runs on the same Data Intelligence Platform as your data pipelines and governance layer, teams can apply those same production practices - version control, environment-specific configuration, and controlled deployment - to dashboards as well.
To make this concrete, we’ll present how analysts can use production-grade Databricks capabilities without changing how they author dashboards day to day.
Specifically, we’ll show how this flow lets you:
- Review and approve each change to a dashboard
- Track the history of a dashboard, and tie code changes to business requirements
- Roll back a dashboard to an earlier version
Prerequisites
This workflow requires some one-time infrastructure setup that most organizations already have in place. If you don’t already have these, ask your internal DevOps or IT group to help you set up:
- At least two Databricks workspaces (for example, a development and production workspace) to author, test, and deploy dashboards
- Git-backed folders in Databricks (AWS | Azure | GCP), used to version dashboard definitions
- Databricks Asset Bundles (DABs) (AWS | Azure | GCP) configured for the project
Introduction: A structured workflow for shipping dashboard changes safely
We’ll walk through a realistic scenario: you own a Sales Performance dashboard used weekly by Finance and Sales leadership. It started as an intern project built directly in a workspace, but has evolved over time and now is used in several executive reviews.
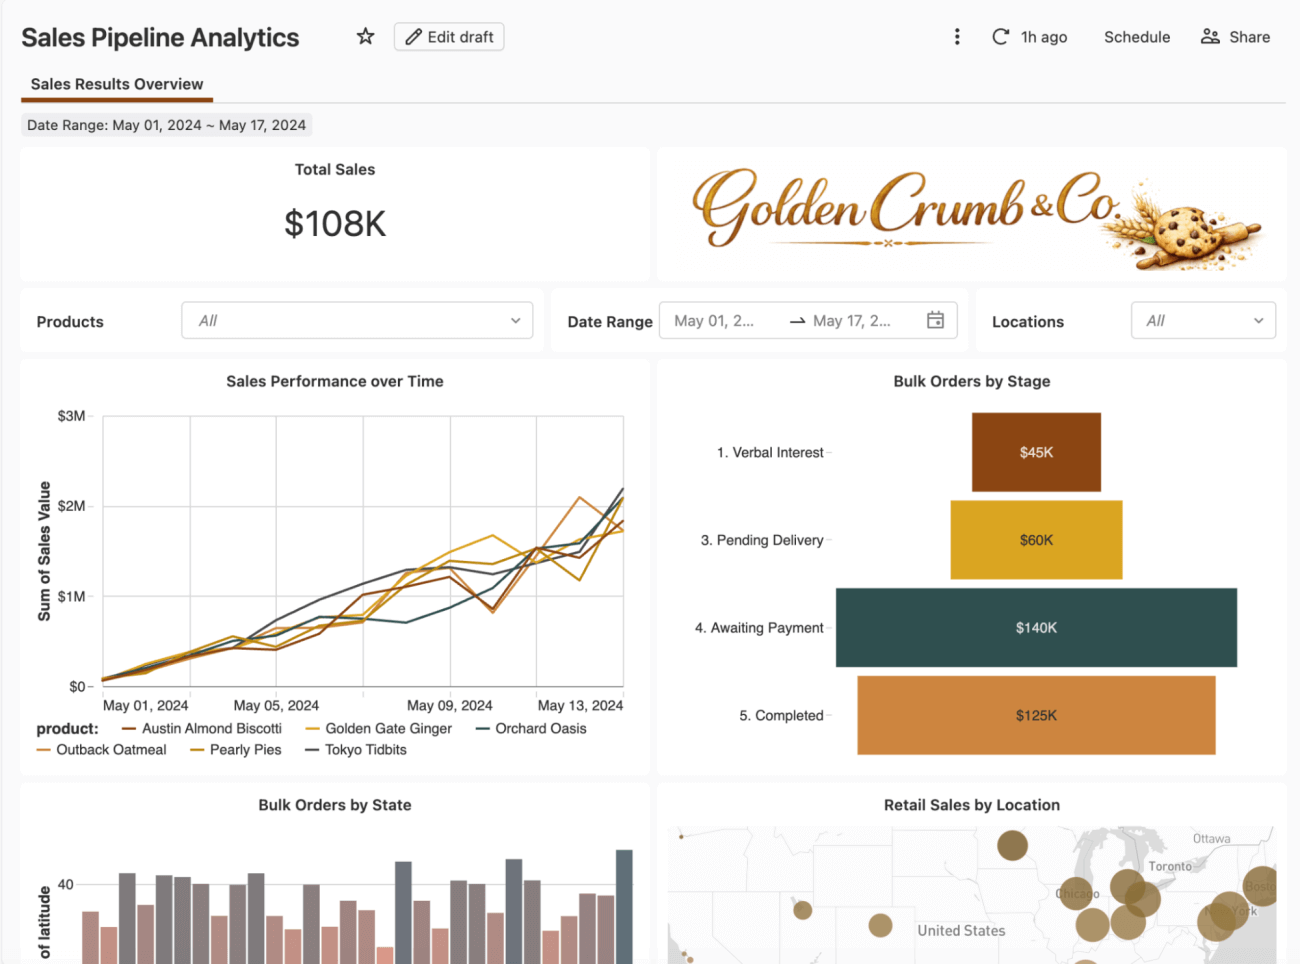
A shift in priorities from a board meeting brings a new requirement: Finance now needs to track committed and uncommitted sales amounts, replacing a single aggregated sales metric, and the dashboard has to reflect the new definition before the next forecast review.
These values feed directly into real business decisions, including compensation and bonus calculations, so let’s take this dashboard and put it on a disciplined deployment path for the first time.
Step 1: Add the dashboard into a Databricks Asset Bundle
Before starting the process, work with your IT group to get set up with some basic code tools: a Git repository with an empty ‘Databricks Asset Bundle’, and some ci/cd scripts to automatically deploy the bundle.
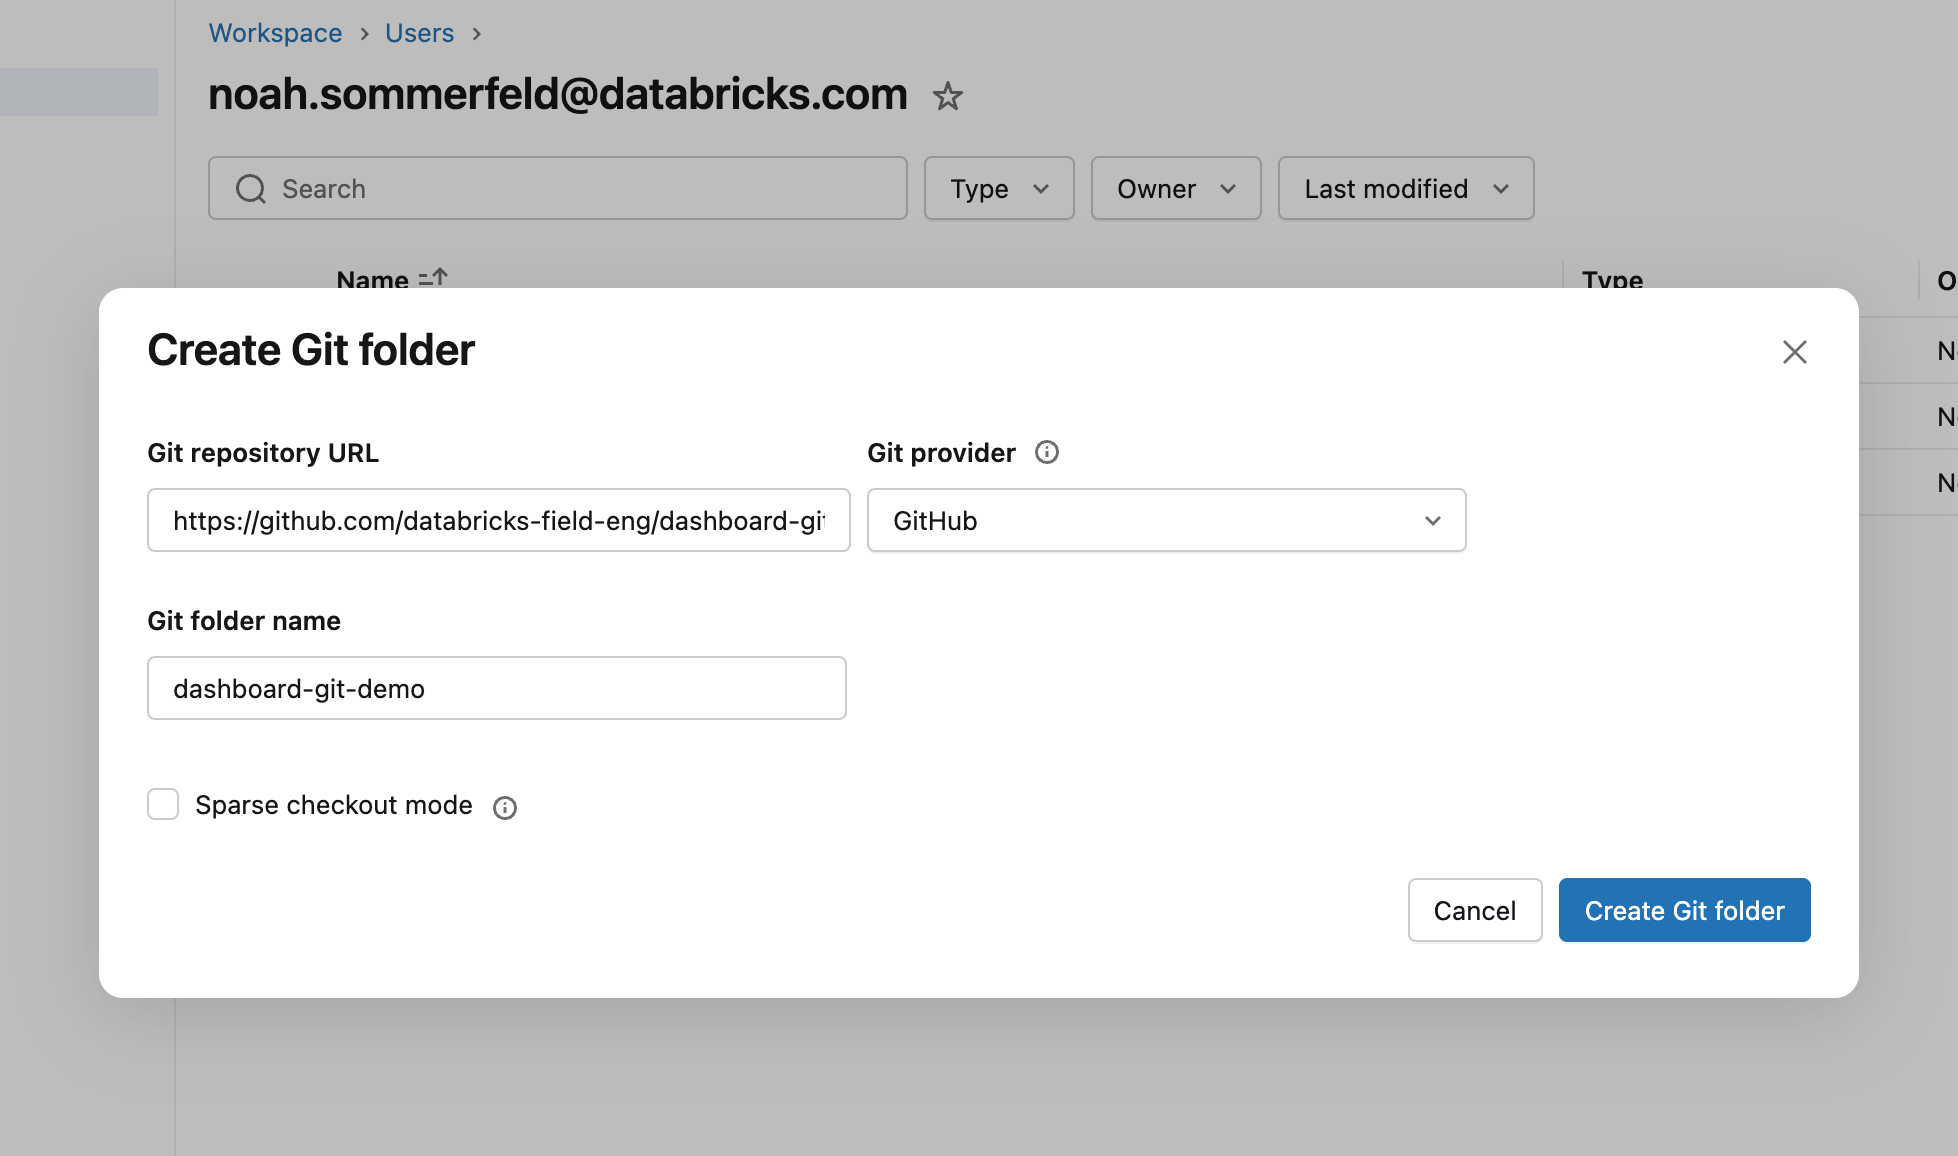
A Git repository is a tool to track file changes - to get started, we need to connect it to Databricks so we can track the changes to the dashboard configuration. From the Databricks workspace, create a Git folder and paste in the repository URL into the setup dialog. This makes Databricks aware of the repository and allows us to add the dashboard to it in the next step.
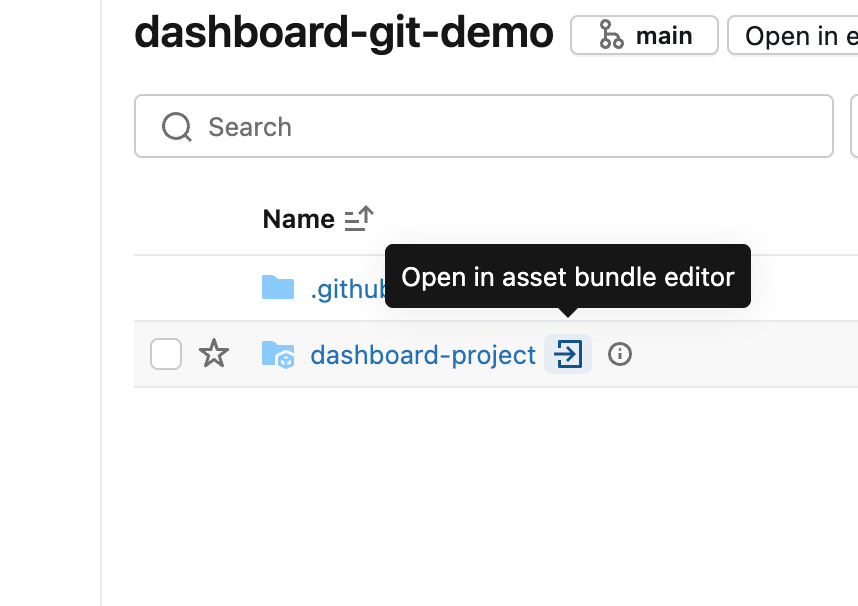
A Databricks Asset Bundle is a way of grouping code files (in this case, a dashboard) together. If the repository already contains a bundle, it’s automatically detected and can be opened using the arrow icon. Otherwise, a new bundle can be created from the Create menu in the Git folder.
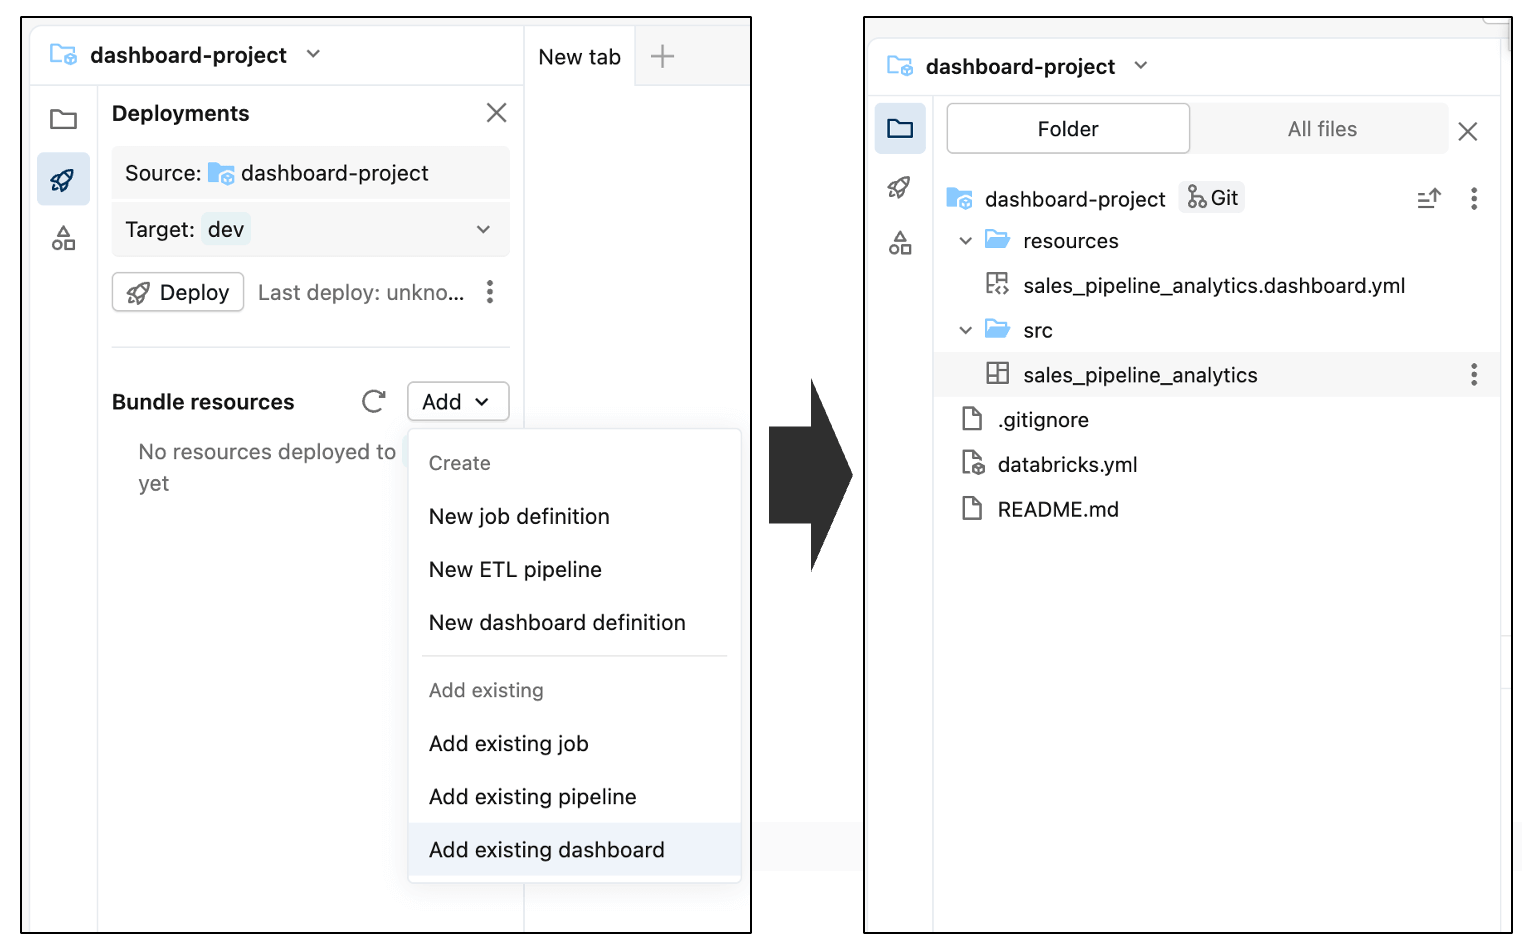
Inside the Asset Bundle editor, you can add both new and existing components to the bundle that’s currently empty. To include the dashboard, open the Add menu and select Add existing dashboard. After adding it, you’ll see the dashboard appear inside the src folder as part of the bundle.
From this point on, the dashboard is managed as a deployable asset, making it easy to promote the same dashboard across development, test, and production workspaces.
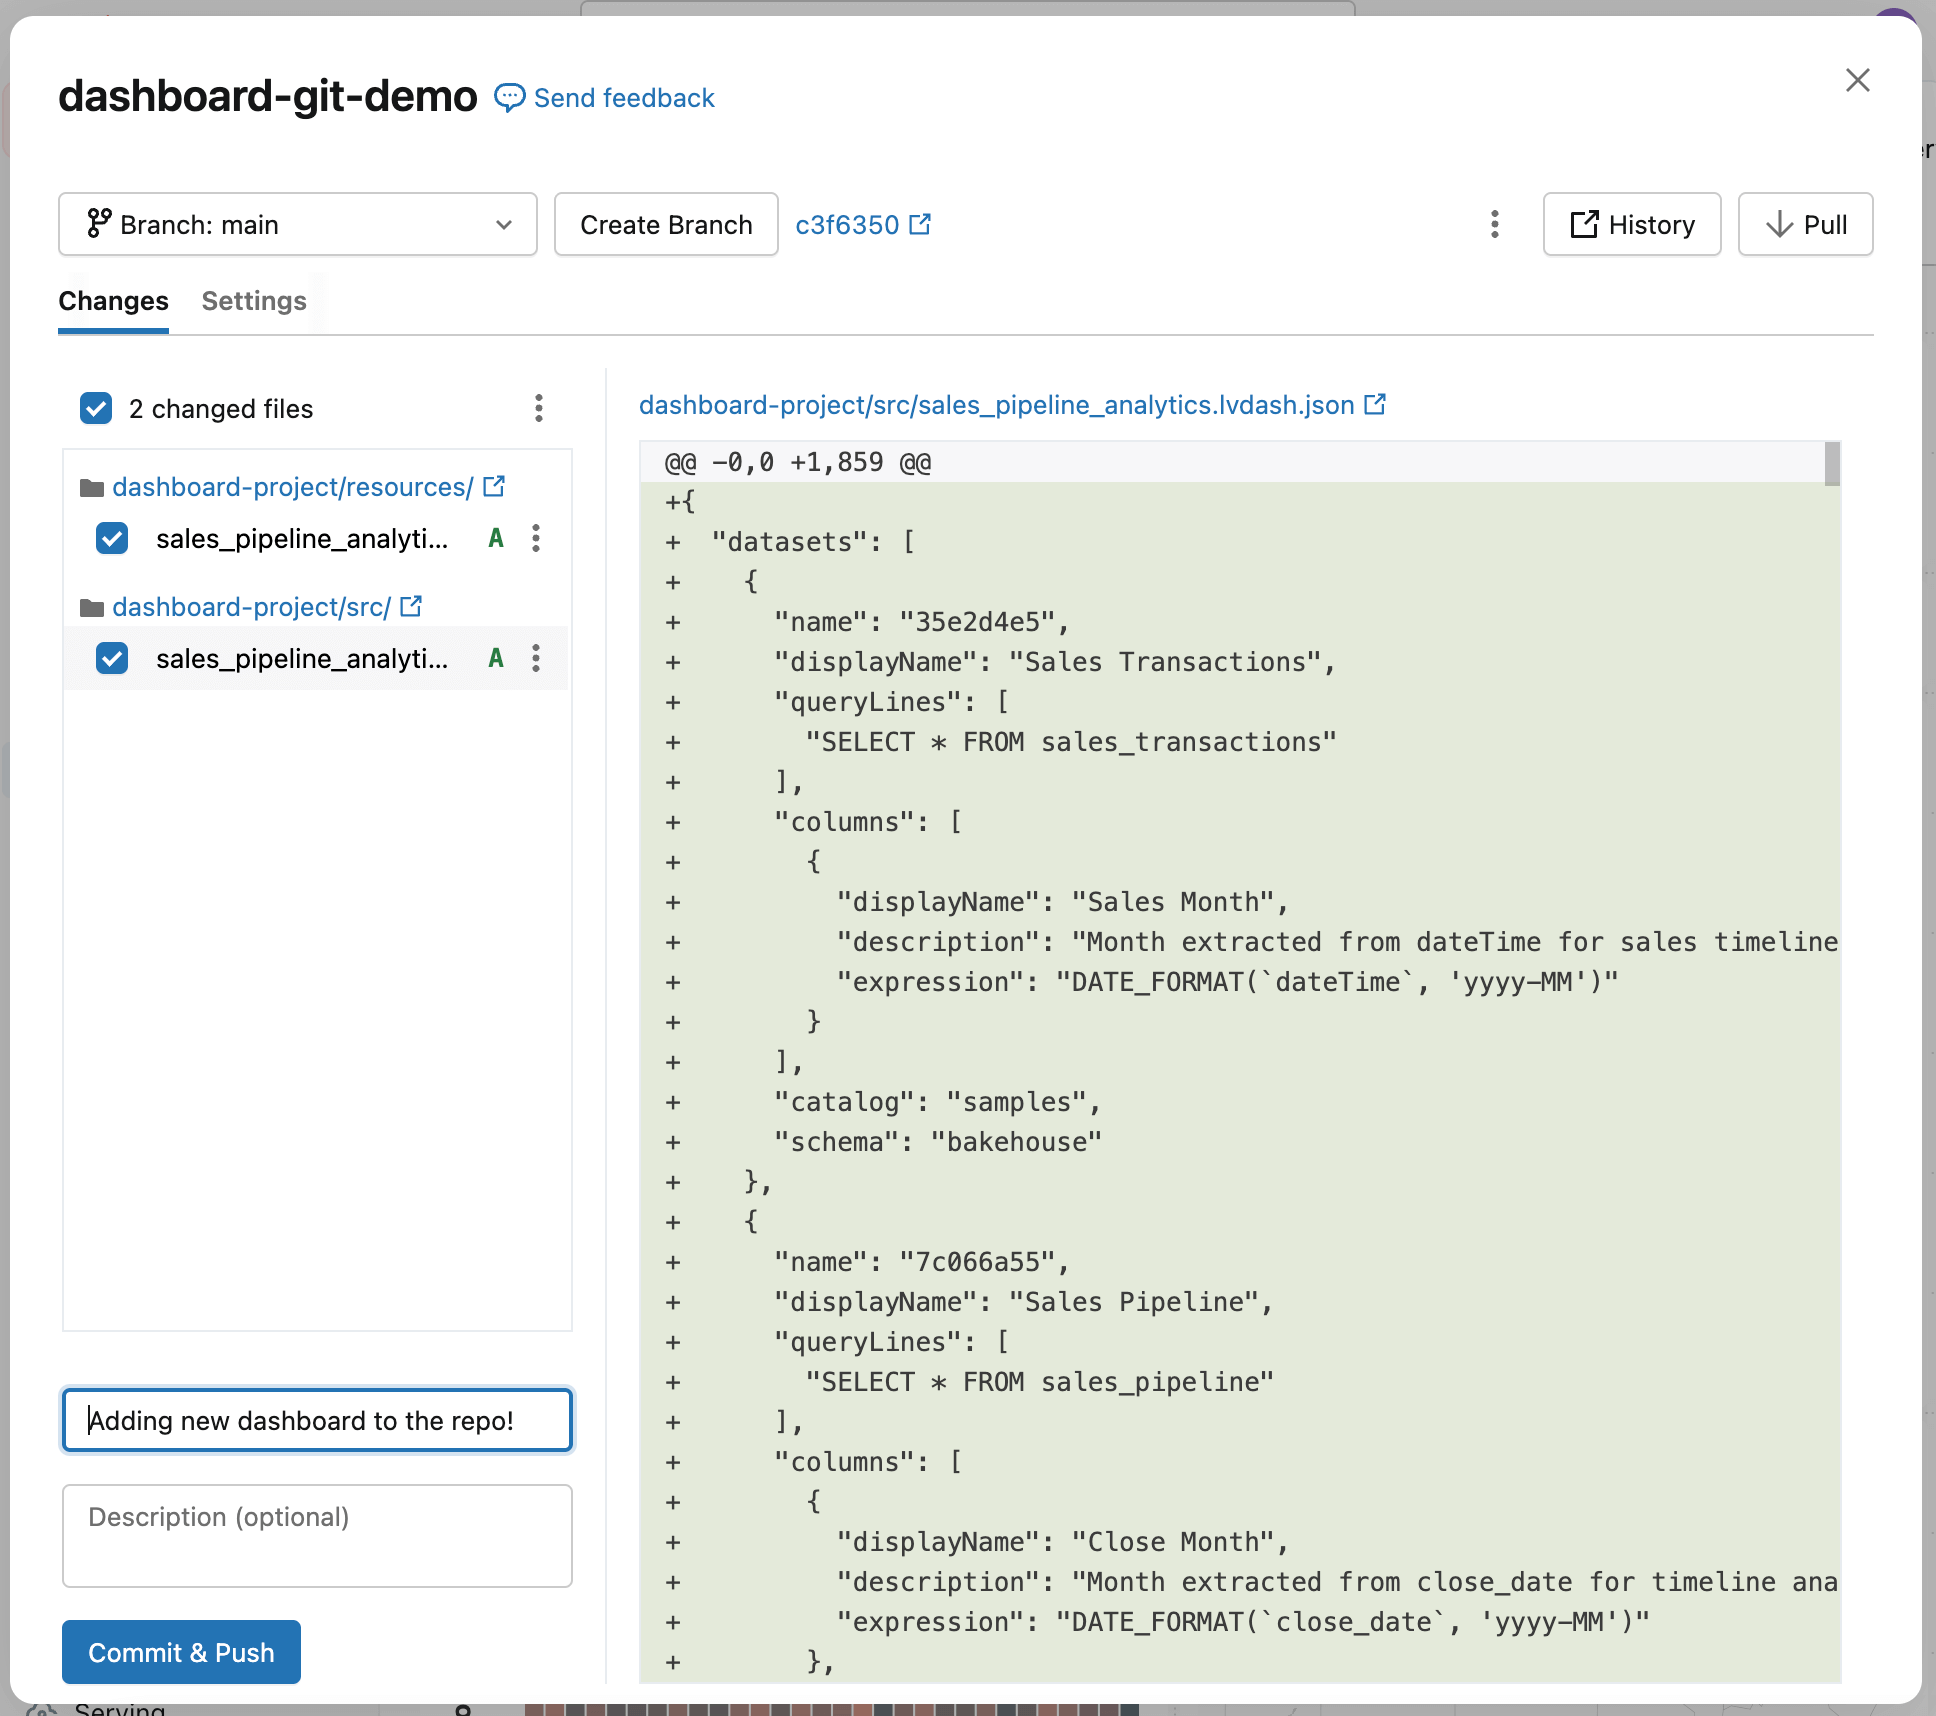
Finally, commit the dashboard to the repository. This captures the current state of the dashboard as a baseline and establishes a clear starting point for tracking and reviewing future changes.
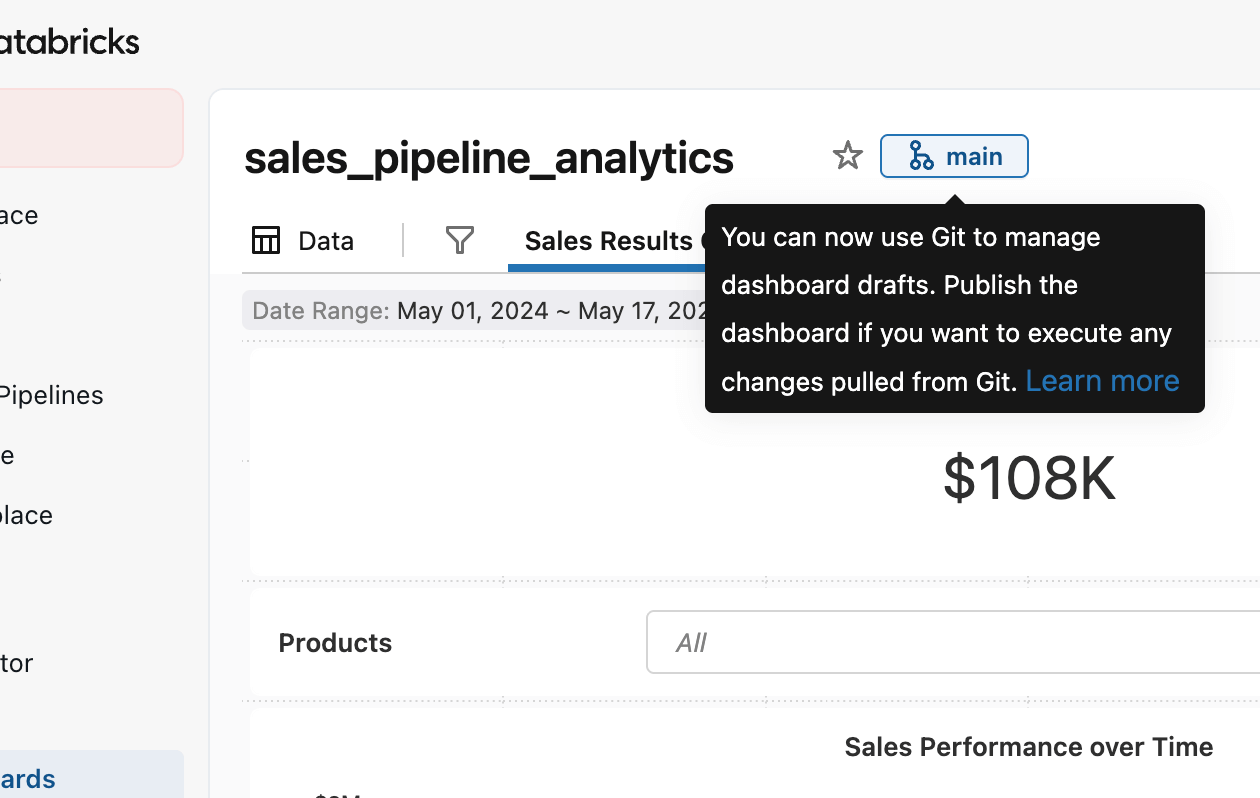
You’ll see the dashboard was added to the repository, along with a few automatically generated configuration files (ending with .yml). These files describe how the dashboard should be deployed in different environments—you don’t need to edit them.
Add a short note describing what you did in the commit message field, then select Commit & Push. This creates a checkpoint for the dashboard—a known-good state you can return to later—so future changes can be compared, reviewed, and safely deployed.
Step 2: Update the dashboard
Now that the existing dashboard has been committed, you can start making changes to it without affecting what’s already in production and git will track the specific changes that you’ve made.
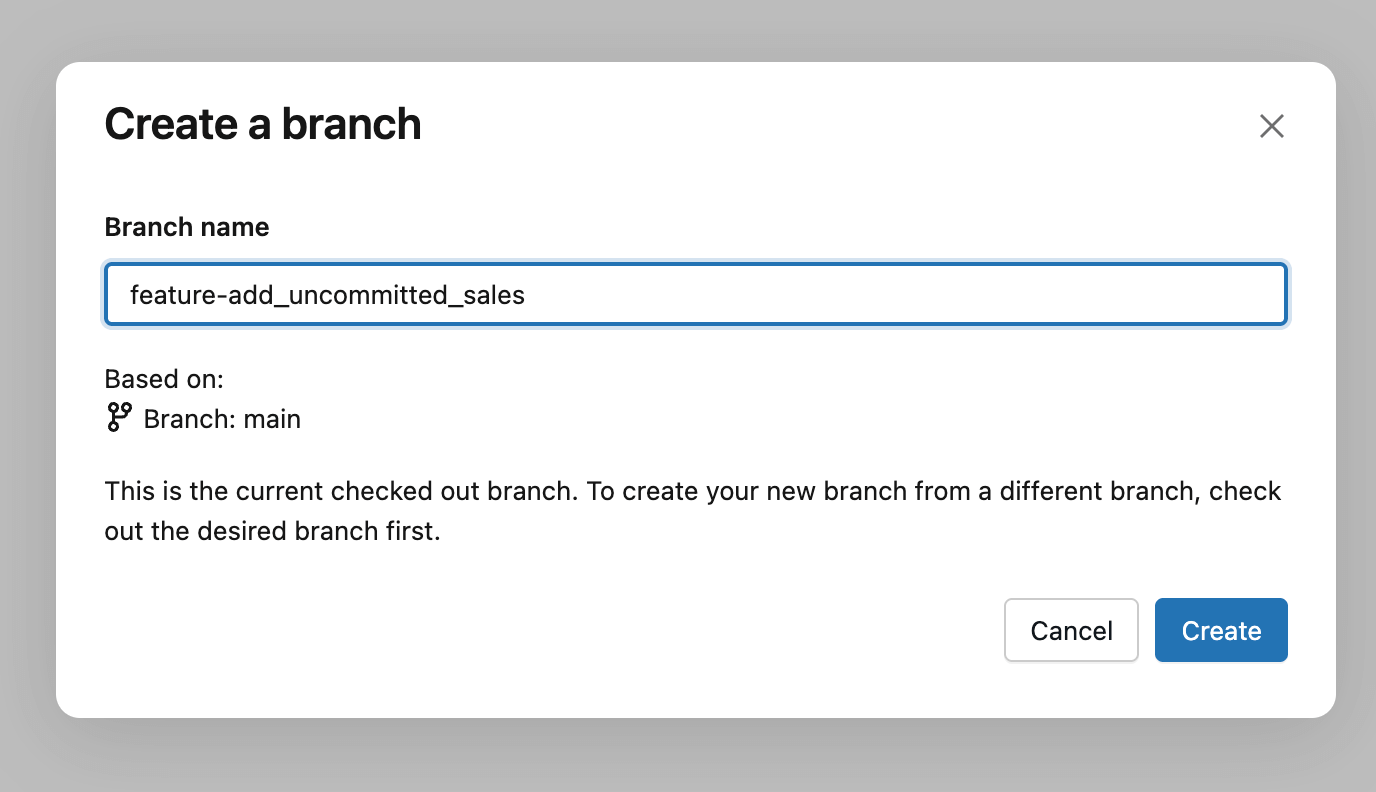
The general practice is to create a Git branch - a version of the dashboard to work on without affecting others. You can do this via the Create Branch button, and then give it a descriptive name like your name, feature, or a ticket number associated with the change. Think of this as a private version for your update: you can edit, test, and refine the dashboard freely, and then separately decide when your changes are ready to be reviewed and deployed.
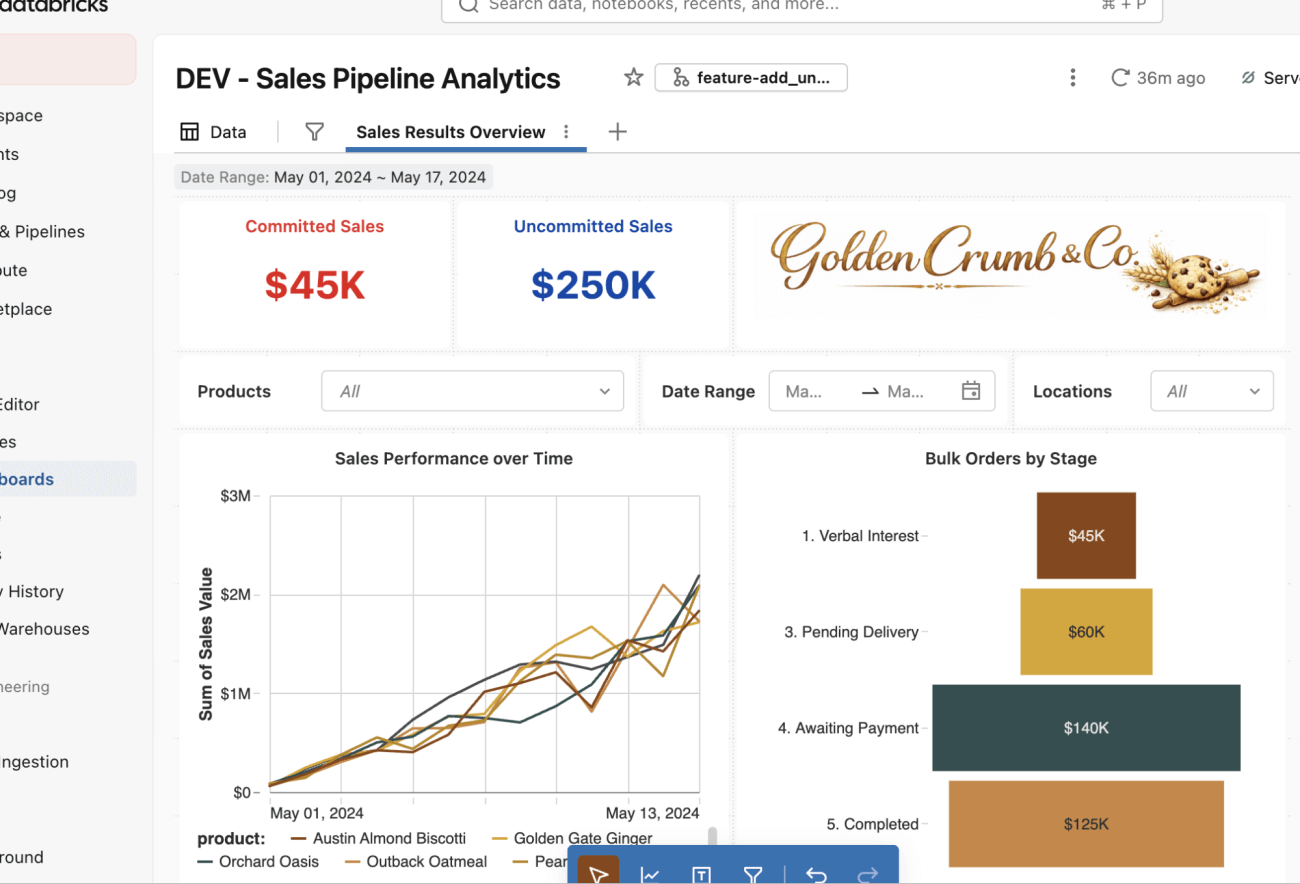
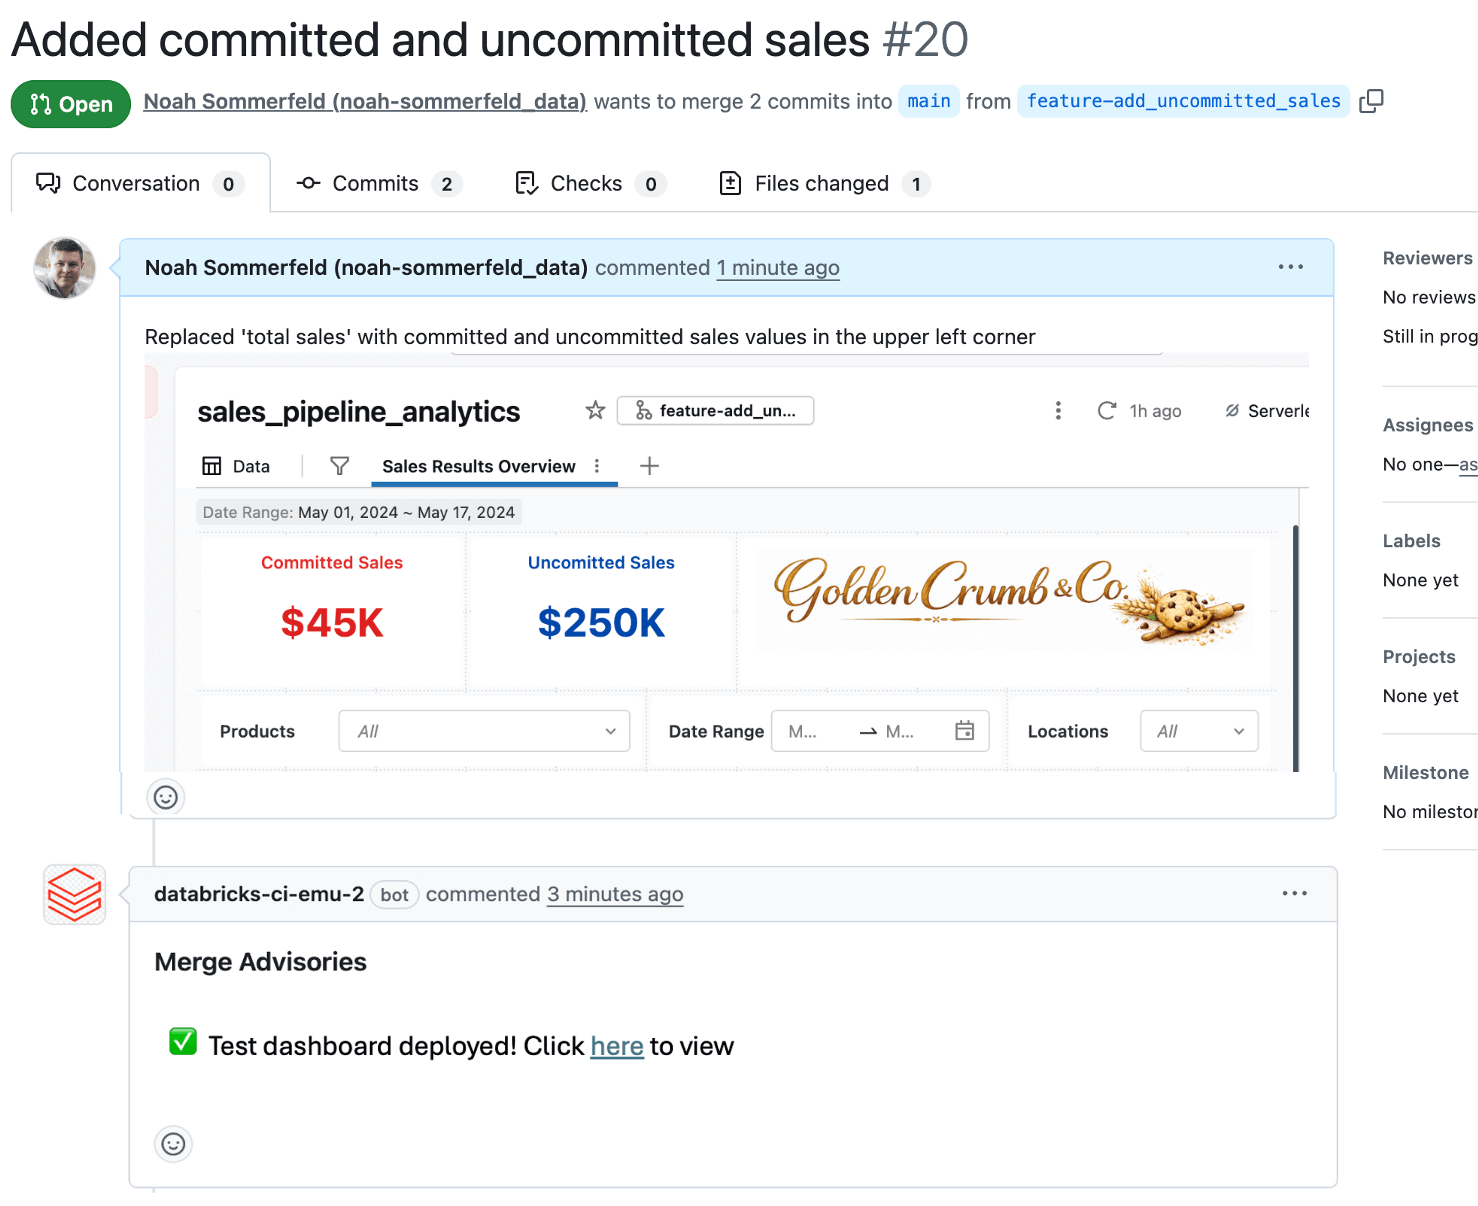
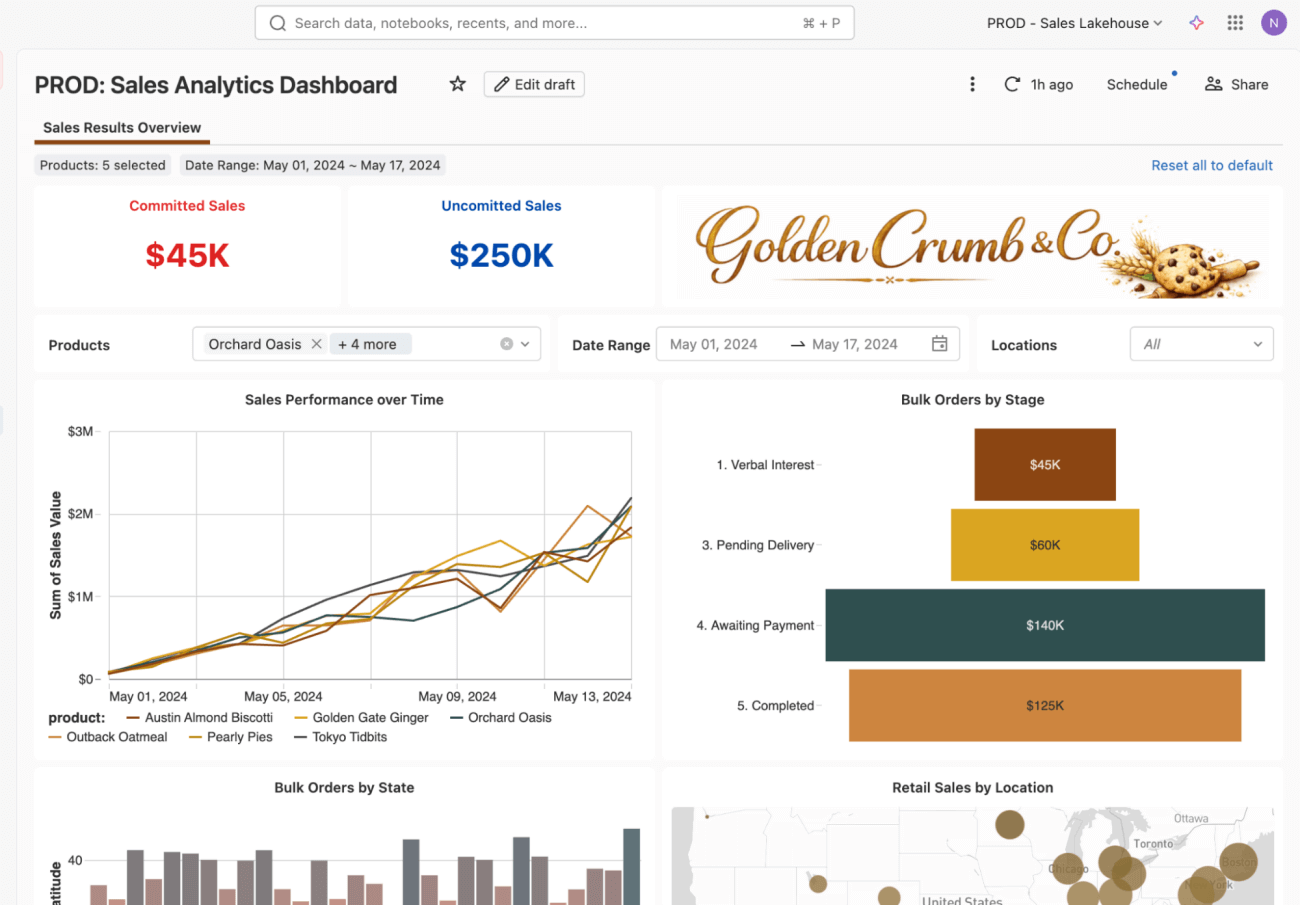
Now you can make the changes to the dashboard! In this case, you’ll modify the sales number in the upper left to add both uncommitted and committed sales counters (bold blue and red chosen for visibility).
You’ll note that nothing about the authoring experience changes - make these changes as you normally would using the dashboard UI editor.
Once the dashboard looks correct in development, you’re ready to process to get the changes to production. Use the same Git button at the top as before to check these changes in with a short commit message.
Step 3: Review the change
Next, you unlock another key benefit of this workflow: a place for others to review changes and offer feedback before the change reaches production. Needing a second person’s review is a general best practice, but just as importantly it creates a low-stakes space to discuss ideas, validate assumptions, and refine the change before it impacts reporting.
To start the review, create a Pull Request (PR) in your Git provider, which is basically a review page for the dashboard update. The reviewer can see exactly what changed, leave comments for you to address, and approve the update once everything looks right.
During the review, the production dashboard remains unchanged. Only after feedback is addressed and the change is approved does it move forward.
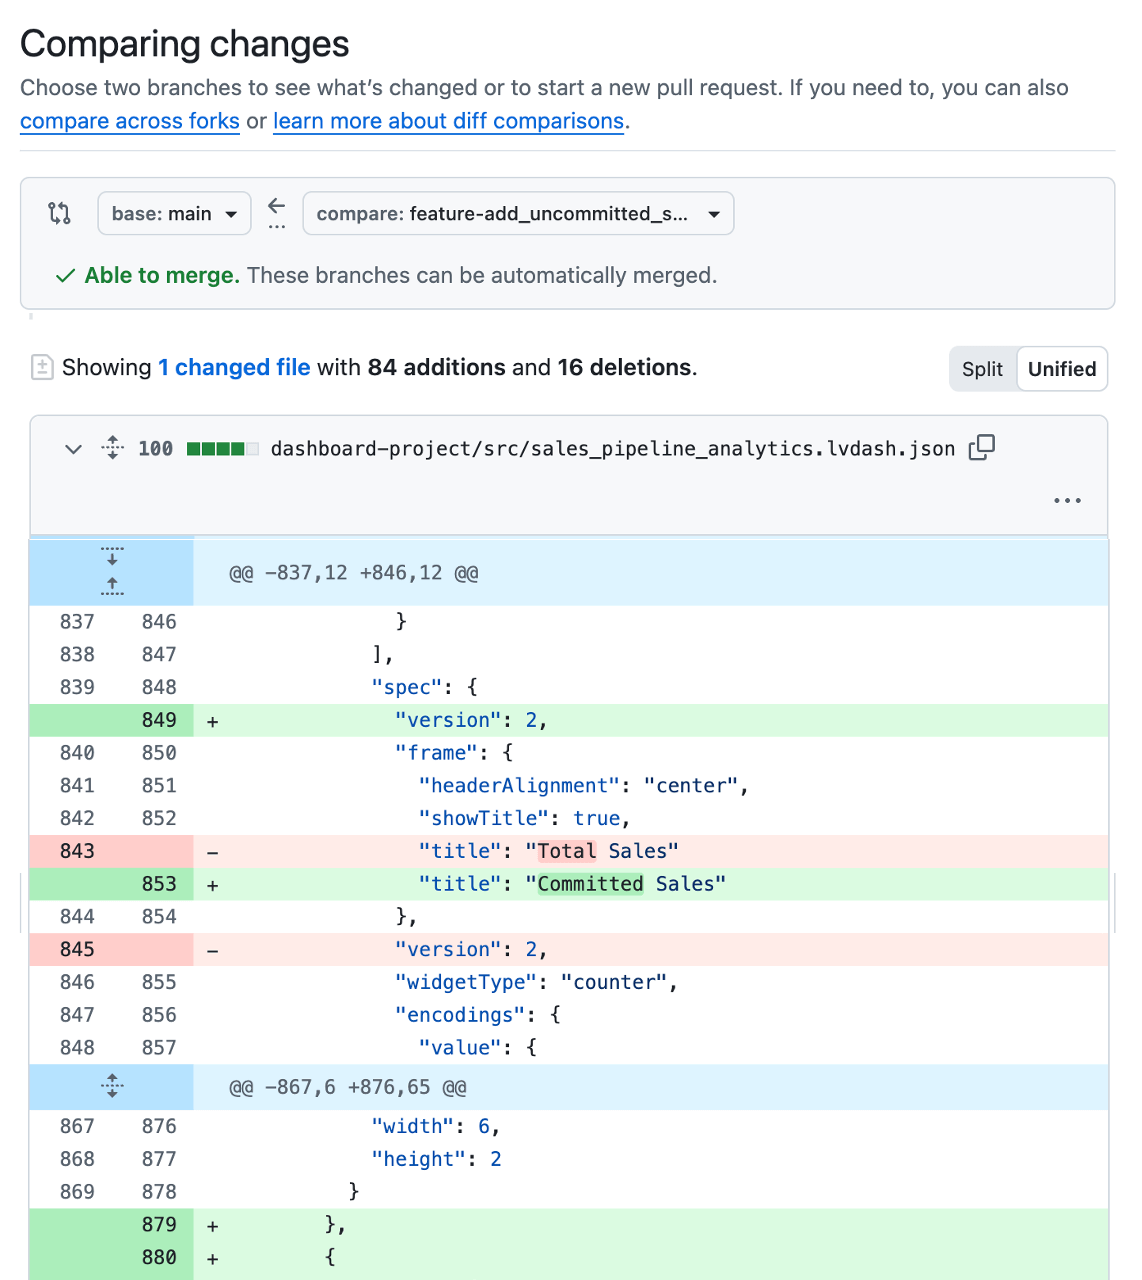
While dashboard changes are stored and tracked as configuration files behind the scenes, it’s often hard understanding what’s actually changed. Because of this, most teams use a small automation to automatically deploy a temporary test version of the dashboard for review whenever a PR is opened. That way, reviewers can see the proposed metrics, calculations, and layouts in context before anything reaches production, and catch data logic or UI issues. Having the developer or reviewer include screenshots or links to the test dashboard directly in the PR also makes feedback faster and more confident.
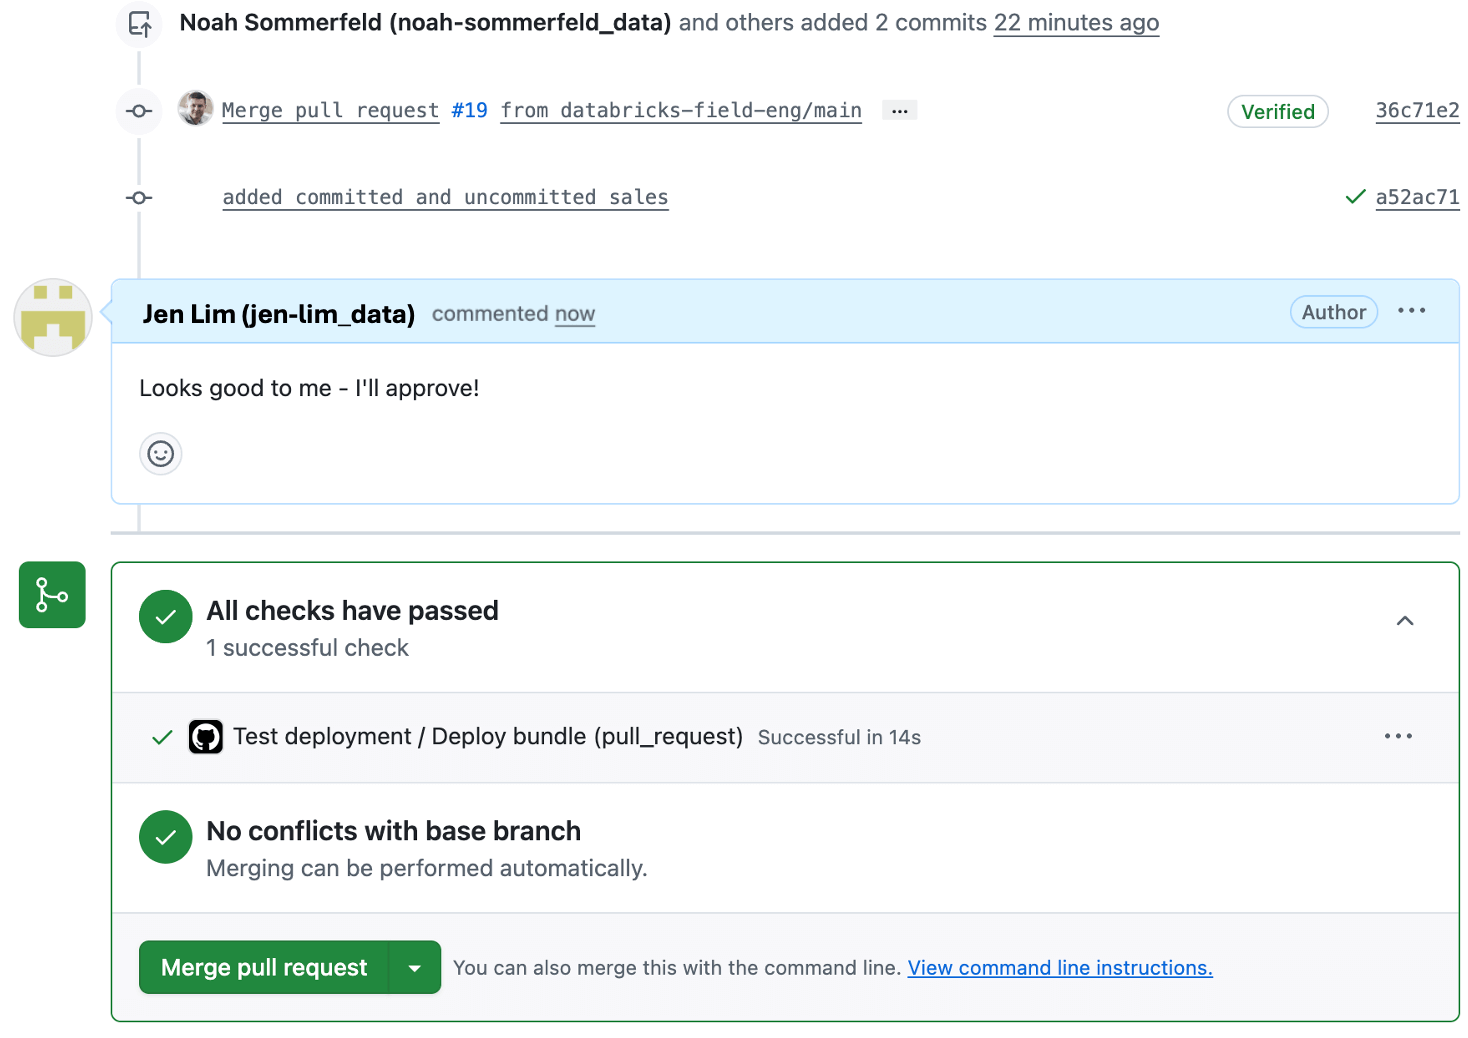
Reviewers can add comments and approve, which are recorded so the change is easier to understand later.
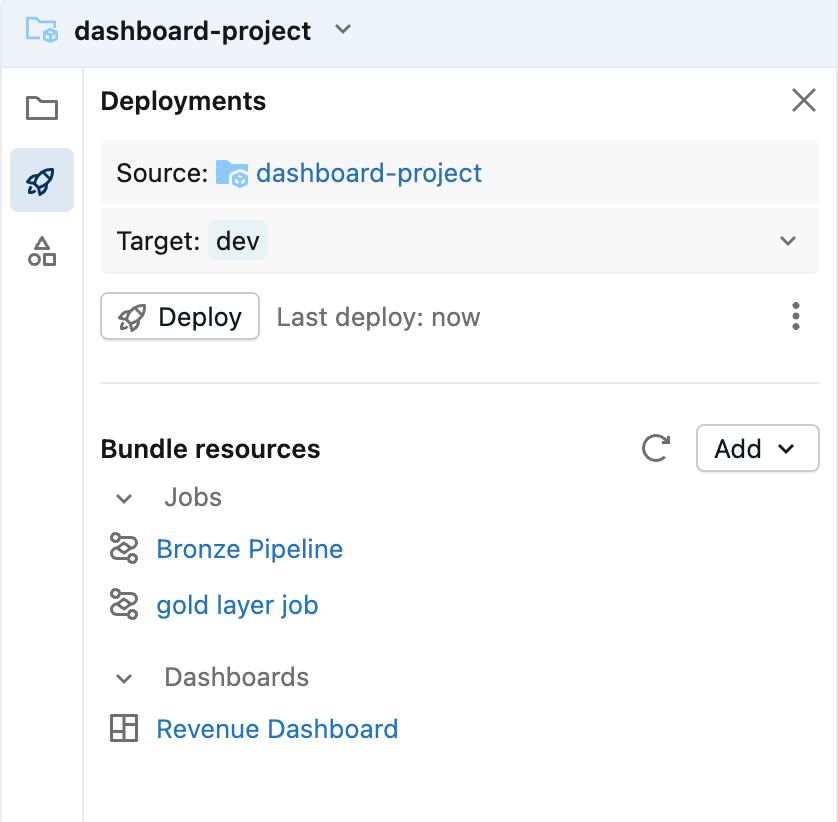
Step 4: Deploy the dashboard to production using the bundle
With the change approved, you’re ready to deploy the dashboard to production.
Dashboards often need different settings in production than in development - for example, pointing to a production catalog or schema instead of a development dataset, or using a different SQL warehouse.
The good news is that these differences are expected and handled as part of the deployment process.
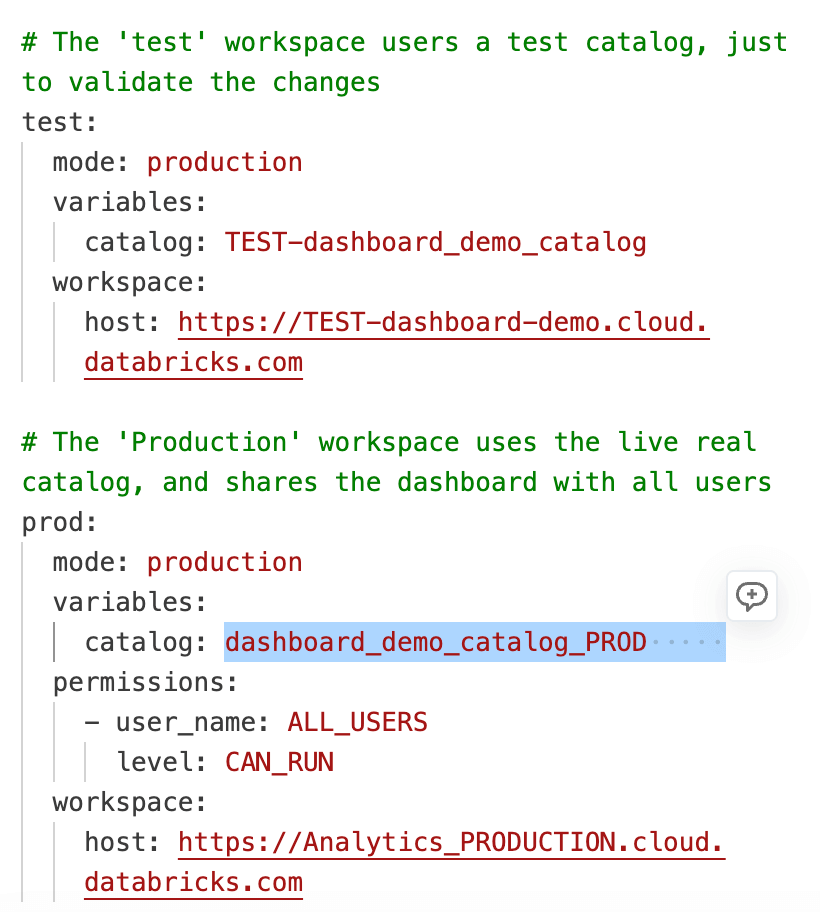
When you added the dashboard to the Asset Bundle, Databricks generated a small .yml configuration file that captures these environment-specific settings. This file lets you override values by environment without changing the dashboard logic itself. In our case, we’ve specified that the catalog the dashboard uses in production should be different than in test, by using a ${variable} value for catalog name.
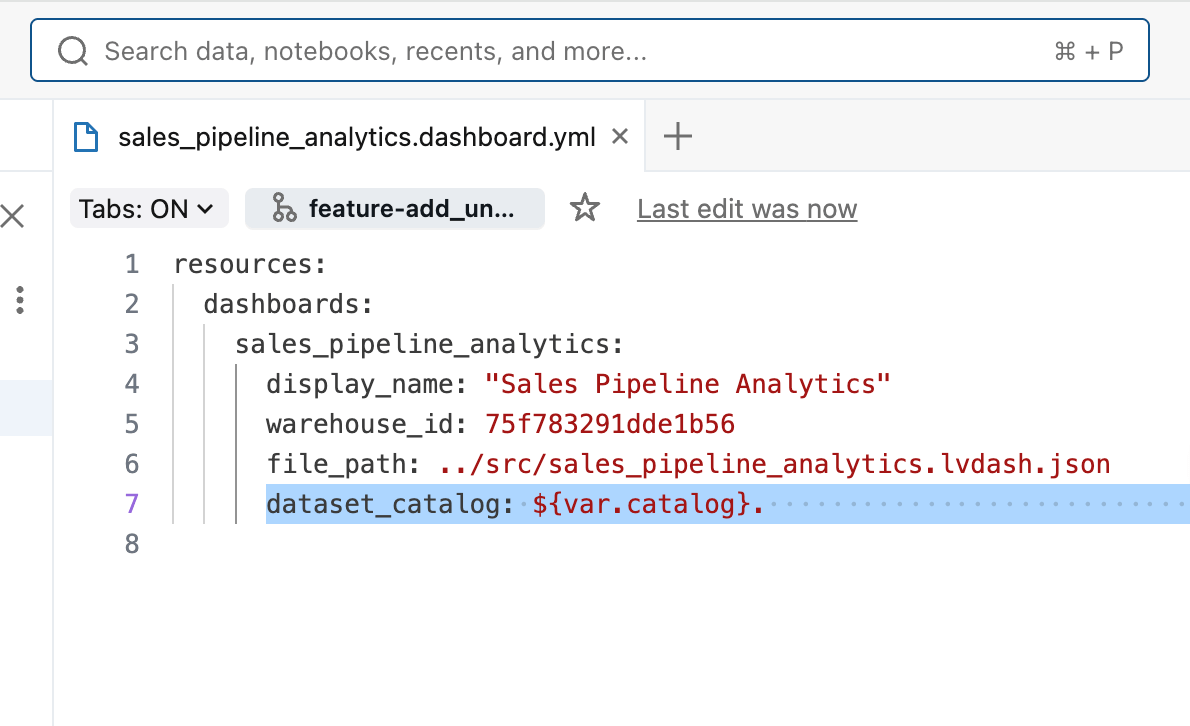
Finally, the databricks.yml file ties all bundle resources together and defines which catalog is used in each environment, making it easy to manage consistent deployments across development, test, and production workspaces.
Once the Pull Request is approved and merged into the main branch, your deployment automation runs and uses the environment-specific values defined in databricks.yml. The same dashboard code is reused across workspaces, while settings such as catalog, schema, and warehouse are applied based on the target environment. This removes the need to maintain separate dashboard copies for each workspace and ensures changes behave predictably everywhere.
For most Git providers, you’ll be able to see the deployment automation on the pull request so you can monitor the deployment and confirm when it completes (or if it encounters an issue). If a problem occurs, the deployment stops without affecting the existing production dashboard to let you troubleshoot. Once the deployment finishes successfully, the updated dashboard is live in production and ready for stakeholders!
Bonus 1: What if you want to inspect the history?
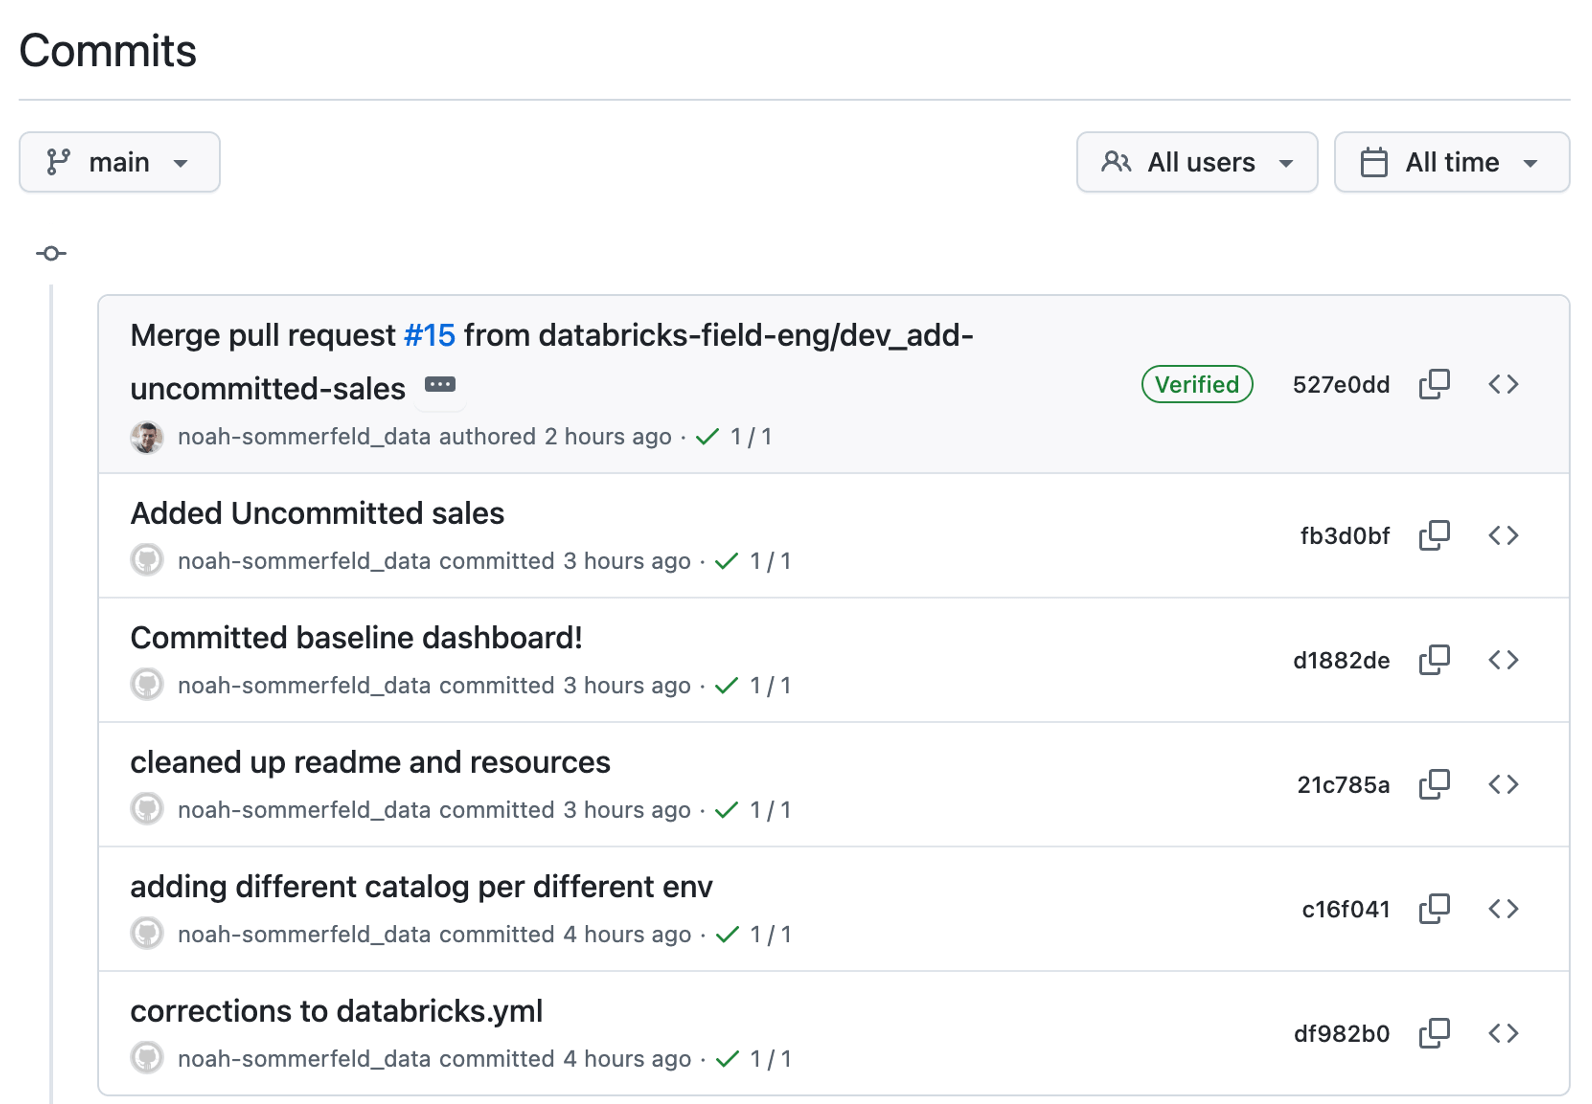
Once the dashboard update is live, you may need to understand the history of what, when and why changed. One bonus of this flow is that the change is now traceable. Instead of a one-off edit made directly in a workspace, it appears as a sequence of saved versions.
Each entry represents a dashboard update, along with the author and timestamp. You can open any entry to review the changes, and roll it back if necessary.
Bonus 2: What if you need to revert a change?
Even with careful review and testing, issues can still surface—such as a dashboard that fails to load or a metric definition that turns out to be incorrect.
Because the dashboard is managed through this workflow, you can roll back to a known-good version using the same controlled process used to deploy the update.
Start by opening the dashboard’s change history in the repository and locating the update you want to undo. From there, you can review what was modified to confirm you’re reverting the correct change before proceeding.
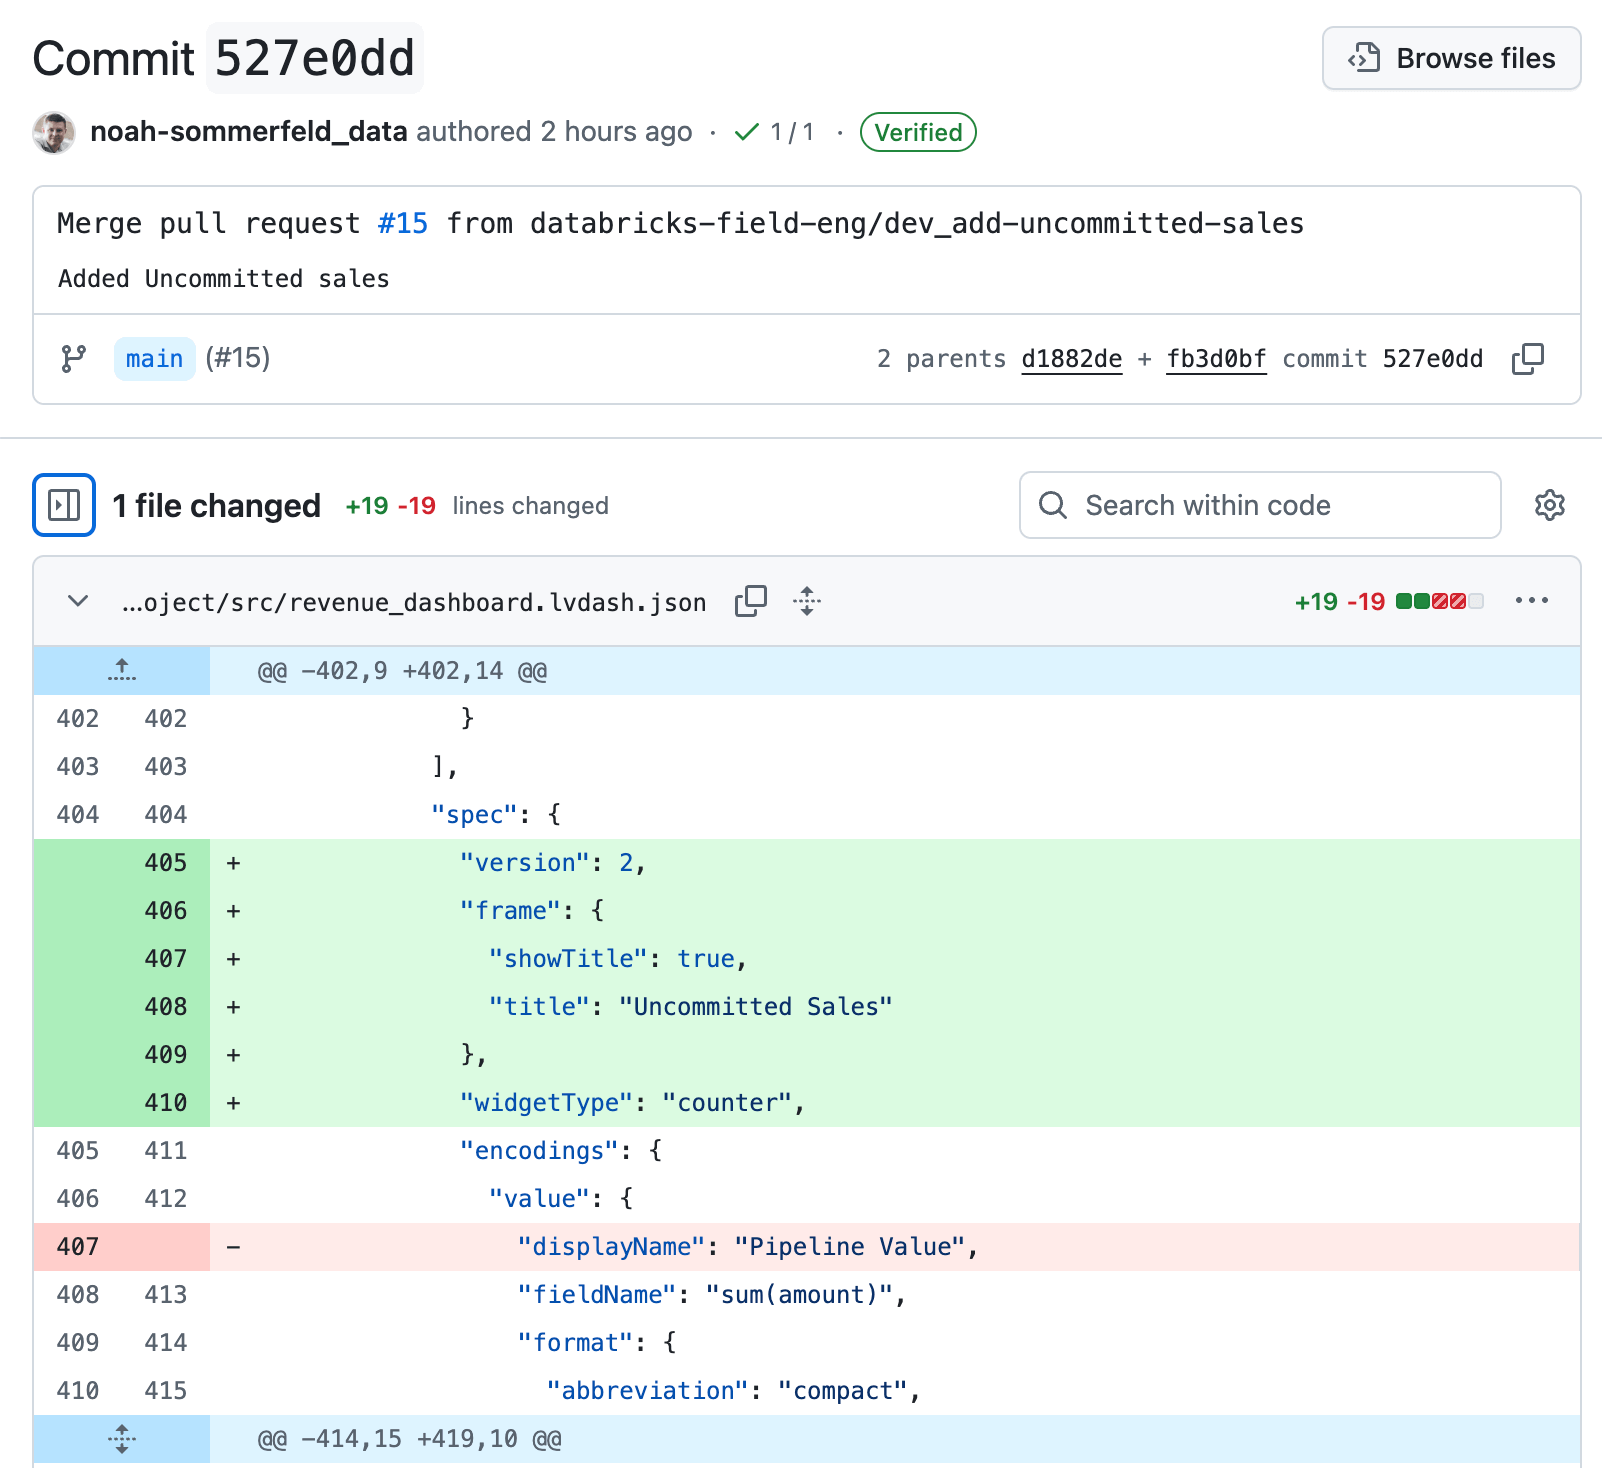
From the change details, follow the link back to the review page. To roll back the update, select Revert. This creates a new “undo” change that reverses only that specific update, restoring the dashboard to its previous logic while keeping the rest of the dashboard history intact.
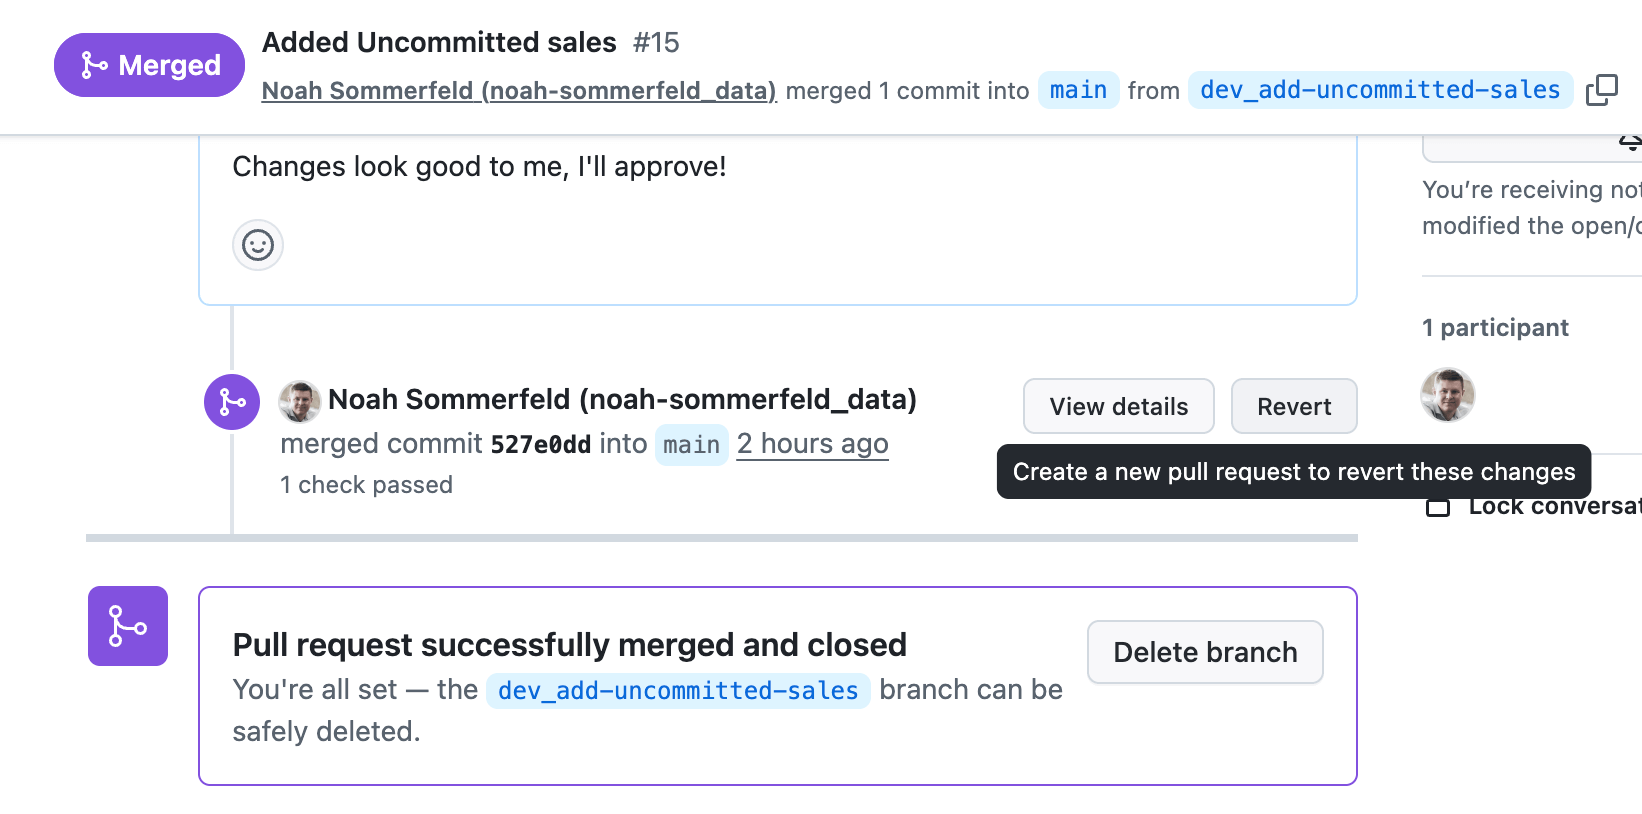
Once the change is merged into the main branch, the same automation that deployed the dashboard to production will roll it back. This means you can respond to an outage or high-impact calculation issue in minutes, without bypassing the controls you already have in place.
Bonus 3: What if your data sources have an update?
Most dashboards are closely linked to their data sources, which means that updates to a dashboard are often closely linked to updates in the pipelines. The good news is that Asset Bundles are designed to group related components together into one package.
This ensures that an upstream data model change never catches you by surprise, and when visualization changes require data model updates, you can roll out both changes in one deployment.
Conclusion
Treating AI/BI dashboards as production-grade data products is essential for reliable business decisions and risk mitigation. In this workflow, a small set of additional steps makes dashboard changes visible, reviewable, and reversible—without changing how you build dashboards day to day.
By managing dashboards with Git and Databricks Asset Bundles, teams establish a routine, predictable workflow for updates: make the change, review it, test it, and deploy it. The same process applies whether the update is a small visual adjustment or a meaningful change to business logic.
With the right deployment discipline in place, dashboard changes stop being a source of risk, and a trusted source of insights that evolves with the business even in high-stakes situations like a board meeting.
Learn more + Next Steps
If you’re inspired and want to go deeper on the pieces used in this workflow, here’s a few resources that are a good place to continue:
- ‘Branching Strategy’ (AWS | Azure | GCP)
Learn how changes are merged and deployed using a branching model that follows best practices. - Databricks Asset Bundles (AWS | Azure | GCP)
Learn how Asset Bundles are used to package and deploy Databricks resources consistently across environments. - CI/CD for automated deployment on Databricks (AWS | Azure | GCP)
Learn how to get implement CI/CD with starter Github Actions scripts (AWS | Azure | GCP) - Using Asset Bundles from the Databricks Workspace UI (AWS | Azure | GCP)
Learn how to create, edit, and deploy bundles directly from the workspace. - Git-backed folders in Databricks (AWS | Azure | GCP)
Learn how Git integration works in Databricks and how version control fits into day-to-day analytics workflows.
If you are ready to take the next step with Databricks AI/BI, you can choose any of the following options:
- Free Edition and Trial: Get hands-on experience by signing up for our free edition or trial.
- Documentation: Dive deeper into the details with our documentation.
- Webpage: Visit our webpage to learn more.
- Demos: Watch our demo videos, take product tours and get hands-on tutorials to see these AI/BI in action.
- Training: Get started with free product training through Databricks Academy.
Get the latest posts in your inbox
Subscribe to our blog and get the latest posts delivered to your inbox.