How Databricks System Tables Help Data Engineers Achieve Advanced Observability
System Tables provide the breadth and depth data engineers need to simply track the health of their data pipelines at scale for more cost-effective and reliable workloads.
- Learn how System Tables expose platform telemetry as queryable tables, including metadata and execution insights for Lakeflow jobs and pipelines.
- Use example queries to turn this telemetry into insights on reliability, cost and efficiency opportunities at scale for Lakeflow jobs.
- Centralize these insights into a shared, day-to-day operational view for data engineering teams with the Lakeflow dashboard template.
The 3 AM Problem
It is 3 AM and something broke. The dashboard is stale, an SLA slipped, and everyone is guessing which part of the platform drifted out of line. Maybe a job spent hours running without a timeout. Maybe a pipeline updated a table no one has read in months. Maybe a cluster is still on an old runtime. Maybe the only person who knows the job’s owner is on vacation.
These are the patterns that wear data teams down: wasted compute from unused pipelines, reliability gaps from missing health rules, hygiene issues from aging runtimes, and delays caused by unclear ownership. They show up quietly, grow slowly, and then suddenly become the thing that keeps the on-call engineer awake.
Databricks System Tables provide a consistent layer to spot these issues early by exposing job metadata, task timelines, execution behavior, configuration history, lineage, cost signals, and ownership in one place.
With the newly launched System Tables for Lakeflow Jobs, you now have access to expanded schemas that deliver richer execution details and metadata signals and enable more advanced observability.
Deeper and centralized visibility into all your data made easy with System Tables
What are System Tables?
Databricks System Tables are a set of read-only, Databricks-managed tables in the system catalog that provide operational and observability data for your account. They come out of the box and cover a wide range of data, including jobs, pipelines, clusters, billing, lineage, and more.
Category | What It Tracks |
Lakeflow Jobs | Job configs, task definitions, run timelines |
Lakeflow Spark Declarative Pipelines | Pipeline metadata, update history |
Billing | Usage, cost attribution by workload |
Lineage | Table-level read/write dependencies |
Clusters | Compute configs, utilization |
Why System Tables matter for observability
System Tables support cross-workspace analysis within a region, enabling data engineering teams to easily analyze any workload behavior and operational patterns at scale from a single, queryable interface. Using these tables, data practitioners can centrally monitor the health of all their pipelines, surface cost-saving opportunities, and quickly identify failures for better reliability.
Some System Tables use SCD Type 2 semantics, preserving full change history by inserting a new row for each update. This enables configuration auditing and historical analysis of platform state over time.
Lakeflow System Tables
Lakeflow System Tables hold data for the last 365 days and consist of the following tables.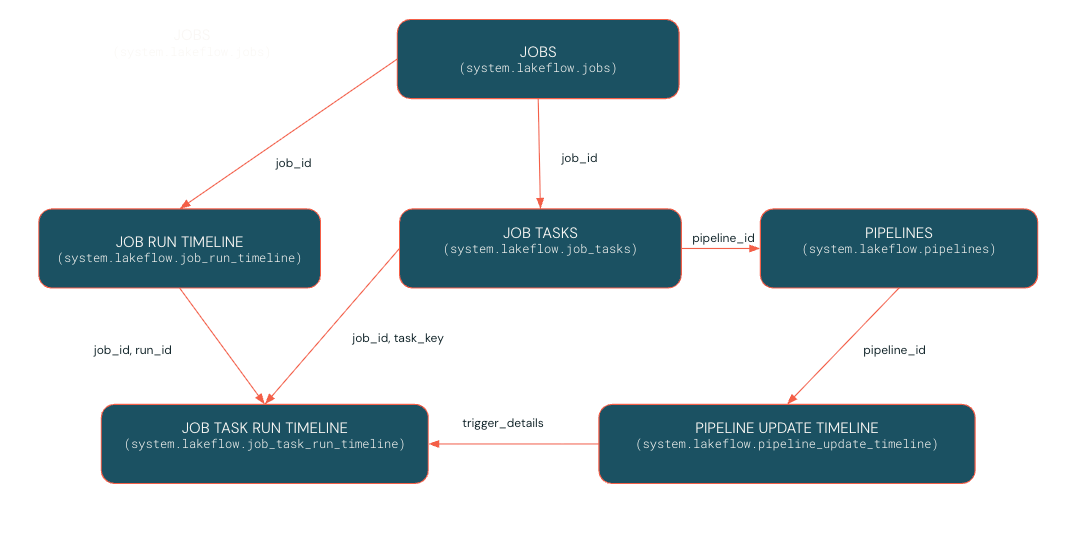
For a complete list of System Tables and their relationships, refer to the documentation.
Jobs observability tables (Generally Available)
system.lakeflow.jobs– SCD2 metadata for jobs, including configuration and tags. Useful for inventory, governance, and configuration drift analysis.system.lakeflow.job_tasks– SCD2 table describing all job tasks, their definitions, and dependencies. Useful for understanding task structures at scale.system.lakeflow.job_run_timeline– Immutable timeline of job runs with status, compute, and timing. Ideal for SLA and performance trend analysis.system.lakeflow.job_task_run_timeline– Timeline of individual task runs within each job. Helps pinpoint bottlenecks and task-level issues.
Pipeline observability tables (Public Preview)
system.lakeflow.pipelines– SCD2 metadata table for SDP pipelines, enabling cross-workspace pipeline visibility and change tracking.system.lakeflow.pipeline_update_timeline– Immutable execution logs for pipeline updates, supporting historical debugging and optimization.
Lakeflow System Tables have seen rapid growth in popularity, with tens of millions of queries being run every single day, marking a 17x year-over-year increase. This surge underscores the value that data engineers derive from Lakeflow System Tables, which have become a crucial component of day-to-day observability for many Databricks Lakeflow customers.
Let’s look at use cases now made possible by the recently expanded and now generally available Jobs System Tables.
System Tables in Real Life: Operational Health for Lakeflow Jobs
As a data engineer on a central platform team, you’re responsible for managing hundreds of jobs across multiple teams. Your goal is to keep the data platform cost-efficient, reliable, and performant, while ensuring teams follow governance and operational best practices.
To do this, you set out to audit your Lakeflow jobs and pipelines across four core objectives:
- Optimize Costs: Identify scheduled jobs updating datasets that are never used downstream.
- Ensure Reliability: Enforce timeouts and runtime thresholds to prevent runaway jobs and SLA breaches.
- Maintain Hygiene: Verify consistent runtime versions and configuration standards.
- Assign Accountability: Identify job owners to streamline follow-ups and remediation.
Pattern 1: Find Jobs producing unused data
The problem: Scheduled jobs run faithfully, updating tables that no downstream consumer ever reads. These are often the easiest cost savings, if you can find them.
The approach: Join Lakeflow Jobs tables with lineage and billing tables to identify producers without consumers, ranked by cost.
What to do next: Review the top offenders with their owners. Some may be safe to pause immediately. Others may need a deprecation plan if external systems depend on them outside Databricks.
Pattern 2: Find Jobs without Timeouts or Duration Thresholds
The problem: Jobs without timeouts can run indefinitely. A stuck task burns compute for hours, or even days, before anyone notices. Besides increasing costs, this can also cause SLA violations, so you need to spot overruns early and take action before deadlines or downstream processes are affected.
The approach: Query current job configs for missing timeout and duration threshold settings.
What to do next: Cross-reference with historical runtimes from job_run_timeline to set realistic thresholds. A job that typically runs 20 minutes might warrant a 1-hour timeout and 30 minute duration threshold. A job that varies widely may need investigation first.
Pattern 3: Detect legacy runtime versions
The problem: Deprecated runtimes miss security patches, performance improvements, and are subject to upcoming EOL deadlines. But with hundreds of jobs, tracking who's still on old versions is tedious.
The approach: Query job task configs for runtime versions and flag anything below your threshold.
What to do next: Prioritize upgrades based on EOL timelines. Share this list with job owners and track progress in follow-up queries.
Pattern 4 : Identify Job owners for remediation
The problem: When a job fails or is not configured correctly, you need to know who to contact to fix the problem.
The approach: Query system tables to easily identify job owners for each action that has to be taken.
What to do next: Reach out to the job owners to assign ownership for issues that require an action to be taken.
Together, these patterns help you optimize costs, keep data fresh, enforce reliability guardrails, and assign clear ownership for remediation. They form the foundation for operational observability.
Bringing it Together: Operationalizing Insights with Dashboards
Running these queries ad-hoc is useful. But for day-to-day operations, you want a shared view your whole team can reference.
The Lakeflow dashboard gives me a bird's-eye view of jobs across all my workspaces - not just at the cost level, but also for pipeline hygiene and operations: tracking spend, identifying stale pipelines, monitoring failures, and spotting optimization opportunities - Zoe Van Noppen, Data Solution Architect, Cubigo
To get started, import the dashboard into your workspace. For step-by-step instructions, refer to the official documentation.
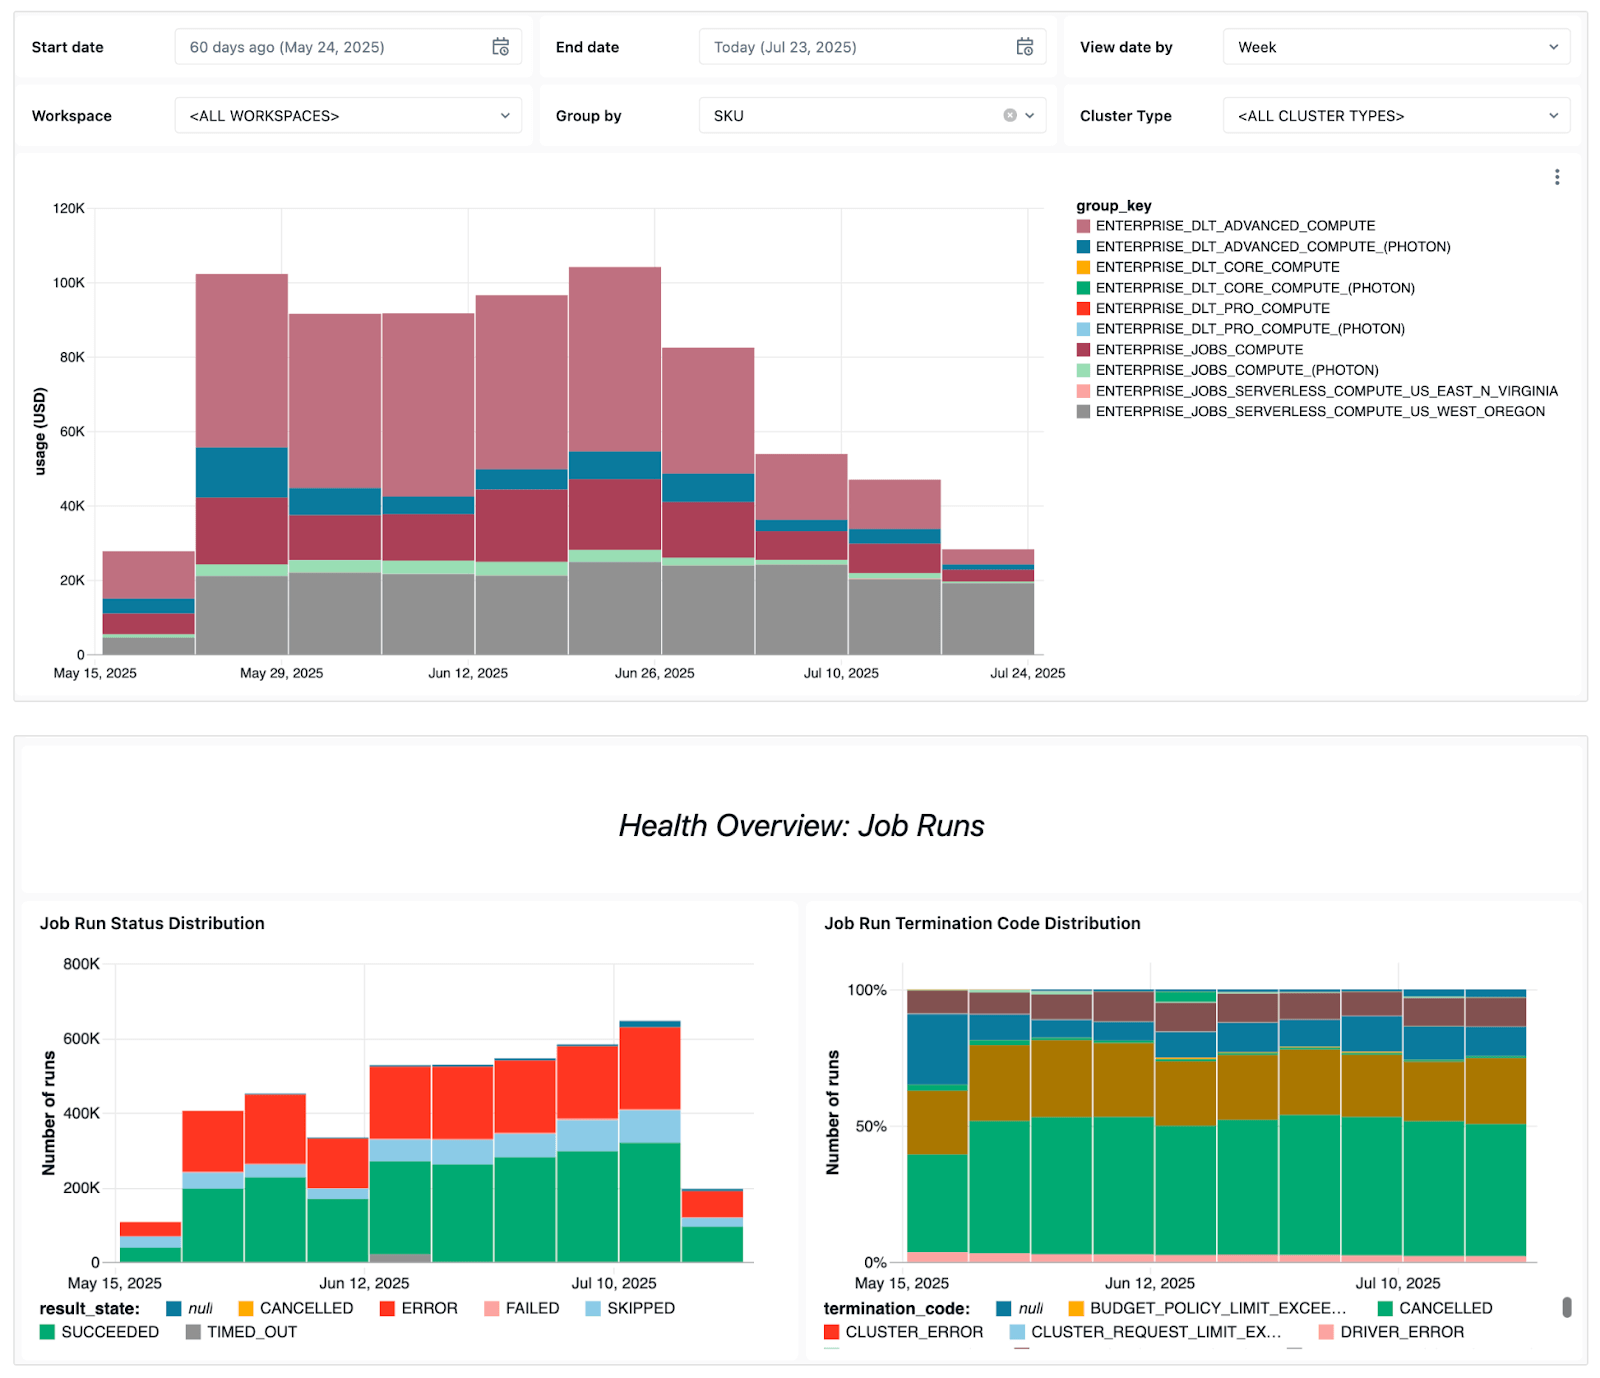
The dashboard surfaces several key operational signals, including:
- Failure trends - to let you see which jobs fail most often, overall error trends, and common error messages.
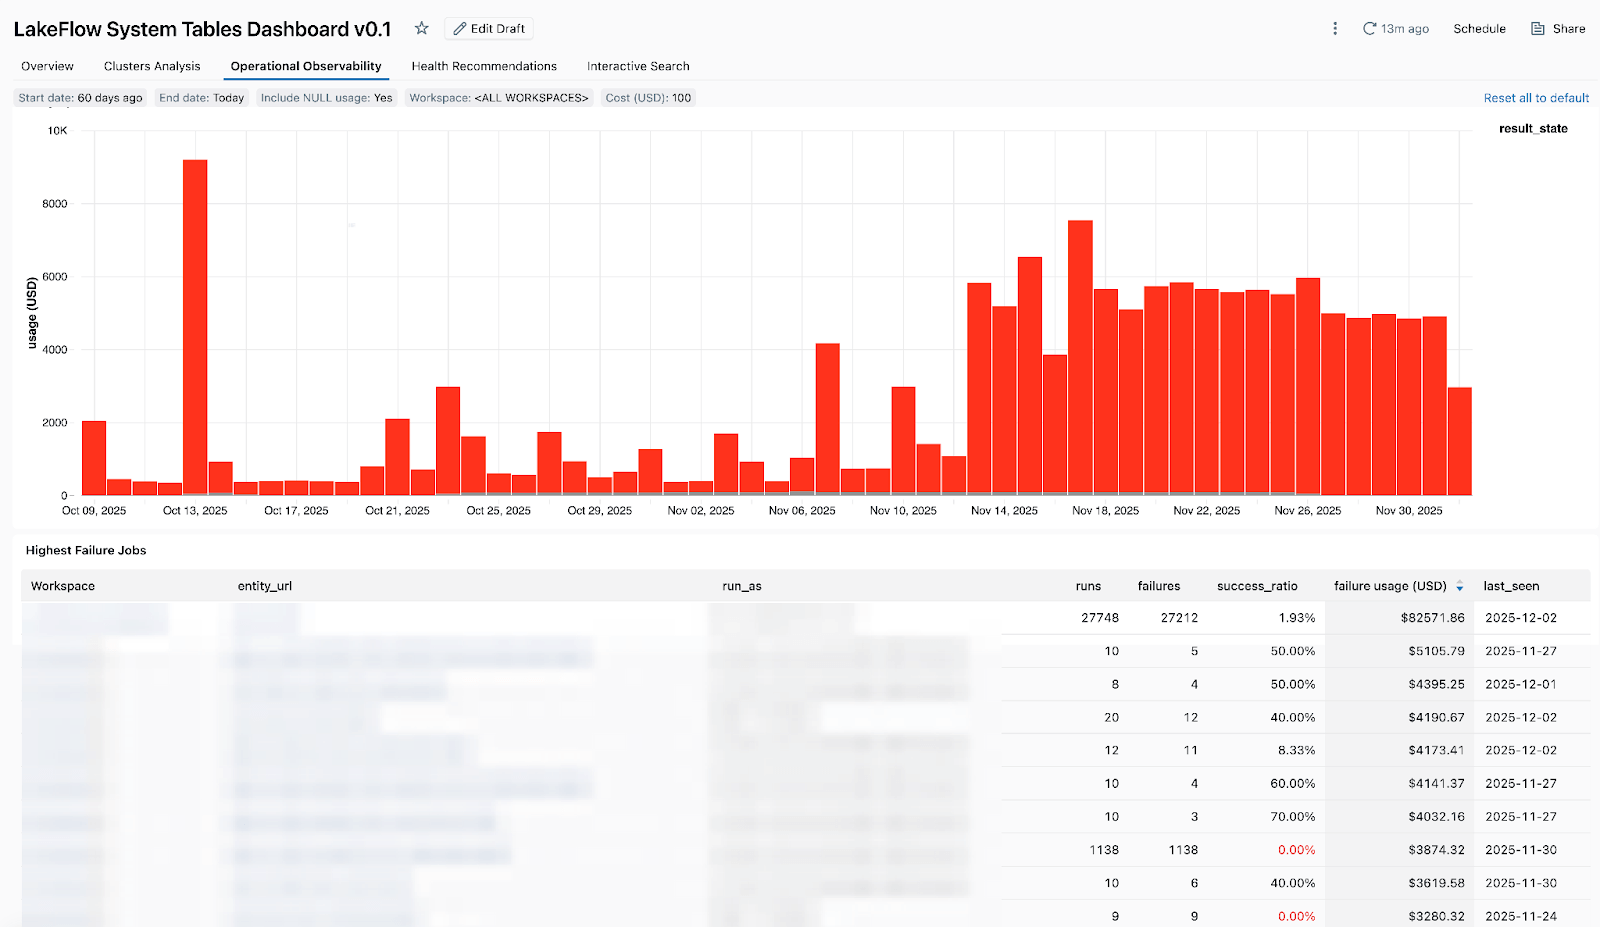
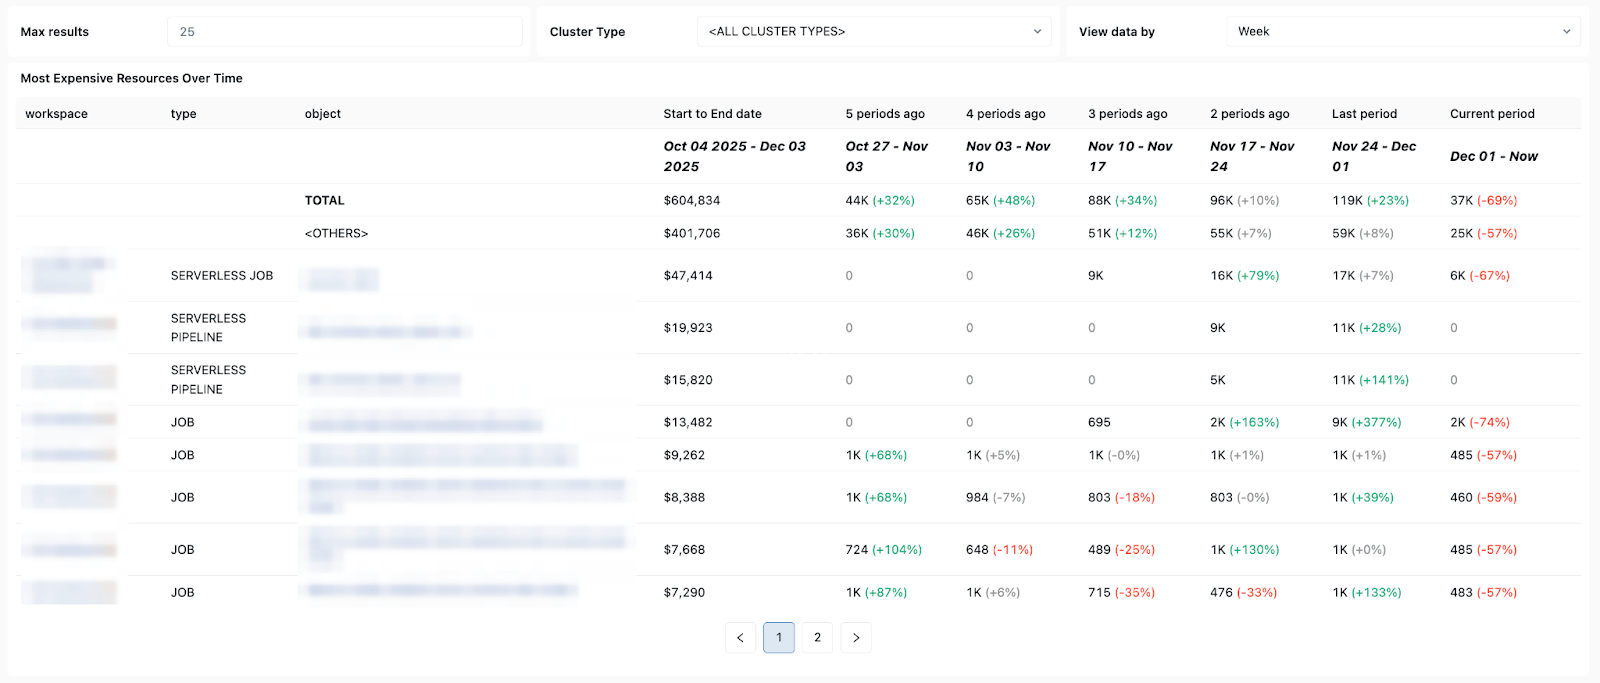
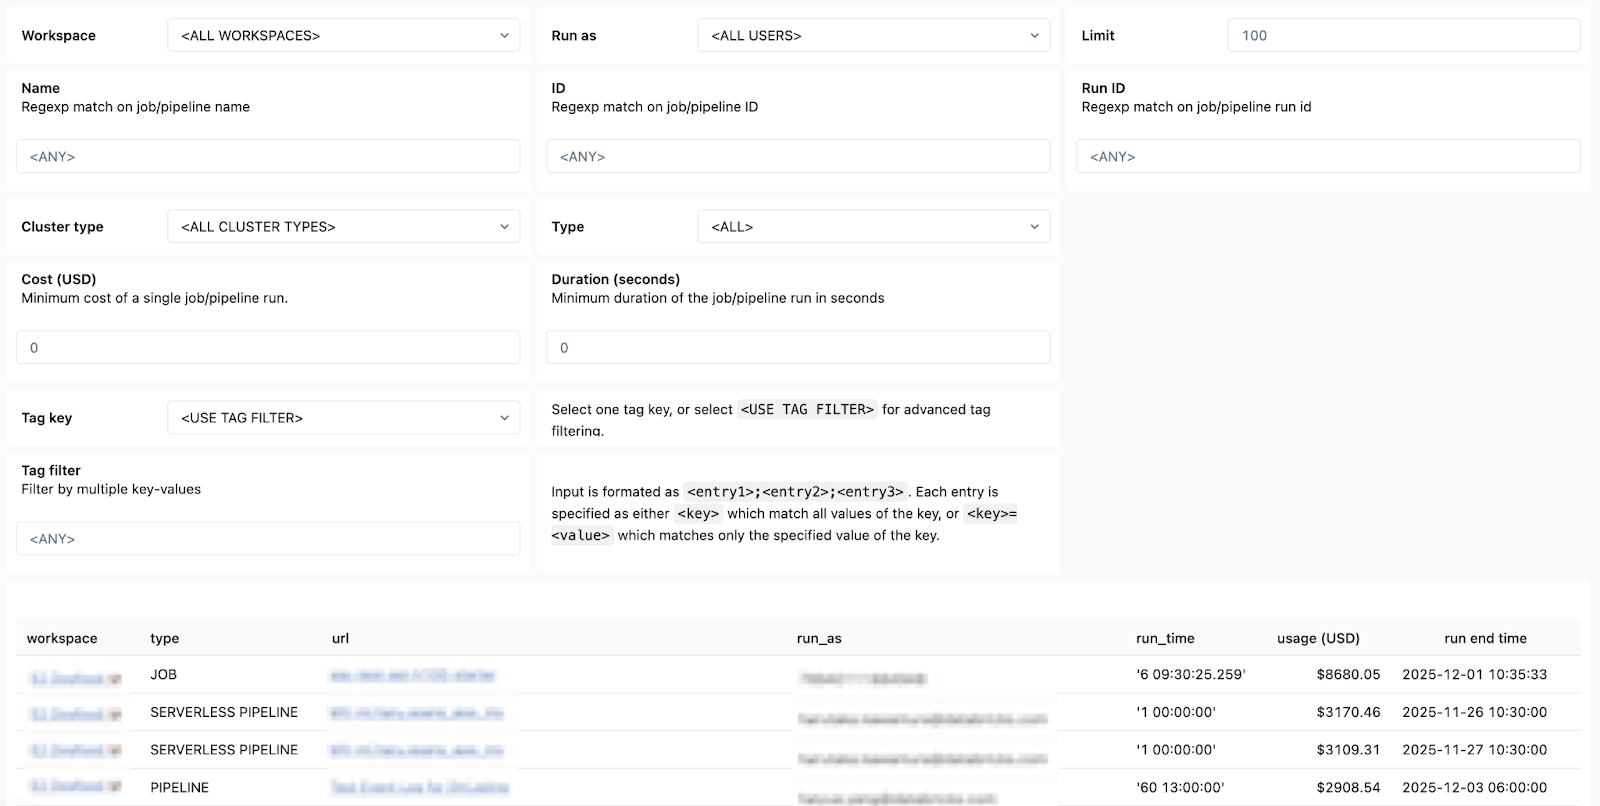
- High-cost jobs - so you can identify the most expensive jobs and individual job runs over the last 30 days or over time. The table below is sorted by the highest-cost jobs over the selected period and shows their cost trends over time.
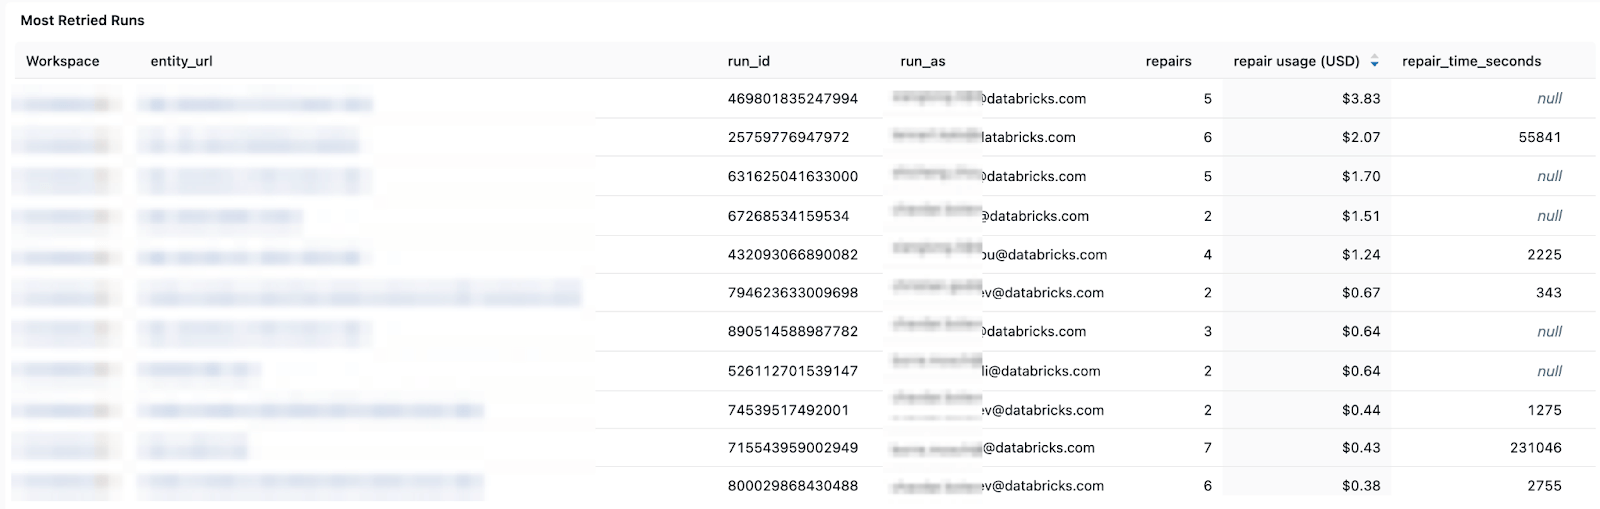
Cost and retry patterns - helping you track cost trends and the impact of retries or repair runs on total spend.
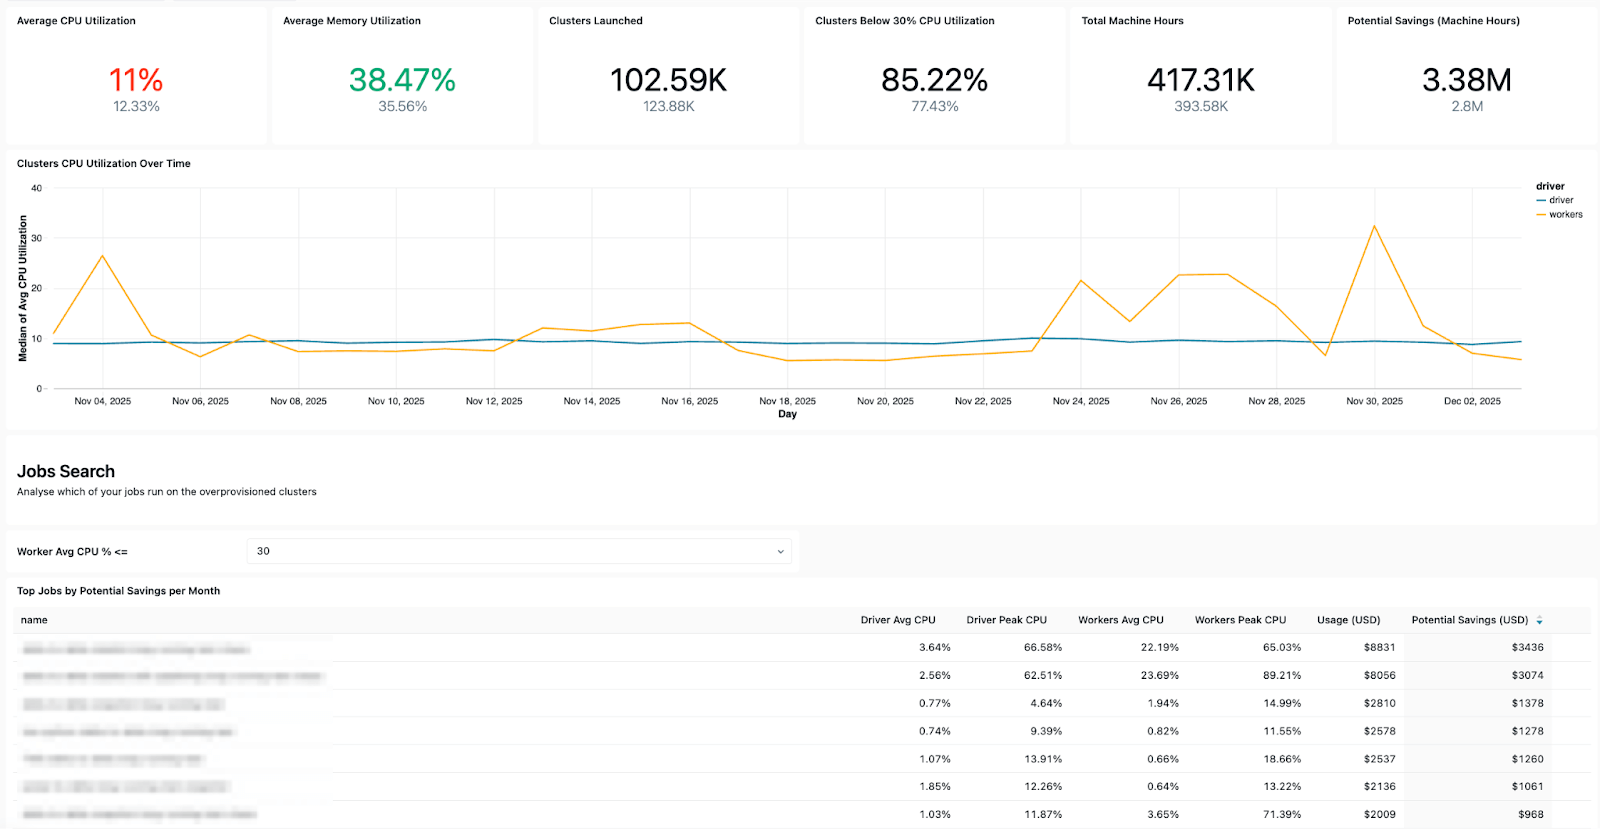
- Configuration insights - allowing you to check cluster efficiency, health rules, timeouts, and runtime versions for operational hygiene.
- Ownership details - so you can easily find the “run-as” users and job creators to know who to reach out to.
In short, Databricks System Tables makes it easy to monitor, audit, and troubleshoot Lakeflow jobs efficiently at scale and across workspaces. With clear, simple, and accessible visuals of your jobs and pipelines available in the Dashboard template, every data engineer using Lakeflow can achieve advanced observability and consistently ensure production-ready, cost-effective, and reliable pipelines.
System Tables turn your platform telemetry into a queryable asset. Instead of stitching together signals from five different tools, you write SQL against a unified schema and get answers in seconds.
Your 3 AM self will thank you.
To learn more about System Tables, check out the following resources:
New with Databricks? Try Databricks for free today!
Get the latest posts in your inbox
Subscribe to our blog and get the latest posts delivered to your inbox.