Never Miss a Beat: Announcing New Monitoring and Alerting capabilities in Databricks Workflows
Efficient Workflow Management with Databricks' Latest Monitoring Tools
by Roland Fäustlin and Frank Wisniewski
We are excited to announce enhanced monitoring and observability features in Databricks Workflows. This includes a new real-time insights dashboard to see all your production job runs in one place, advanced and detailed task tracking for every workflow, and new alerting capabilities to help you catch issues before problems arise. The goal of these great new features is to simplify your daily operations by allowing you to see holistically across all your production workflows while optimizing productivity for data practitioners of every skill level.
Recently we have put a ton of investment into Databricks Workflows making it an easy-to-use, reliable, and fully managed orchestration solution for your data, analytics and ML workloads, that is fully integrated with the Databricks Lakehouse Platform. It has an intuitive UI making it simple for all data practitioners and a powerful API that allows data engineers and developers to author and maintain workflows in their favorite IDE with full support for CI/CD. It also has a history of 99.95% uptime and a proven track record running tens of thousands of production workloads for our customers every single day. Read below to learn more about these exciting new observability features that we are proud to launch.
Job Runs: Monitor All Your Jobs in Real Time
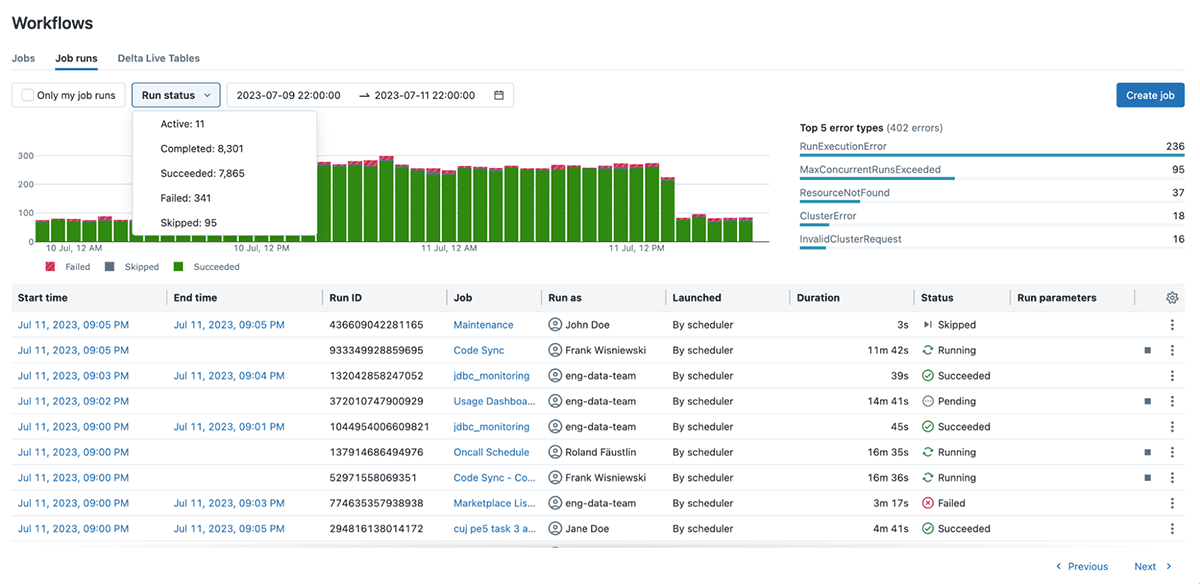
Keeping track of production workloads is challenging, especially when you're dealing with hundreds or thousands of workflows all running at once, so to answer the question "How is everything running in production?", we built the new Job Runs dashboard. This dashboard gives you an aggregated overview of all your jobs in real-time - including the start time, duration, status, and other relevant information.
You can also see job run trends to understand if things are improving or getting worse. Using an interactive slider you can zoom into any specific period for a more granular view of time, and filter by various run types including active, completed, successful, skipped, and failed runs. We also provide a summary of the top error types you are experiencing across all your workloads for improved troubleshooting.
The new Job Runs dashboard means you can check workflow health at a glance and see just the right set of metrics to diagnose issues before they arise. With this improved visibility, you can quickly determine if your workflows are performing as expected, take proactive measures, and minimize the negative impact on business operations downstream.
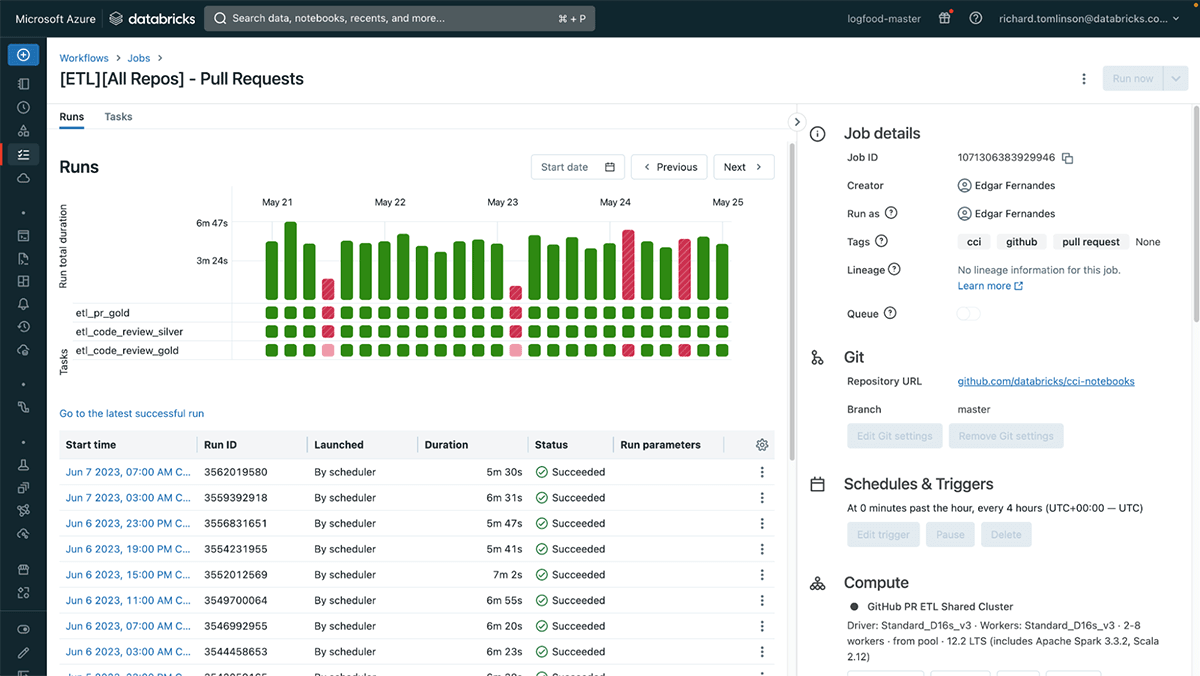
Matrix View: Diagnose Task Health Across Runs
Did you ever wonder why a particular job is failing? Understanding the behavior of each job and all of its tasks is key for evaluating health and debugging underlying issues. That's why we added the new "job matrix view". This view allows you to assess the overall job run duration and quickly see the health of each task within. If a particular job is failing or delayed, it shows you which tasks are problematic enabling you to fix the workflow with minimal or no disruption to downtime. You can also easily see trends in the duration of every task within each job run to see how things vary over time.
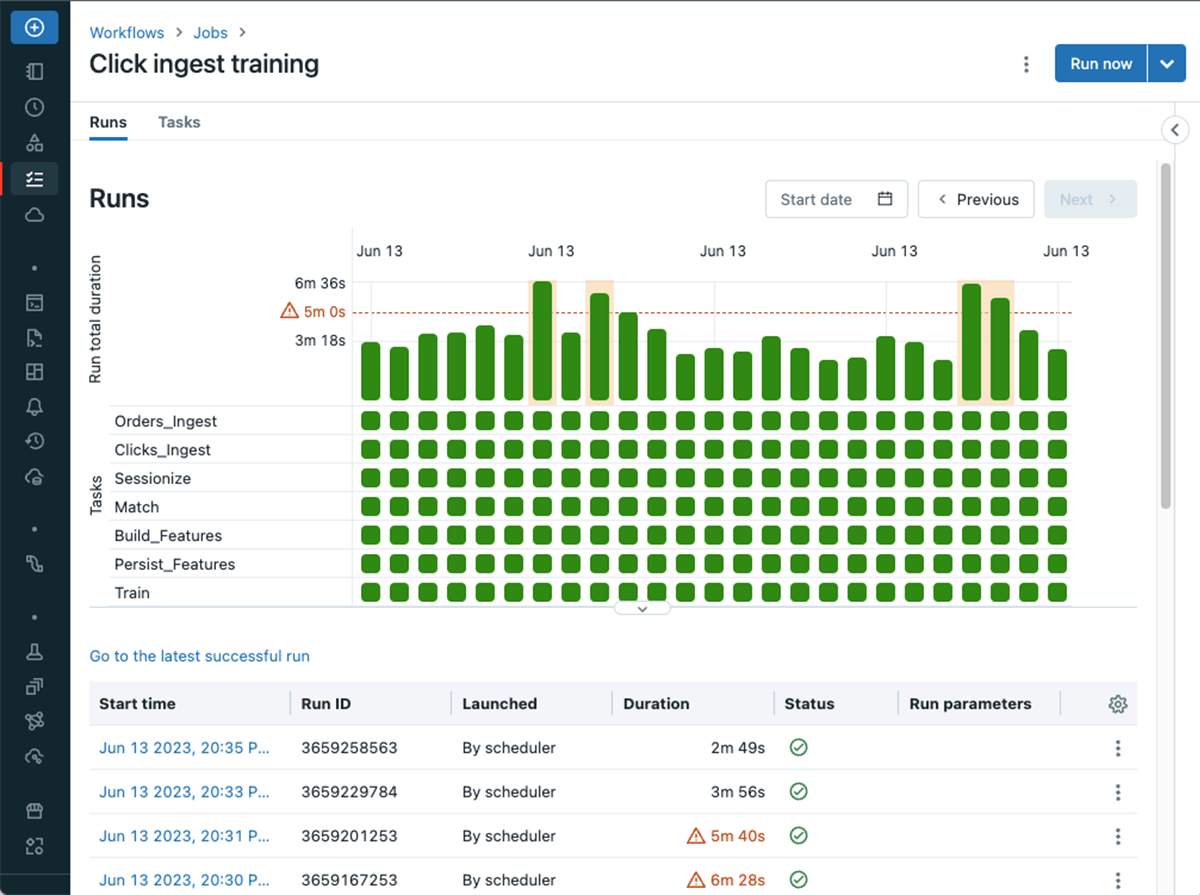
Duration warning: Alert on overdue jobs and ensure data freshness
Have you ever been contacted by a business user – or a customer– asking why their dashboard or report is not fully up to date only to realize that an ETL job is running longer than expected? To help you get on top of these unwanted situations, we've introduced a new type of warning for your jobs and tasks allowing you toset a duration threshold, to receive timely alerts when a run exceeds that threshold.
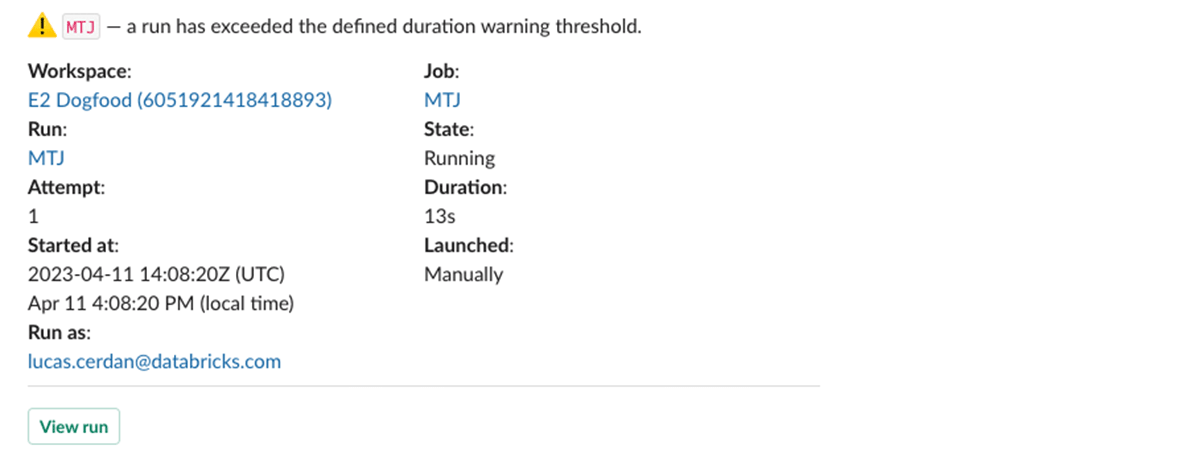
The new time limit feature in Databricks Workflows catches long-running or stuck jobs early. The timely intervention helps maintain data integrity and meet business objectives.
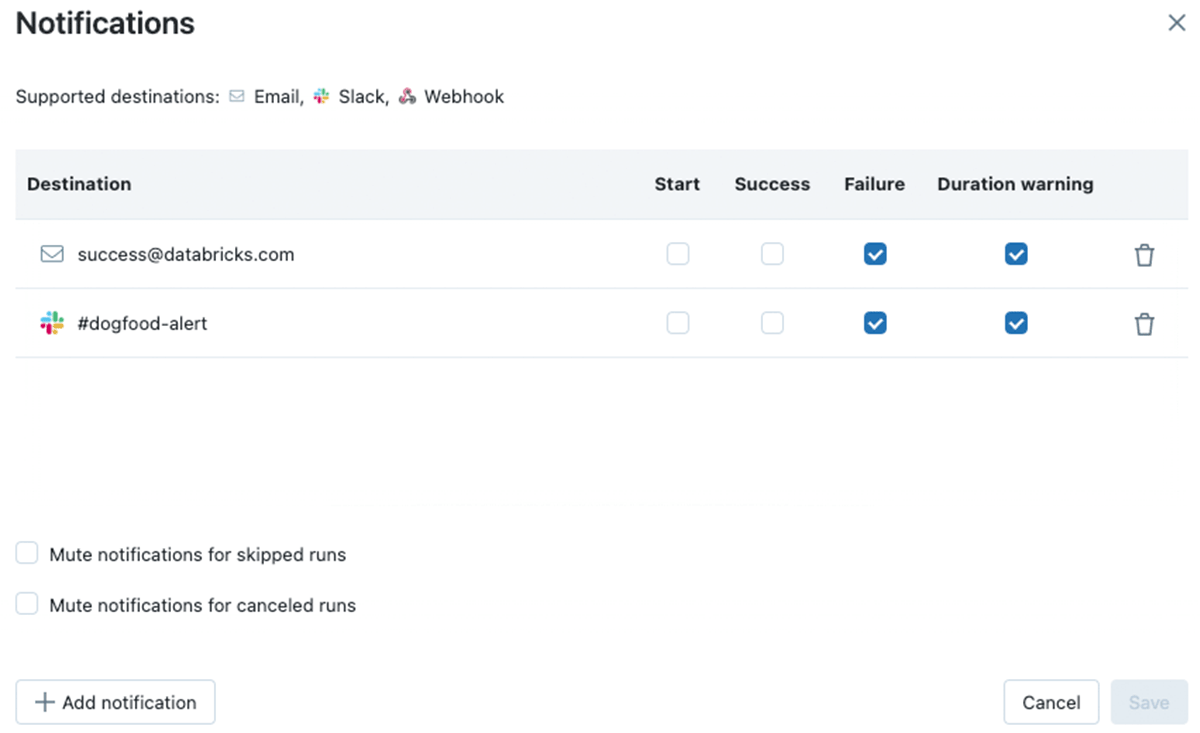
Fine grained notification control
With these new types of alerts and warnings, we've also ensured you get more control over which users and groups should be alerted at which stage of the job. For each recipient you are now able to define which events they should be alerted on. This means you can create more complex escalation paths to support your business processes. For example, you may want to alert the data set owners and its consumers if the job runs longer than expected, but only page the support team when it fails.
How to get started?
To get started with Databricks Workflows, see the quickstart guide. You can try these capabilities across Azure, AWS & GCP by simply clicking on the Workflows tab today.
What's Next
We will continue to expand on improving monitoring, alerting and managing capabilities. We are working on new ways to find the jobs you care about by improving searching & tagging capabilities. We'd also love to hear from you about your experience and any other features you'd like to see.
Get the latest posts in your inbox
Subscribe to our blog and get the latest posts delivered to your inbox.