Getting the Full Picture: Unifying Databricks and Cloud Infrastructure Costs
Learn how to automate unified cost dashboards that FinOps and Platform teams actually want to use.
by Steven Muschler, Daniel Martinez Arevalo and Sadhana Bala
- The new Cloud Infra Cost Field Solution (available for AWS and Azure) demonstrates how to ingest, enrich, join and visualize Databricks and related cloud cost data to view total costs at the account, cluster and even tag-level.
- Implementing the Field Solution gives FinOps and Platform teams a single, trusted TCO view, allowing them to drill into full costs by workspace, workload, and business unit to align usage with budgets, eliminating manual reconciliation and turning cost reporting into an always-on, operational capability.
- Companies like General Motors have adopted this approach to develop a holistic understanding of their Databricks costs, ensuring they are visible and well understood.
Understanding TCO on Databricks
Understanding the value of your AI and data investments is crucial—yet over 52% of enterprises fail to measure Return on Investment (ROI) rigorously [Futurum]. Complete ROI visibility requires connecting platform usage and cloud infrastructure into a clear financial picture. Often, the data is available but fragmented, as today’s data platforms must support a growing range of storage and compute architectures.
On Databricks, customers are managing multicloud, multi-workload and multi-team environments. In these environments, having a consistent, comprehensive view of cost is essential for making informed decisions.
At the core of cost visibility on platforms like Databricks is the concept of Total Cost of Ownership (TCO).
On multicloud data platforms, like Databricks, TCO consists of two core components:
- Platform costs, such as compute and managed storage, are costs incurred through direct usage of Databricks products.
- Cloud infrastructure costs, such as virtual machines, storage, and networking charges, are costs incurred through the underlying usage of cloud services needed to support Databricks.
Understanding TCO is simplified when using serverless products. Because compute is managed by Databricks, the cloud infrastructure costs are bundled into the Databricks costs, giving you centralized cost visibility directly in Databricks system tables (though storage costs will still be with the cloud provider).
Understanding TCO for classic compute products, however, is more complex. Here, customers manage compute directly with the cloud provider, meaning both Databricks platform costs and cloud infrastructure costs need to be reconciled. In these cases, there are two distinct data sources to be resolved:
- System tables (AWS | AZURE | GCP) in Databricks will provide operational workload-level metadata and Databricks usage.
- Cost reports from the cloud provider will detail costs on cloud infrastructure, including discounts.
Together, these sources form the full TCO view. As your environment grows across many clusters, jobs, and cloud accounts, understanding these datasets becomes a critical part of cost observability and financial governance.
The Complexity of TCO
The complexity of measuring your Databricks TCO is compounded by the disparate ways cloud providers expose and report cost data. Understanding how to join these datasets with system tables to produce accurate cost KPIs requires deep knowledge of cloud billing mechanics–knowledge many Databricks-focused platform admins may not have. Here, we deep dive on measuring your TCO for Azure Databricks and Databricks on AWS.
Azure Databricks: Leveraging First-Party Billing Data
Because Azure Databricks is a first-party service within the Microsoft Azure ecosystem, Databricks-related charges appear directly in Azure Cost Management alongside other Azure services, even including Databricks-specific tags. Databricks costs appear in the Azure Cost analysis UI and as Cost management data.
However, Azure Cost Management data will not contain the deeper workload-level metadata and performance metrics found in Databricks system tables. Thus, many organizations seek to bring Azure billing exports into Databricks.
Yet, to fully join these two data sources is time-consuming and requires deep domain knowledge–an effort that most customers simply don't have time to define, maintain and replicate. Several challenges contribute to this:
- Infrastructure must be set up for automated cost exports to ADLS, which can then be referenced and queried directly in Databricks.
- Azure cost data is aggregated and refreshed daily, unlike system tables, which are on the order of hours – data must be carefully deduplicated and timestamps matched.
- Joining the two sources requires parsing high-cardinality Azure tag data and identifying the right join key (e.g., ClusterId).
Databricks on AWS: Aligning Marketplace and Infrastructure Costs
On AWS, while Databricks costs do appear in the Cost and Usage Report (CUR) and in AWS Cost Explorer, costs are represented at a more aggregated, SKU-level, unlike Azure. Moreover, Databricks costs appear only in CUR when Databricks is purchased through the AWS Marketplace; otherwise, CUR will reflect only AWS infrastructure costs.
In this case, understanding how to co-analyze AWS CUR alongside system tables is even more critical for customers with AWS environments. This allows teams to analyze infrastructure spend, DBU usage and discounts together with cluster-and workload-level context, creating a more complete TCO view across AWS accounts and regions.
Yet, joining AWS CUR with system tables can also be challenging. Common pain points include:
- Infrastructure must support recurring CUR reprocessing, since AWS refreshes and replaces cost data multiple times per day (with no primary key) for the current month and any prior billing period with changes.
- AWS cost data spans multiple line item types and cost fields, requiring attention to select the correct effective cost per usage type (On-Demand, Savings Plan, Reserved Instances) before aggregation.
- Joining CUR with Databricks metadata requires careful attribution, as cardinality can be different, e.g., shared all-purpose clusters are represented as a single AWS usage row but can map to multiple jobs in system tables.
Simplifying Databricks TCO calculations
In production-scale Databricks environments, cost questions quickly move beyond overall spend. Teams want to understand cost in context—how infrastructure and platform usage connect to real workloads and decisions. Common questions include:
- How does the total cost of a serverless job benchmark against a classic job?
- Which clusters, jobs, and warehouses are the biggest consumers of cloud-managed VMs?
- How do cost trends change as workloads scale, shift, or consolidate?
Answering these questions requires bringing together financial data from cloud providers with operational metadata from Databricks. Yet as described above, teams need to maintain bespoke pipelines and a detailed knowledge base of cloud and Databricks billing to accomplish this.
To support this need, Databricks is introducing the Cloud Infra Cost Field Solution —an open source solution that automates ingestion and unified analysis of cloud infrastructure and Databricks usage data, inside the Databricks Platform.
By providing a unified foundation for TCO analysis across Databricks serverless and classic compute environments, the Field Solution helps organizations gain clearer cost visibility and understand architectural trade-offs. Engineering teams can track cloud spend and discounts, while finance teams can identify the business context and ownership of top cost drivers.
In the next section, we’ll walk through how the solution works and how to get started.
Technical Solution Breakdown
Although the components may have different names, the Cloud Infra Cost Field Solution for both Azure and AWS customers share the same principles, and can be broken down into the following components:
- Export cost and usage data to cloud storage
- Ingest and model data in Databricks using Lakeflow Spark Declarative Pipelines
- Visualize full TCO (Databricks and related cloud provider costs) with AI/BI Dashboards
Both the AWS and Azure Field Solutions are excellent for organizations that operate within a single cloud, but they can also be combined for multicloud Databricks customers using Delta Sharing.
Azure Databricks Field Solution
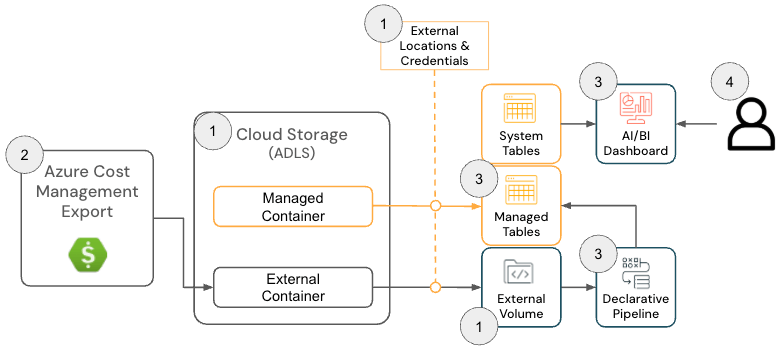
The Cloud Infra Cost Field Solution for Azure Databricks consists of the following architecture components:
Azure Databricks Solution Architecture
To deploy this solution, admins must have the following permissions across Azure and Databricks:
- Azure
- Permissions to create an Azure Cost Export
- Permissions to create the following resources within a Resource Group:
- Databricks
- Permission to create the following resources:
- Storage Credential
- External Location
- Permission to create the following resources:
The GitHub repository provides more detailed setup instructions; however, at a high level, the solution for Azure Databricks has the following steps:
- [Terraform] Deploy Terraform to configure dependent components, including a Storage Account, External Location and Volume
- The purpose of this step is to configure a location where the Azure Billing data is exported so it can be read by Databricks. This step is optional if there is a preexisting Volume since the Azure Cost Management Export location can be configured in the next step.
[Azure] Configure Azure Cost Management Export to export Azure Billing data to the Storage Account and confirm data is successfully exporting
- The purpose of this step is to use the Azure Cost Management’s Export functionality to make the Azure Billing data available in an easy-to-consume format (e.g., Parquet).
Storage Account with Azure Cost Management Export Configured
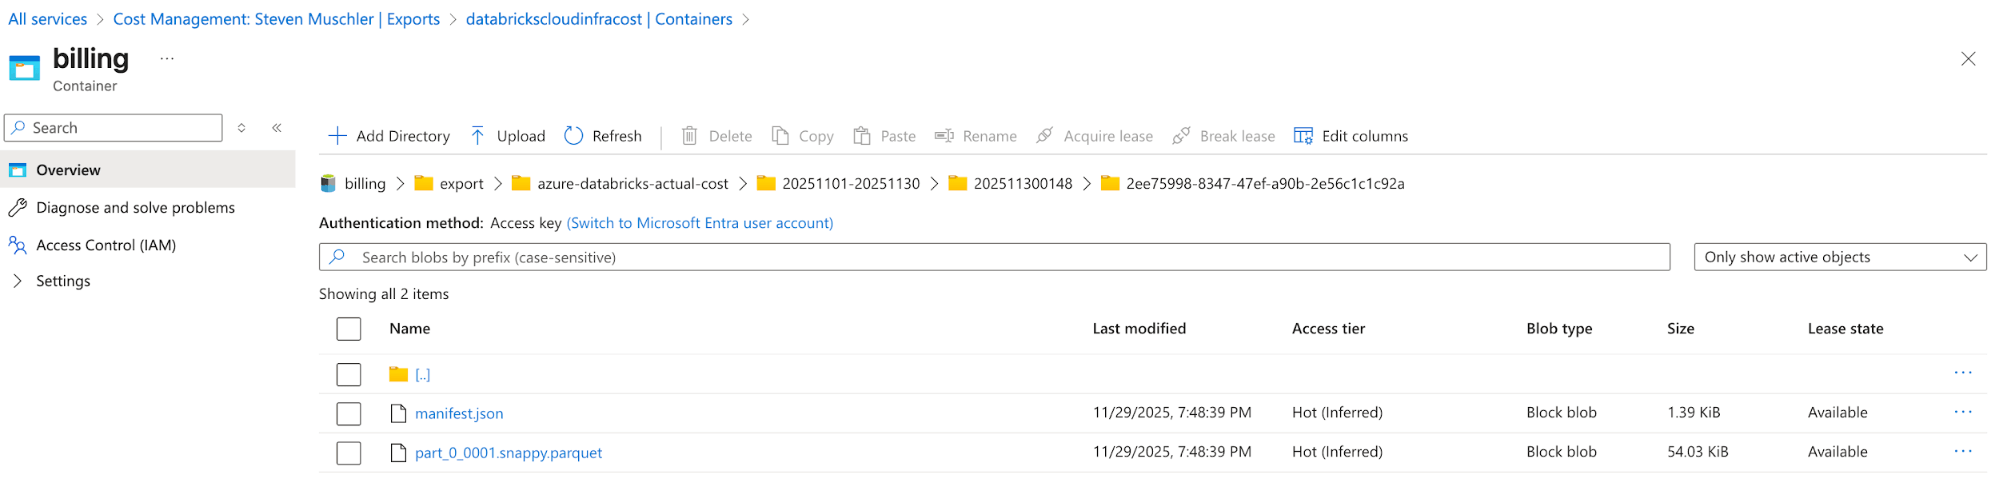
Azure Cost Management Export automatically delivers cost files to this location - [Databricks] Databricks Asset Bundle (DAB) Configuration to deploy a Lakeflow Job, Spark Declarative Pipeline and AI/BI Dashboard
- The purpose of this step is to ingest and model Azure billing data for visualization using an AI/BI dashboard.
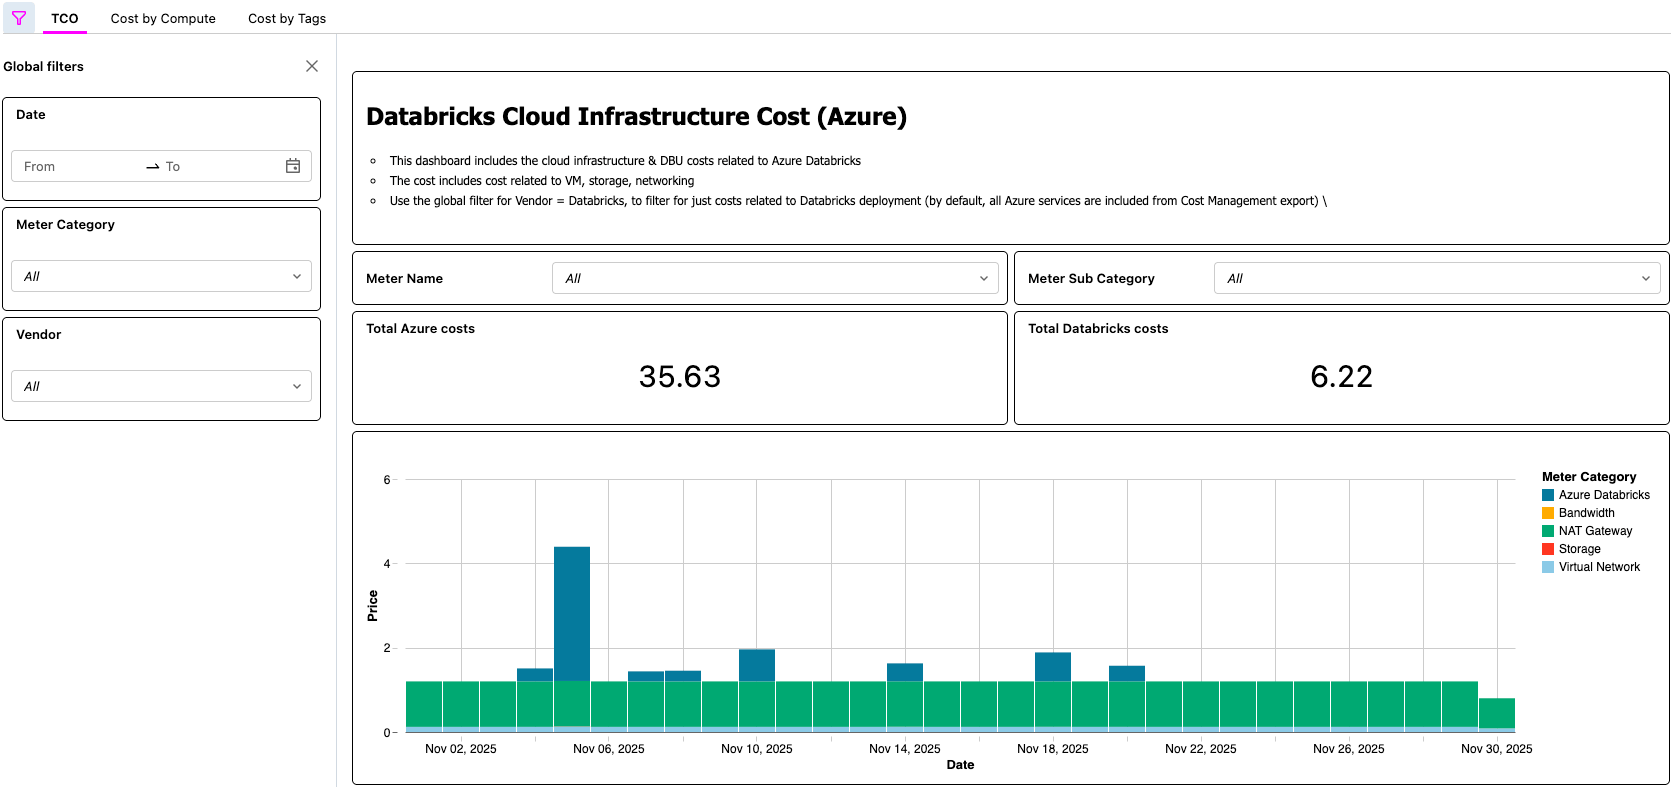
- [Databricks] Validate data in the AI/BI Dashboard and validate the Lakeflow Job
- This final step is where the value is realized. Customers now have an automated process that enables them to view the TCO of their Lakehouse architecture!
AI/BI Dashboard Displaying Azure Databricks TCO
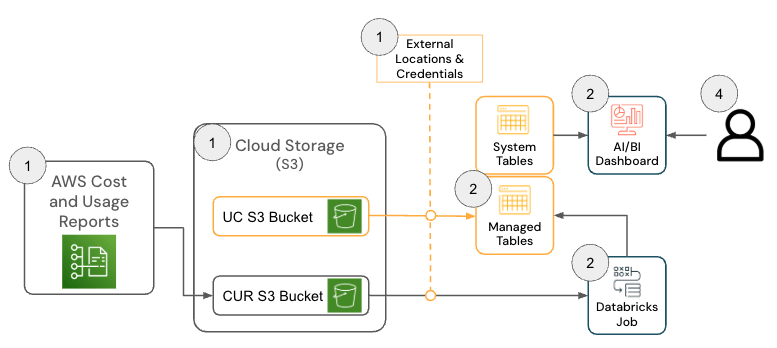
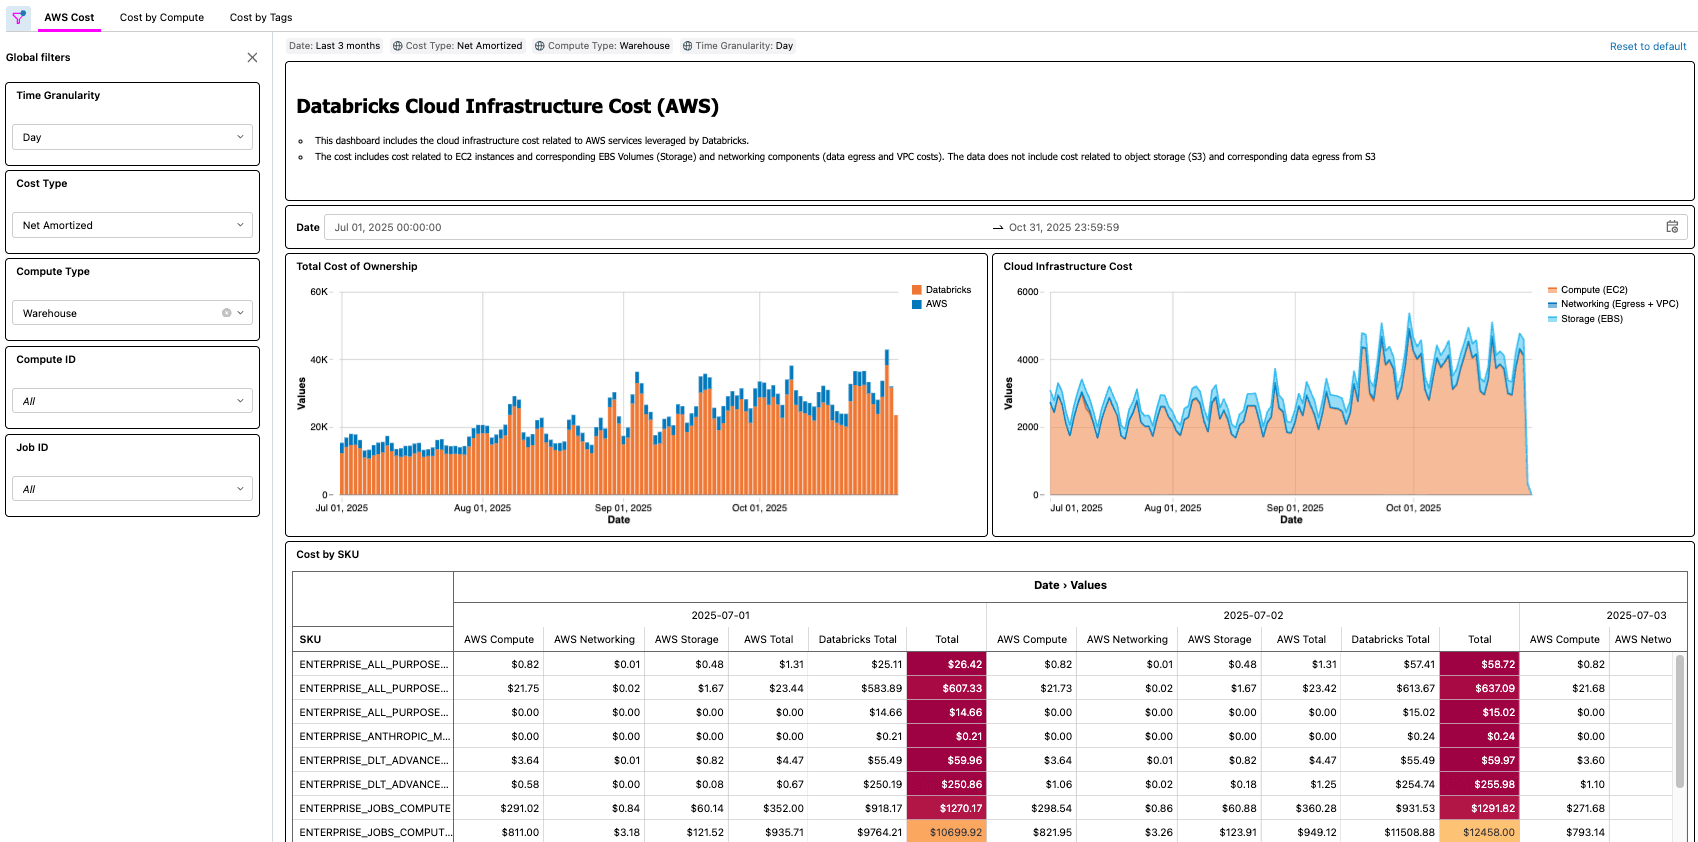
Databricks on AWS Solution
The solution for Databricks on AWS consists of several architecture components that work together to ingest AWS Cost & Usage Report (CUR) 2.0 data and persist it in Databricks using the medallion architecture.
To deploy this solution, the following permissions and configurations must be in place across AWS and Databricks:
- AWS
- Permissions to create a CUR
- Permissions to create an Amazon S3 bucket (or permissions to deploy the CUR in a current bucket)
- Note: The solution requires AWS CUR 2.0. If you still have a CUR 1.0 export, AWS documentation provides the required steps to upgrade.
- Databricks
- Permission to create the following resources:
- Storage Credential
- External Location
- Permission to create the following resources:
The GitHub repository provides more detailed setup instructions; however, at a high level, the solution for AWS Databricks has the following steps.
- [AWS] AWS Cost & Usage Report (CUR) 2.0 Setup
- The purpose of this step is to leverage AWS CUR functionality so that the AWS billing data is available in an easy-to-consume format.
- [Databricks] Databricks Asset Bundle (DAB) Configuration
- The purpose of this step is to ingest and model the AWS billing data so that it can be visualized using an AI/BI dashboard.
- [Databricks] Review Dashboard and validate Lakeflow Job
- This final step is where the value is realized. Customers now have an automated process that makes the TCO of their lakehouse architecture available to them!
Real-World Scenarios
As demonstrated with both Azure and AWS solutions, there are many real-world examples that a solution like this enables, such as:
- Identifying and calculating total cost-savings after optimizing a job with low CPU and/or Memory
- Identifying workloads running on VM types that do not have a reservation
- Identifying workloads with abnormally high networking and/or local storage cost
As a practical example, a FinOps practitioner at a large organization with thousands of workloads might be tasked with finding low hanging fruit for optimization by looking for workloads that cost a certain amount, but that also have low CPU and/or memory utilization. Since the organization’s TCO information is now surfaced via the Cloud Infra Cost Field Solution, the practitioner can then join that data to the Node Timeline System Table (AWS, AZURE, GCP) to surface this information and accurately quantify the cost savings once the optimizations are complete. The questions that matter most will depend on each customer’s business needs. For example, General Motors uses this type of solution to answer many of the questions above and more to ensure they are getting the maximum value from their lakehouse architecture.
Key Takeaways
After implementing the Cloud Infra Cost Field Solution, organizations gain a single, trusted TCO view that combines Databricks and related cloud infrastructure spend, eliminating the need for manual cost reconciliation across platforms. Examples of questions you can answer using the solution include:
- What is the breakdown of cost for my Databricks usage across the cloud provider and Databricks?
- What is the total cost of running a workload, including VM, local storage, and networking costs?
- What is the difference in total cost of a workload when it runs on serverless vs when it runs on classic compute
Platform and FinOps teams can drill into full costs by workspace, workload and business unit directly in Databricks, making it far easier to align usage with budgets, accountability models, and FinOps practices. Because all underlying data is available as governed tables, teams can build their own cost applications—dashboards, internal apps or use built-in AI assistants like Databricks Genie—accelerating insight generation and turning FinOps from a periodic reporting exercise into an always-on, operational capability.
Next Steps & Resources
Deploy the Cloud Infra Cost Field Solution today from GitHub (link here, available on AWS and Azure), and get full visibility into your total Databricks spend. With full visibility in place, you can optimize your Databricks costs, including considering serverless for automated infrastructure management.
The dashboard and pipeline created as part of this solution offer a fast and effective way to begin analyzing Databricks spend alongside the rest of your infrastructure costs. However, every organization allocates and interprets charges differently, so you may choose to further tailor the models and transformations to your needs. Common extensions include joining infrastructure cost data with additional Databricks System Tables (AWS | AZURE | GCP) to improve attribution accuracy, building logic to separate or reallocate shared VM costs when using instance pools, modeling VM reservations differently or incorporating historical backfills to support long-term cost trending. As with any hyperscaler cost model, there is substantial room to customize the pipelines beyond the default implementation to align with internal reporting, tagging strategies and FinOps requirements.
Databricks Delivery Solutions Architects (DSAs) accelerate Data and AI initiatives across organizations. They provide architectural leadership, optimize platforms for cost and performance, enhance developer experience, and drive successful project execution. DSAs bridge the gap between initial deployment and production-grade solutions, working closely with various teams, including data engineering, technical leads, executives, and other stakeholders to ensure tailored solutions and faster time to value. To benefit from a custom execution plan, strategic guidance and support throughout your data and AI journey from a DSA, please contact your Databricks Account Team.
Get the latest posts in your inbox
Subscribe to our blog and get the latest posts delivered to your inbox.