From Chaos to Control: A Cost Maturity Journey with Databricks
Use a structured process to assess Databricks cost control maturity, identify usage patterns, enforce budgets, optimize workloads, and reduce unnecessary spend.
by Zach King and Rajneesh Arora
- Organizations face rising pressure to balance cloud and platform costs with high demand for data and AI-intensive workloads.
- Databricks provides efficient cost management controls to support incremental maturity among FinOps teams, aligning with industry standard FinOps core beliefs.
- This blog provides implementation guidance for cost allocation, control, and optimizations on Databricks for production-grade environments.
Introduction: The Importance of FinOps in Data and AI Environments
Companies across every industry have continued to prioritize optimization and the value of doing more with less. This is especially true of digital native companies in today’s data landscape, which yields higher and higher demand for AI and data-intensive workloads. These organizations manage thousands of resources in various cloud and platform environments. In order to innovate and iterate quickly, many of these resources are democratized across teams or business units; however, higher velocity for data practitioners can lead to chaos unless balanced with careful cost management.
Digital native organizations frequently employ central platform, DevOps, or FinOps teams to oversee the costs and controls for cloud and platform resources. Formal practice of cost control and oversight, popularized by The FinOps Foundation™, is also supported by Databricks with features such as tagging, budgets, compute policies, and more. Nonetheless, the decision to prioritize cost management and establish structured ownership does not create cost maturity overnight. The methodologies and features covered in this blog enable teams to incrementally mature cost management within the Data Intelligence Platform.
What we’ll cover:
- Cost Attribution: Reviewing the key considerations for allocating costs with tagging and budget policies.
- Cost Reporting: Monitoring costs with Databricks AI/BI dashboards.
- Cost Control: Automatically enforcing cost controls with Terraform, Compute Policies, and Databricks Asset Bundles.
- Cost Optimization: Common Databricks optimizations checklist items.
Whether you’re an engineer, architect, or FinOps professional, this blog will help you maximize efficiency while minimizing costs, ensuring that your Databricks environment remains both high-performing and cost-effective.
Technical Solution Breakdown
We will now take an incremental approach to implementing mature cost management practices on the Databricks Platform. Think of this as the “Crawl, Walk, Run” journey to go from chaos to control. We will explain how to implement this journey step by step.
Step 1: Cost Attribution
The first step is to correctly assign expenses to the right teams, projects, or workloads. This involves efficiently tagging all the resources (including serverless compute) to gain a clear view of where costs are being incurred. Proper attribution enables accurate budgeting and accountability across teams.
Cost attribution can be done for all compute SKUs with a tagging strategy, whether for a classic or serverless compute model. Classic compute (workflows, Declarative Pipelines, SQL Warehouse, etc.) inherits tags on the cluster definition, while serverless adheres to Serverless Budget Policies (AWS | Azure | GCP).
In general, you can add tags to two kinds of resources:
- Compute Resources: Includes SQL Warehouse, jobs, instance pools, etc.
- Unity Catalog Securables: Includes catalog, schema, table, view, etc.
Tagging for both types of resources would contribute to effective governance and management:
- Tagging the compute resources has a direct impact on cost management.
- Tagging Unity Catalog securables helps with organizing and searching those objects, but this is outside the scope of this blog.
Refer to this article (AWS | AZURE | GCP) for details about tagging different compute resources, and this article (AWS | Azure | GCP) for details about tagging Unity Catalog securables.
Tagging Classic Compute
For classic compute, tags can be specified in the settings when creating the compute. Below are some examples of different types of compute to show how tags can be defined for each, using both the UI and the Databricks SDK..
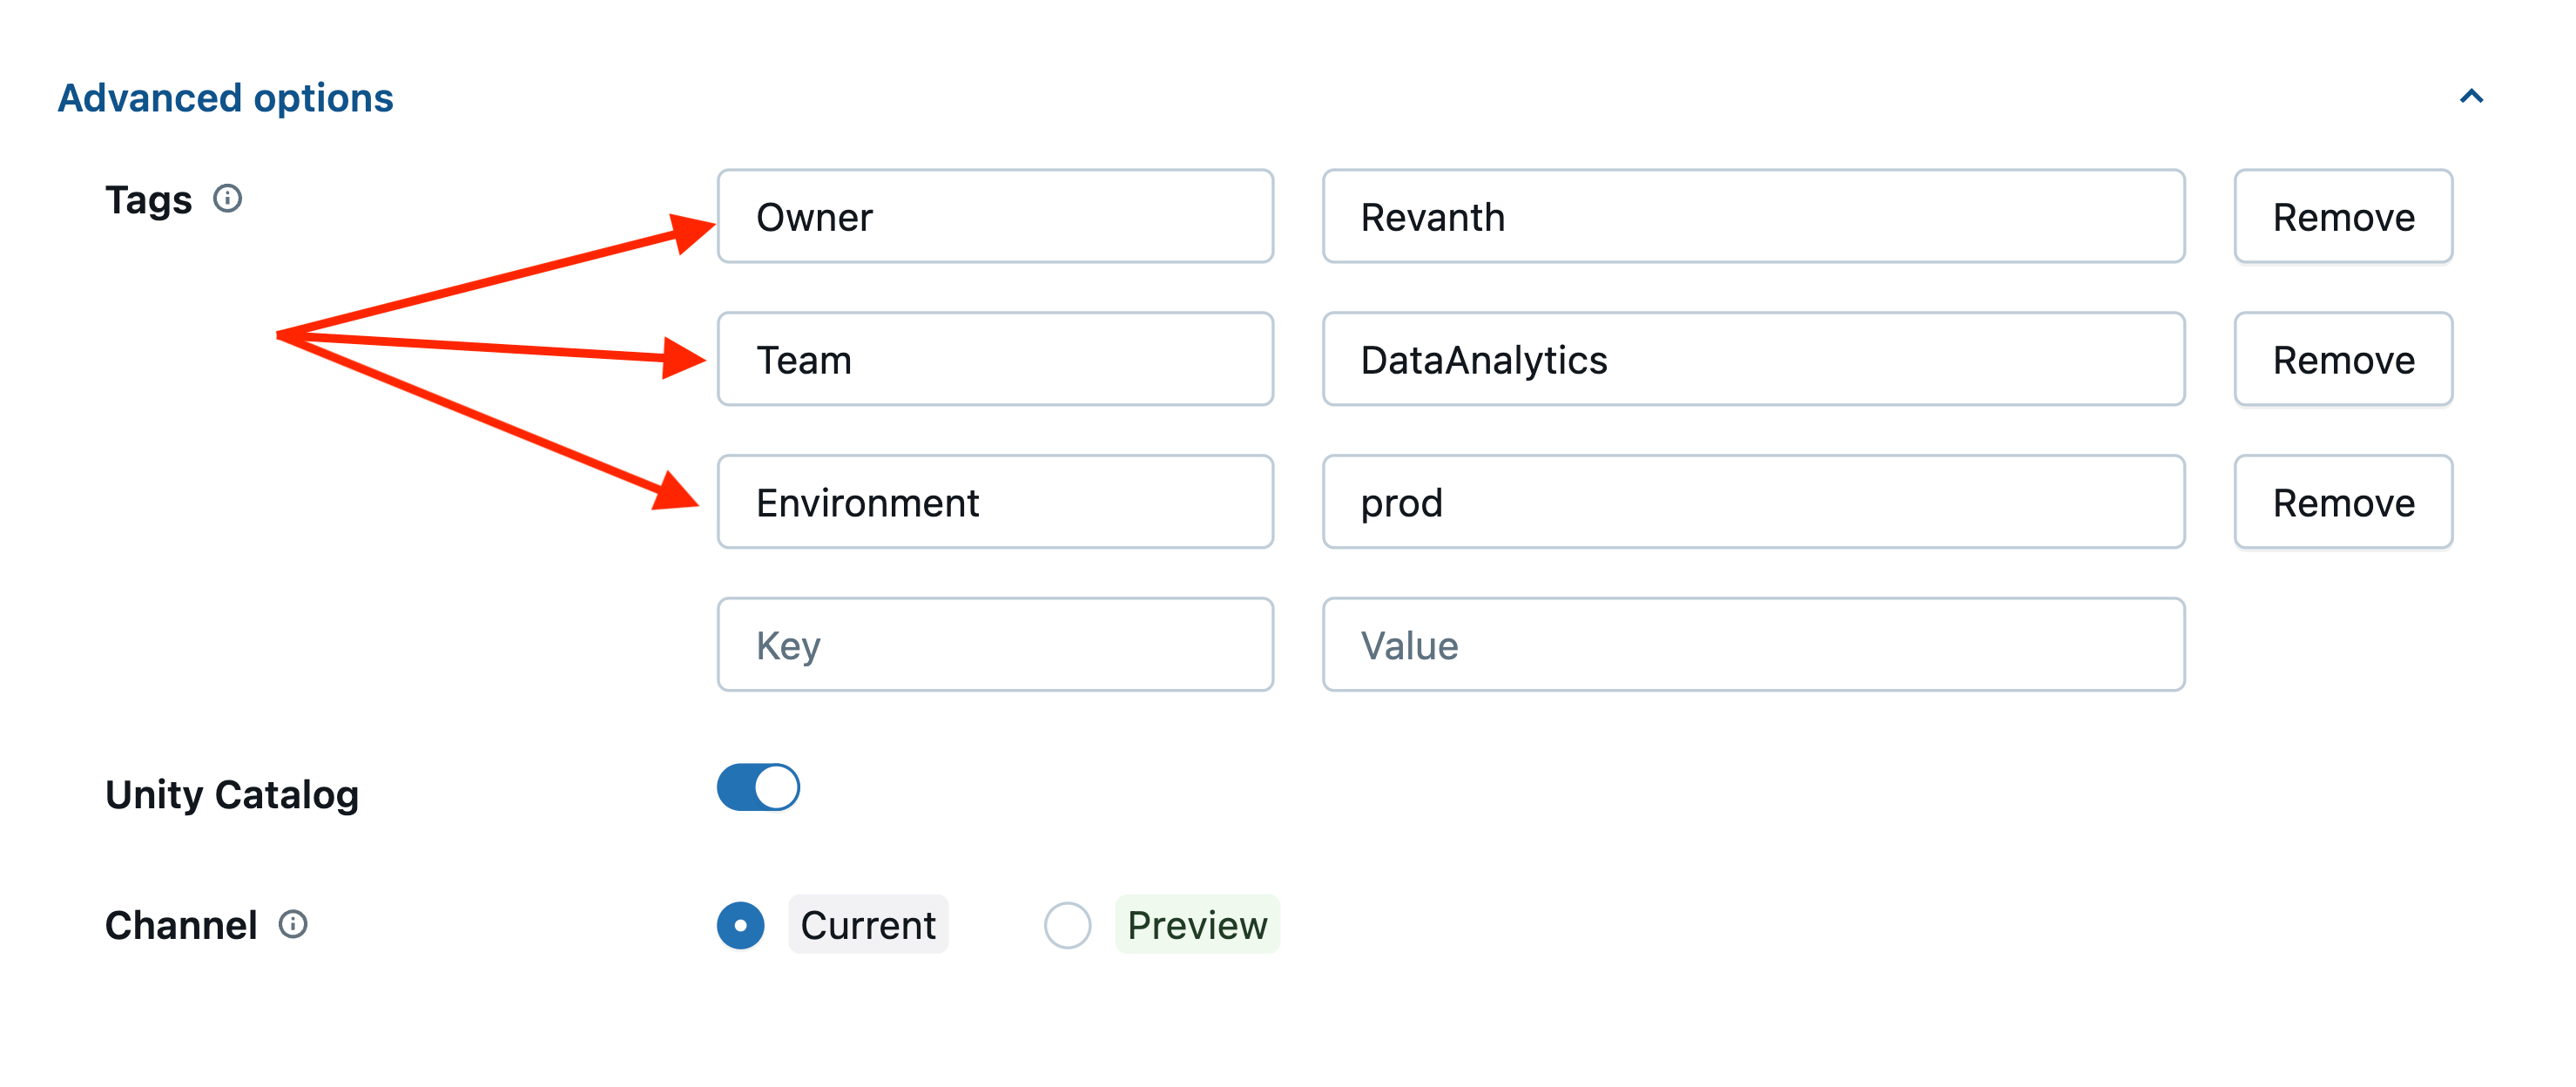
SQL Warehouse Compute:
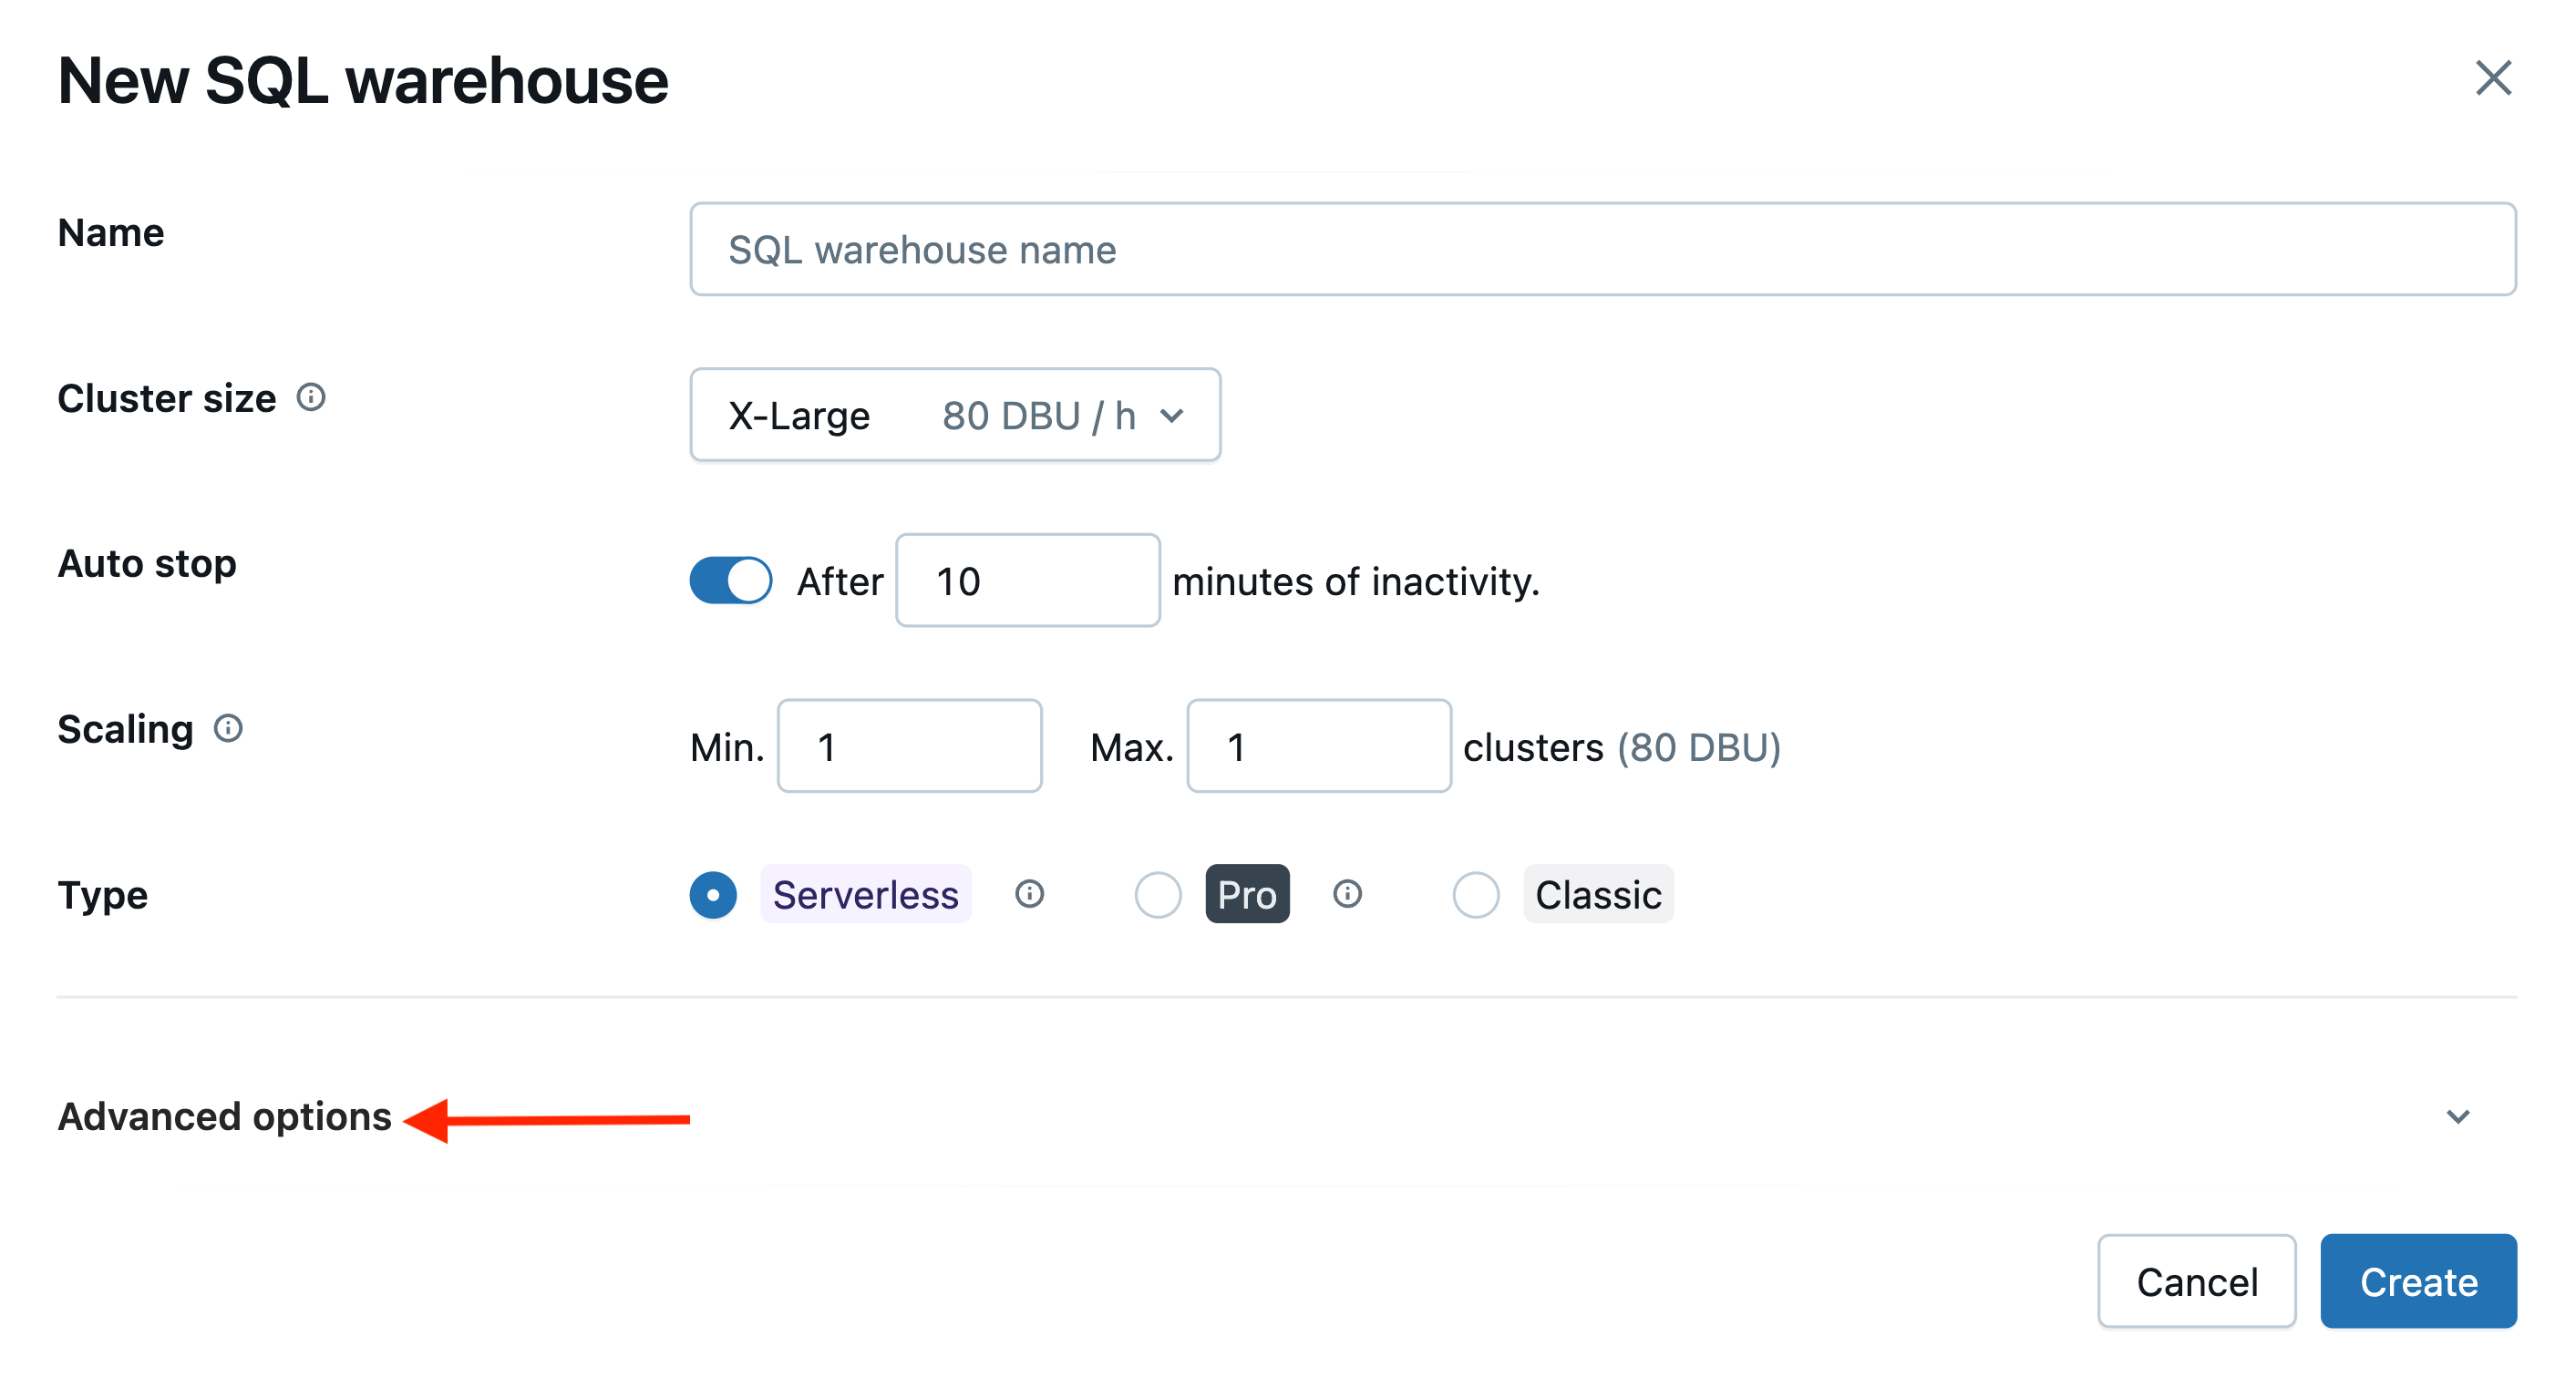
You can set the tags for a SQL Warehouse in the Advanced Options section.
With Databricks SDK:
All-Purpose Compute:
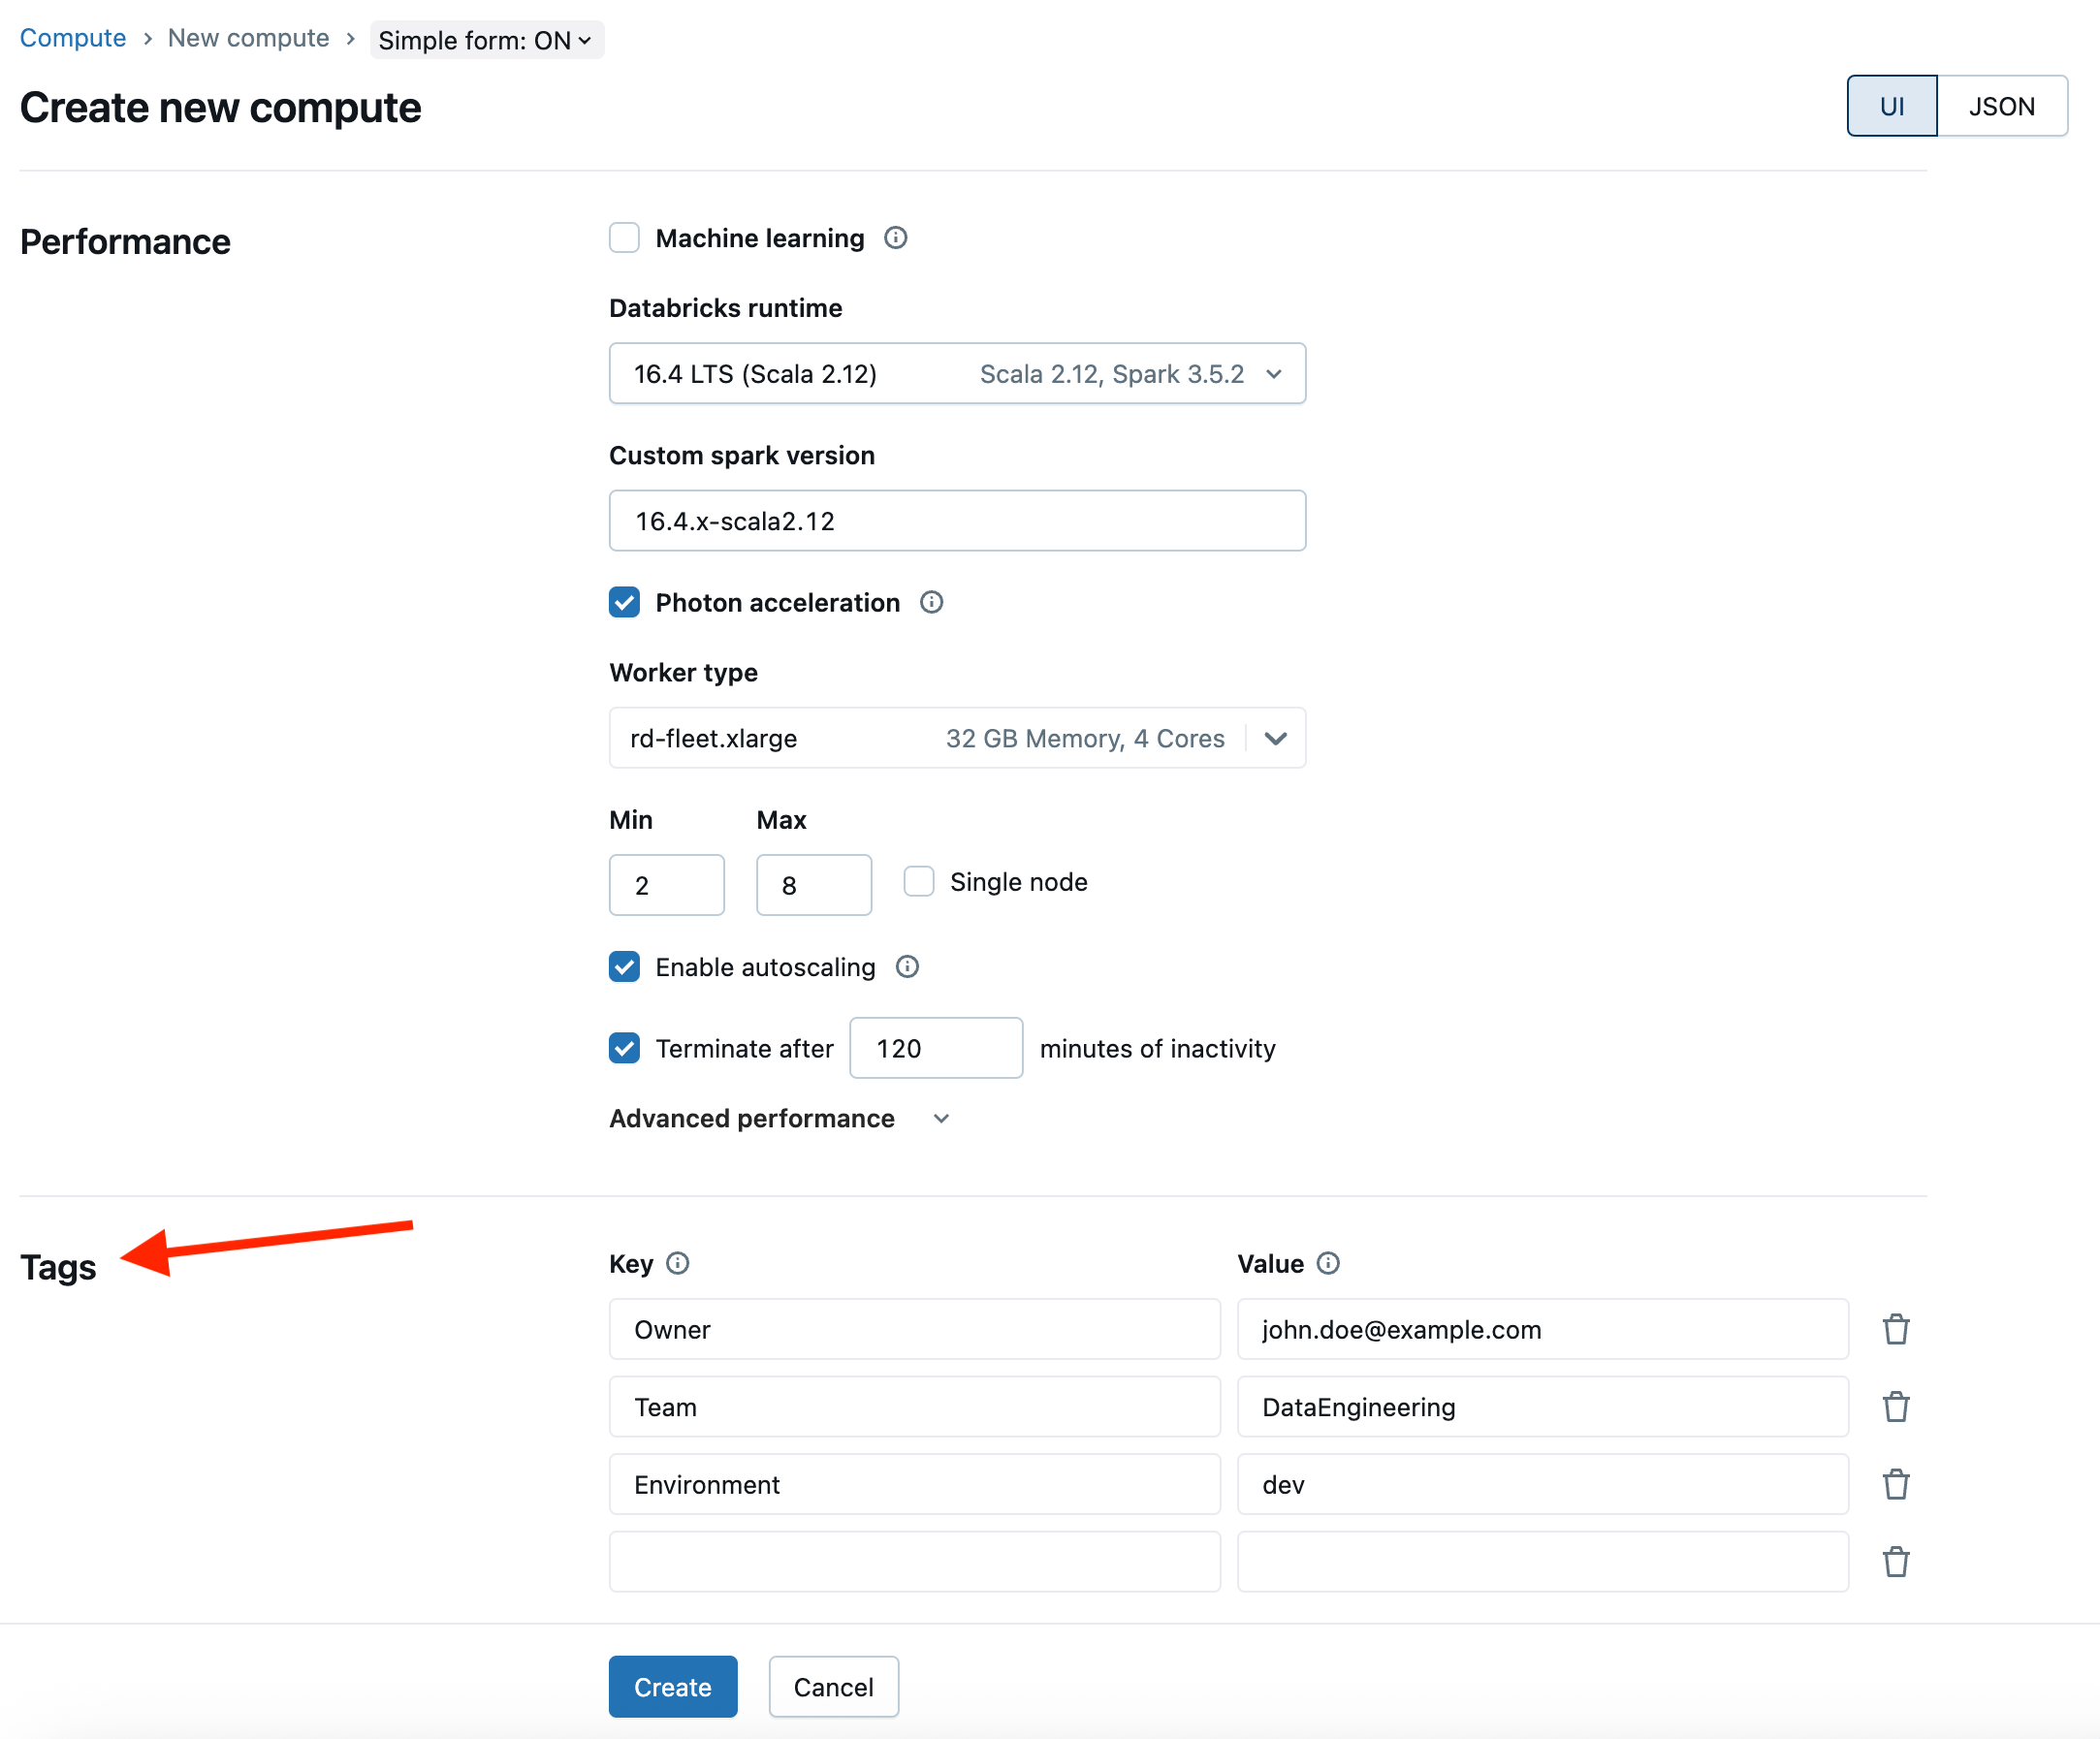
With Databricks SDK:
Job Compute:
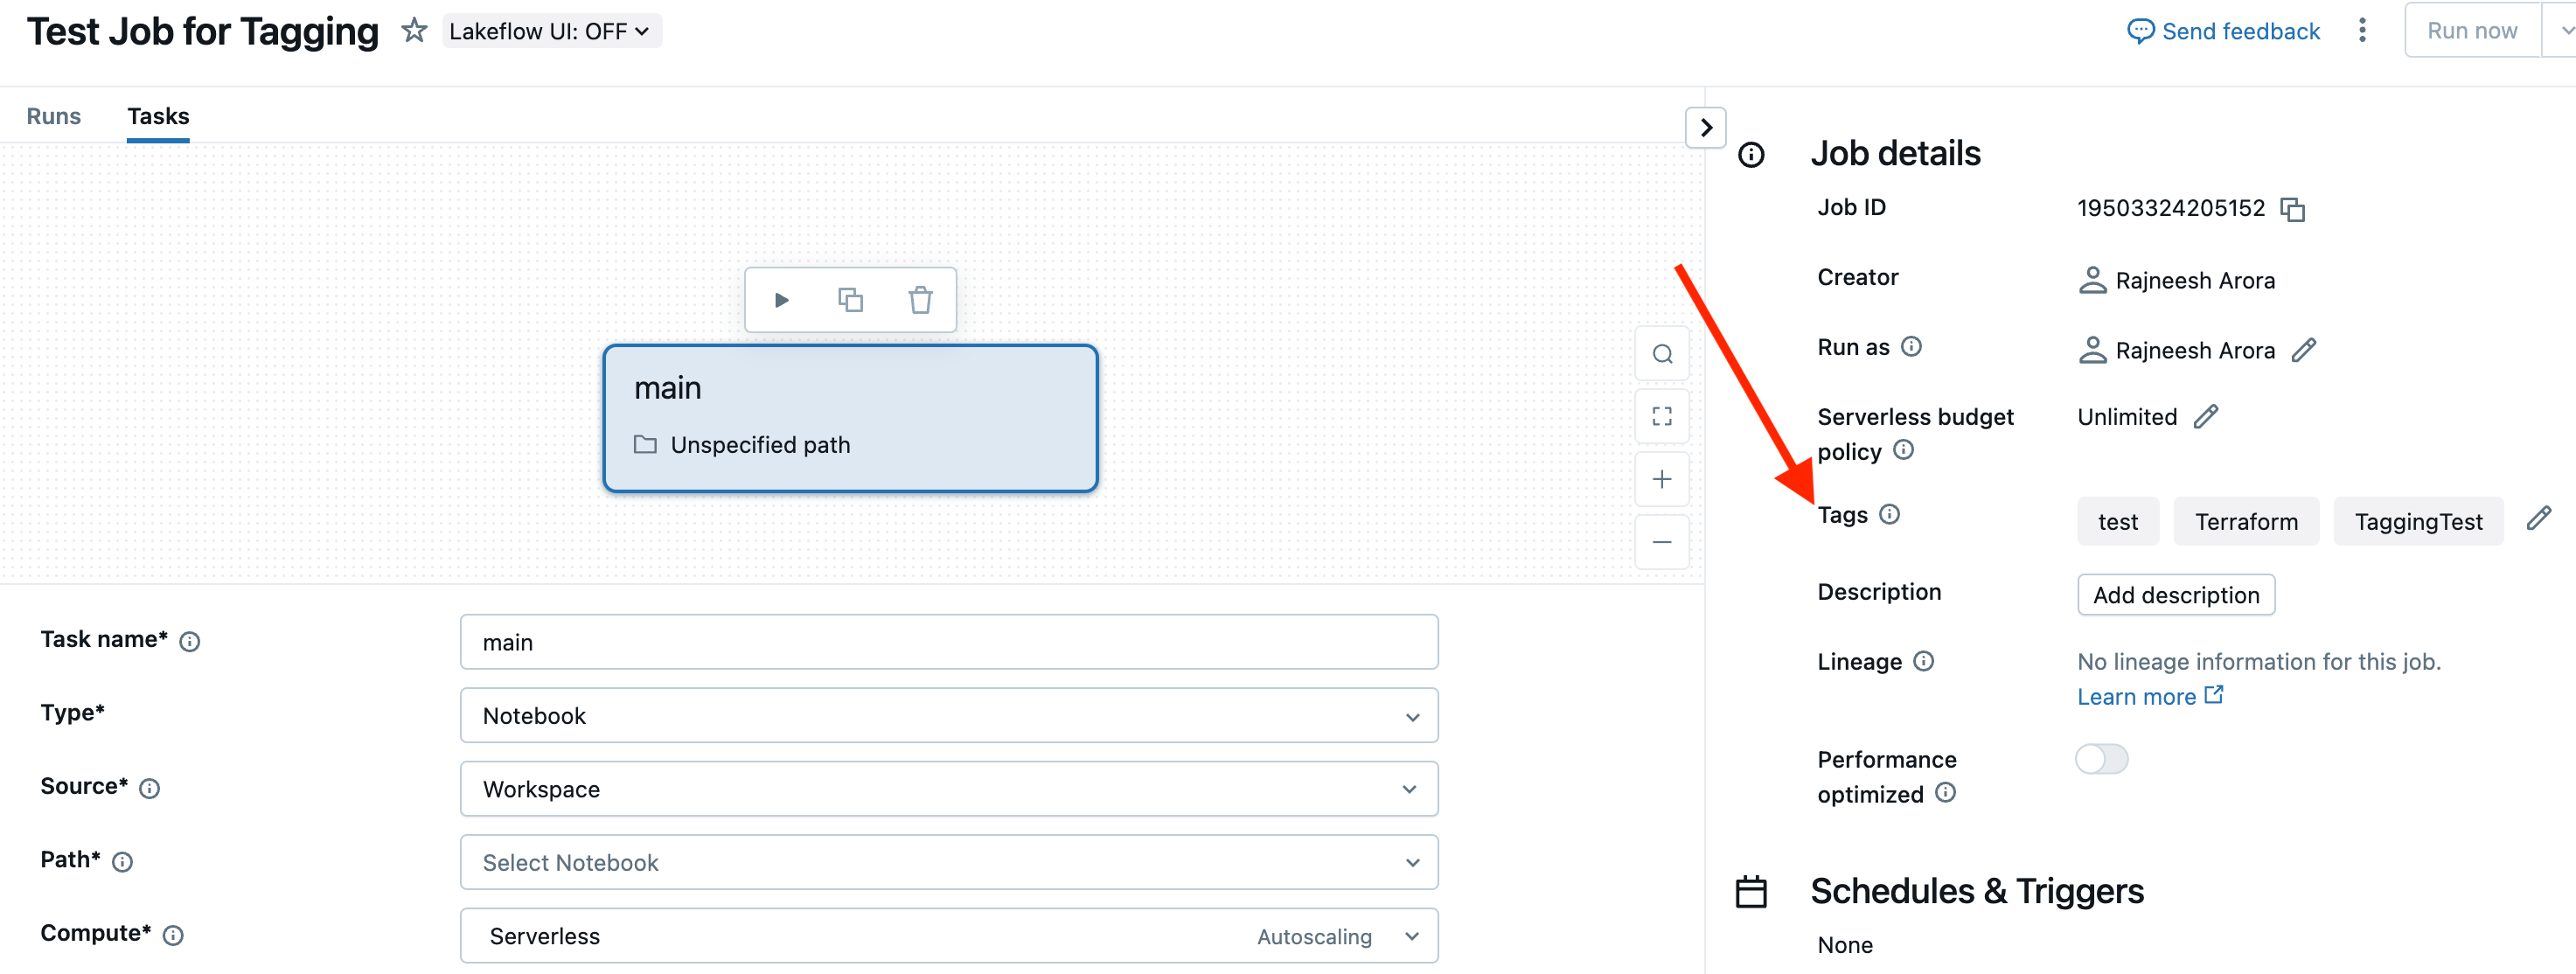
With Databricks SDK:
Declarative Pipelines:
Tagging Serverless Compute
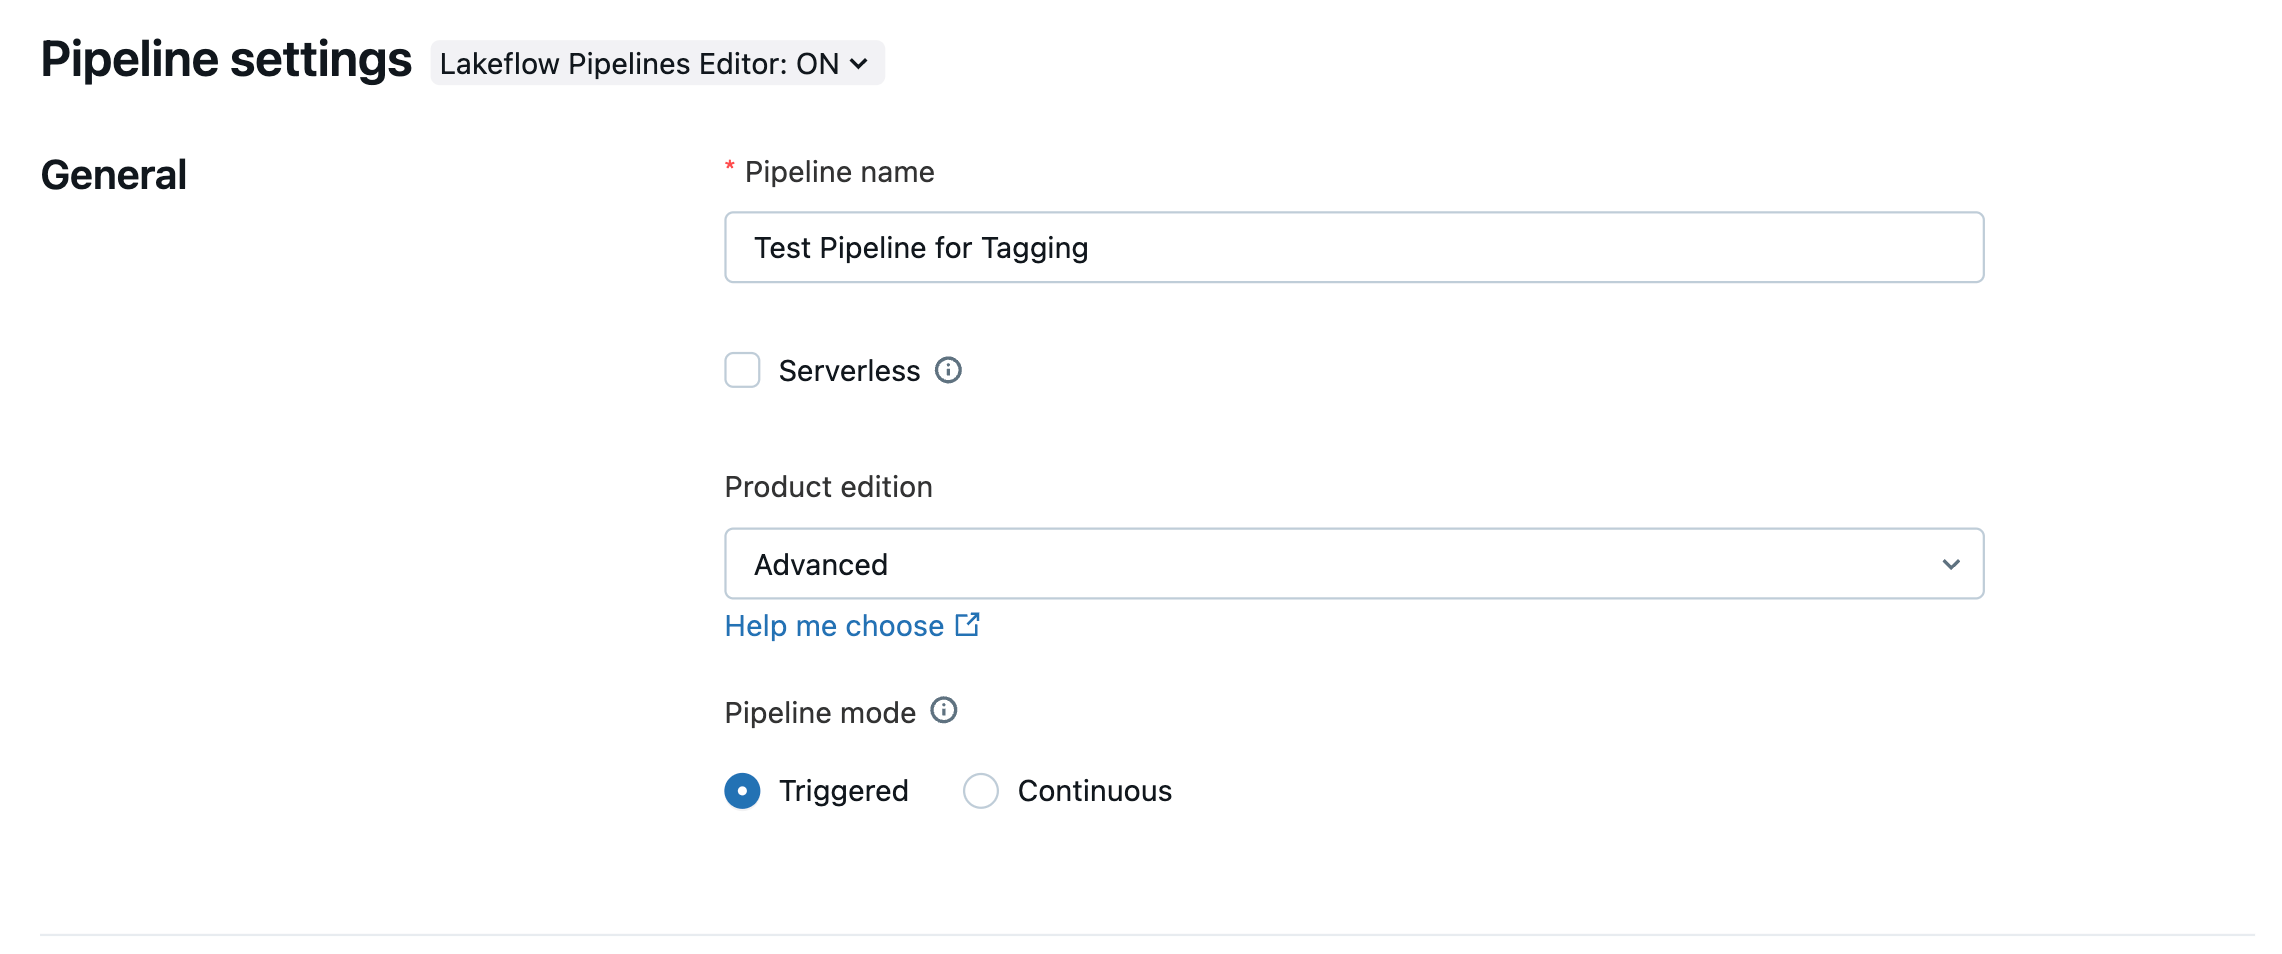
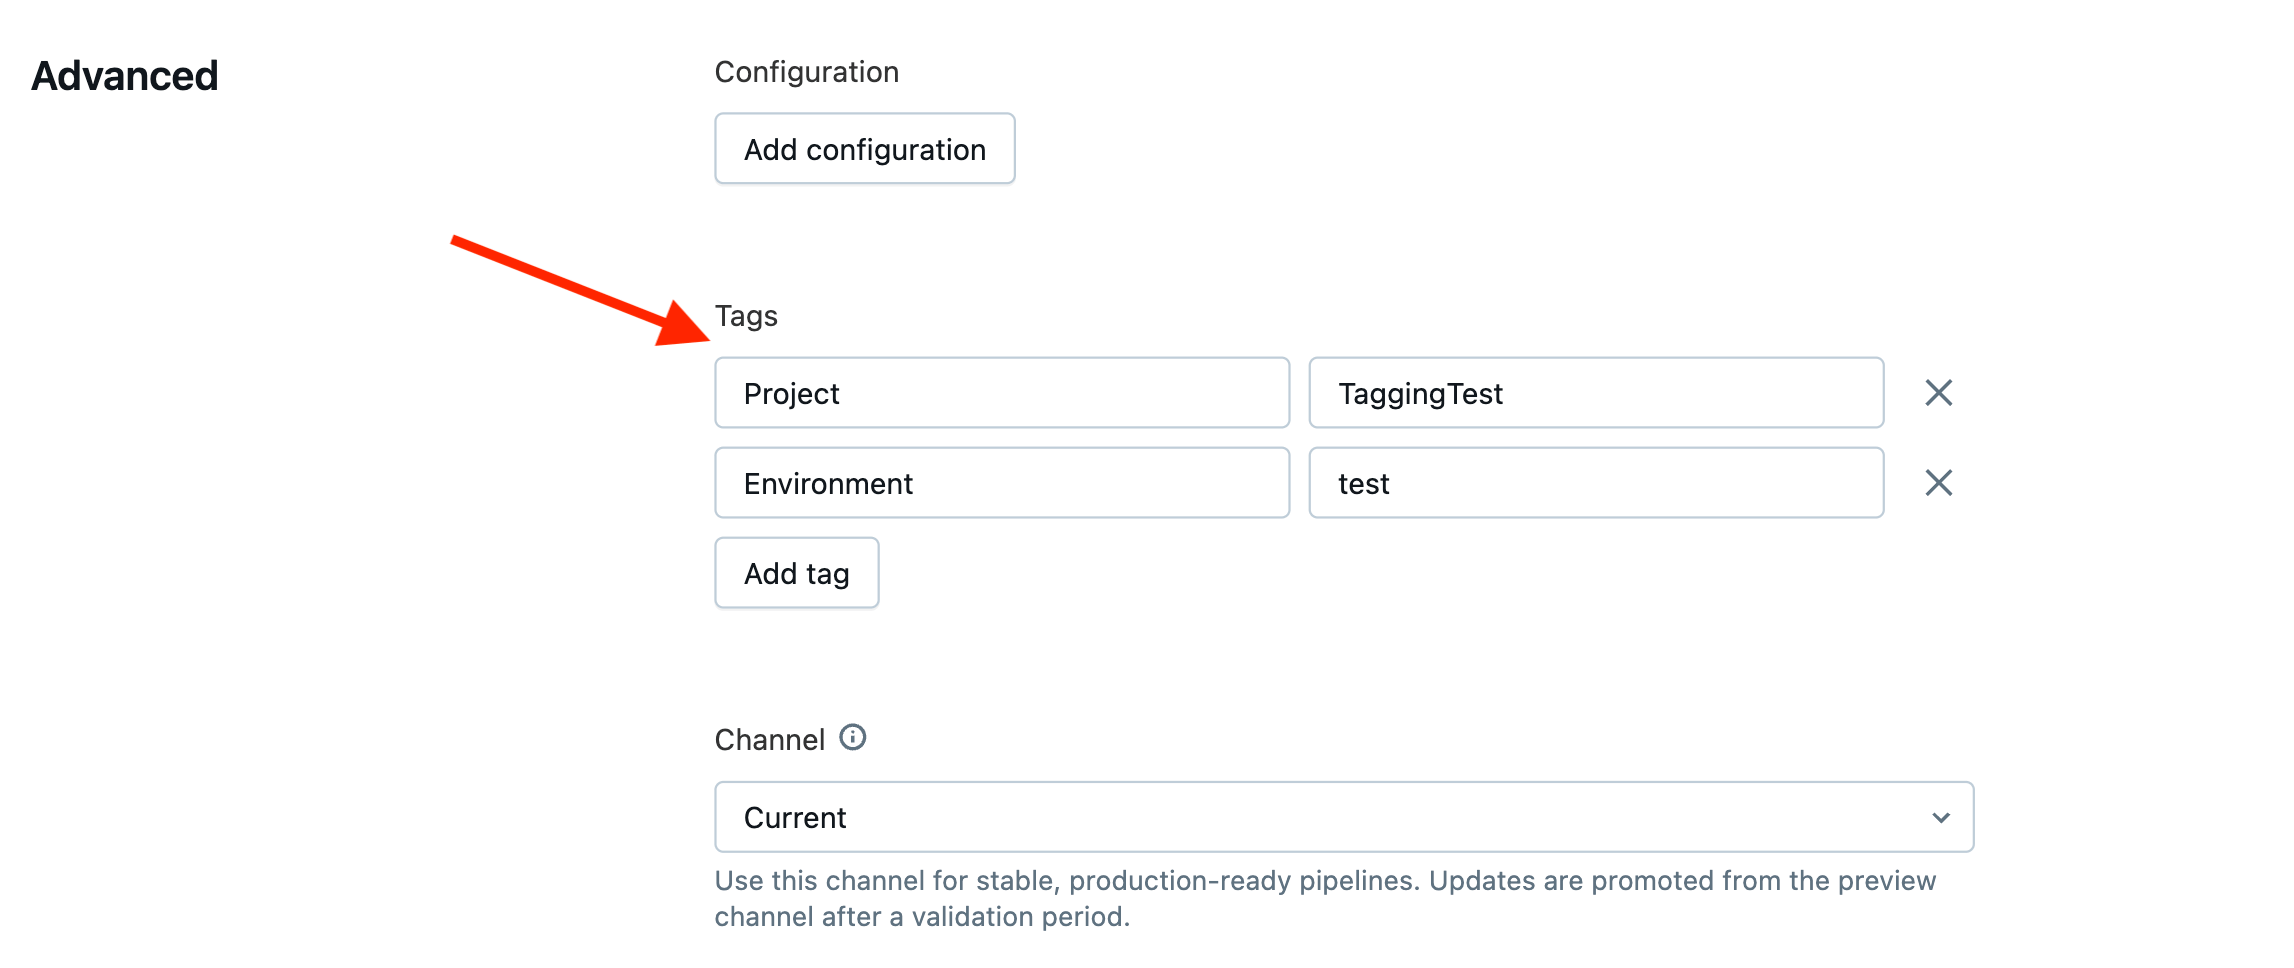
For serverless compute, you should assign tags with a budget policy. Creating a policy allows you to specify a policy name and tags of string keys and values.
It's a 3-step process:
- Step 1: Create a budget policy (Workspace admins can create one, and users with Manage access can manage them)
- Step 2: Assign Budget Policy to users, groups, and service principals
- Step 3: Once the policy is assigned, the user is required to select a policy when using serverless compute. If the user has only one policy assigned, that policy is automatically selected. If the user has multiple policies assigned, they have an option to choose one of them.
You can refer to details about serverless Budget Policies (BP) in these articles (AWS/AZURE/GCP).
Certain aspects to keep in mind about Budget Policies:
- A Budget Policy is very different from Budgets (AWS | Azure | GCP). We will cover Budgets in Step 2: Cost Reporting.
- Budget Policies exist at the account level, but they can be created and managed from a workspace. Admins can restrict which workspaces a policy applies to by binding it to specific workspaces.
- A Budget Policy only applies to serverless workloads. Currently, at the time of writing this blog, it applies to notebooks, jobs, pipelines, serving endpoints, apps, and AI Search endpoints.
- Let’s take an example of jobs having a couple of tasks. Each task can have its own compute, while BP tags are assigned at the job level (and not at the task level). So, there is a possibility that one task runs on serverless while the other runs on general non-serverless compute. Let’s see how Budget Policy tags would behave in the following scenarios:
- Case 1: Both tasks run on serverless
- In this case, BP tags would propagate to system tables.
- Case 2: Only one task runs on serverless
- In this case, BP tags would also propagate to system tables for the serverless compute usage, while the classic compute billing record inherits tags from the cluster definition.
- Case 3: Both tasks run on non-serverless compute
- In this case, BP tags would not propagate to the system tables.
- Case 1: Both tasks run on serverless
With Terraform:
Best Practices Related to Tags:
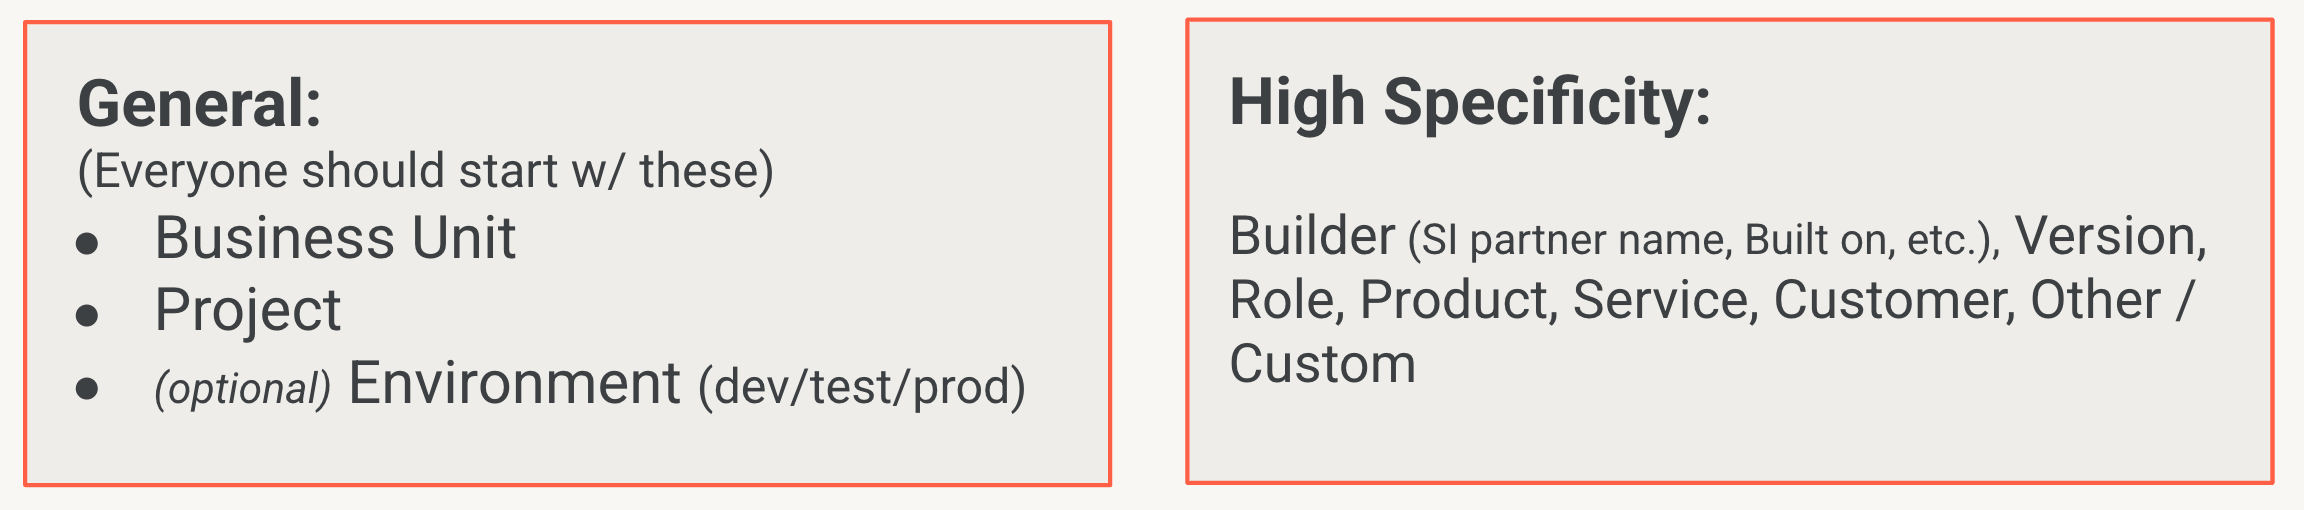
- It’s recommended that everyone apply General Keys, and for organizations that want more granular insights, they should apply high-specificity keys that are right for their organization.
- A business policy should be developed and shared among all users regarding the fixed keys and values that you want to enforce across your organization. In Step 4, we will see how Compute Policies are used to systematically control allowed values for tags and require tags in the right spots.
- Tags are case-sensitive. Use consistent and readable casing styles such as Title Case, PascalCase, or kebab-case.
- For initial tagging compliance, consider building a scheduled job that queries tags and reports any misalignments with your organization’s policy.
- It is recommended that every user has permission to at least one budget policy. That way, whenever the user creates a notebook/job/pipeline/etc., using serverless compute, the assigned BP is automatically applied.
Sample Tag - Key: Value pairings
Step 2: Cost Reporting
System Tables
Next is cost reporting, or the ability to monitor costs with the context provided by Step 1. Databricks provides built-in system tables, like system.billing.usage, which is the foundation for cost reporting. System tables are also useful when customers want to customize their reporting solution.
For example, the Account Usage dashboard you’ll see next is a Databricks AI/BI dashboard, so you can view all the queries and customize the dashboard to fit your needs very easily. If you need to write ad hoc queries against your Databricks usage, with very specific filters, this is at your disposal.
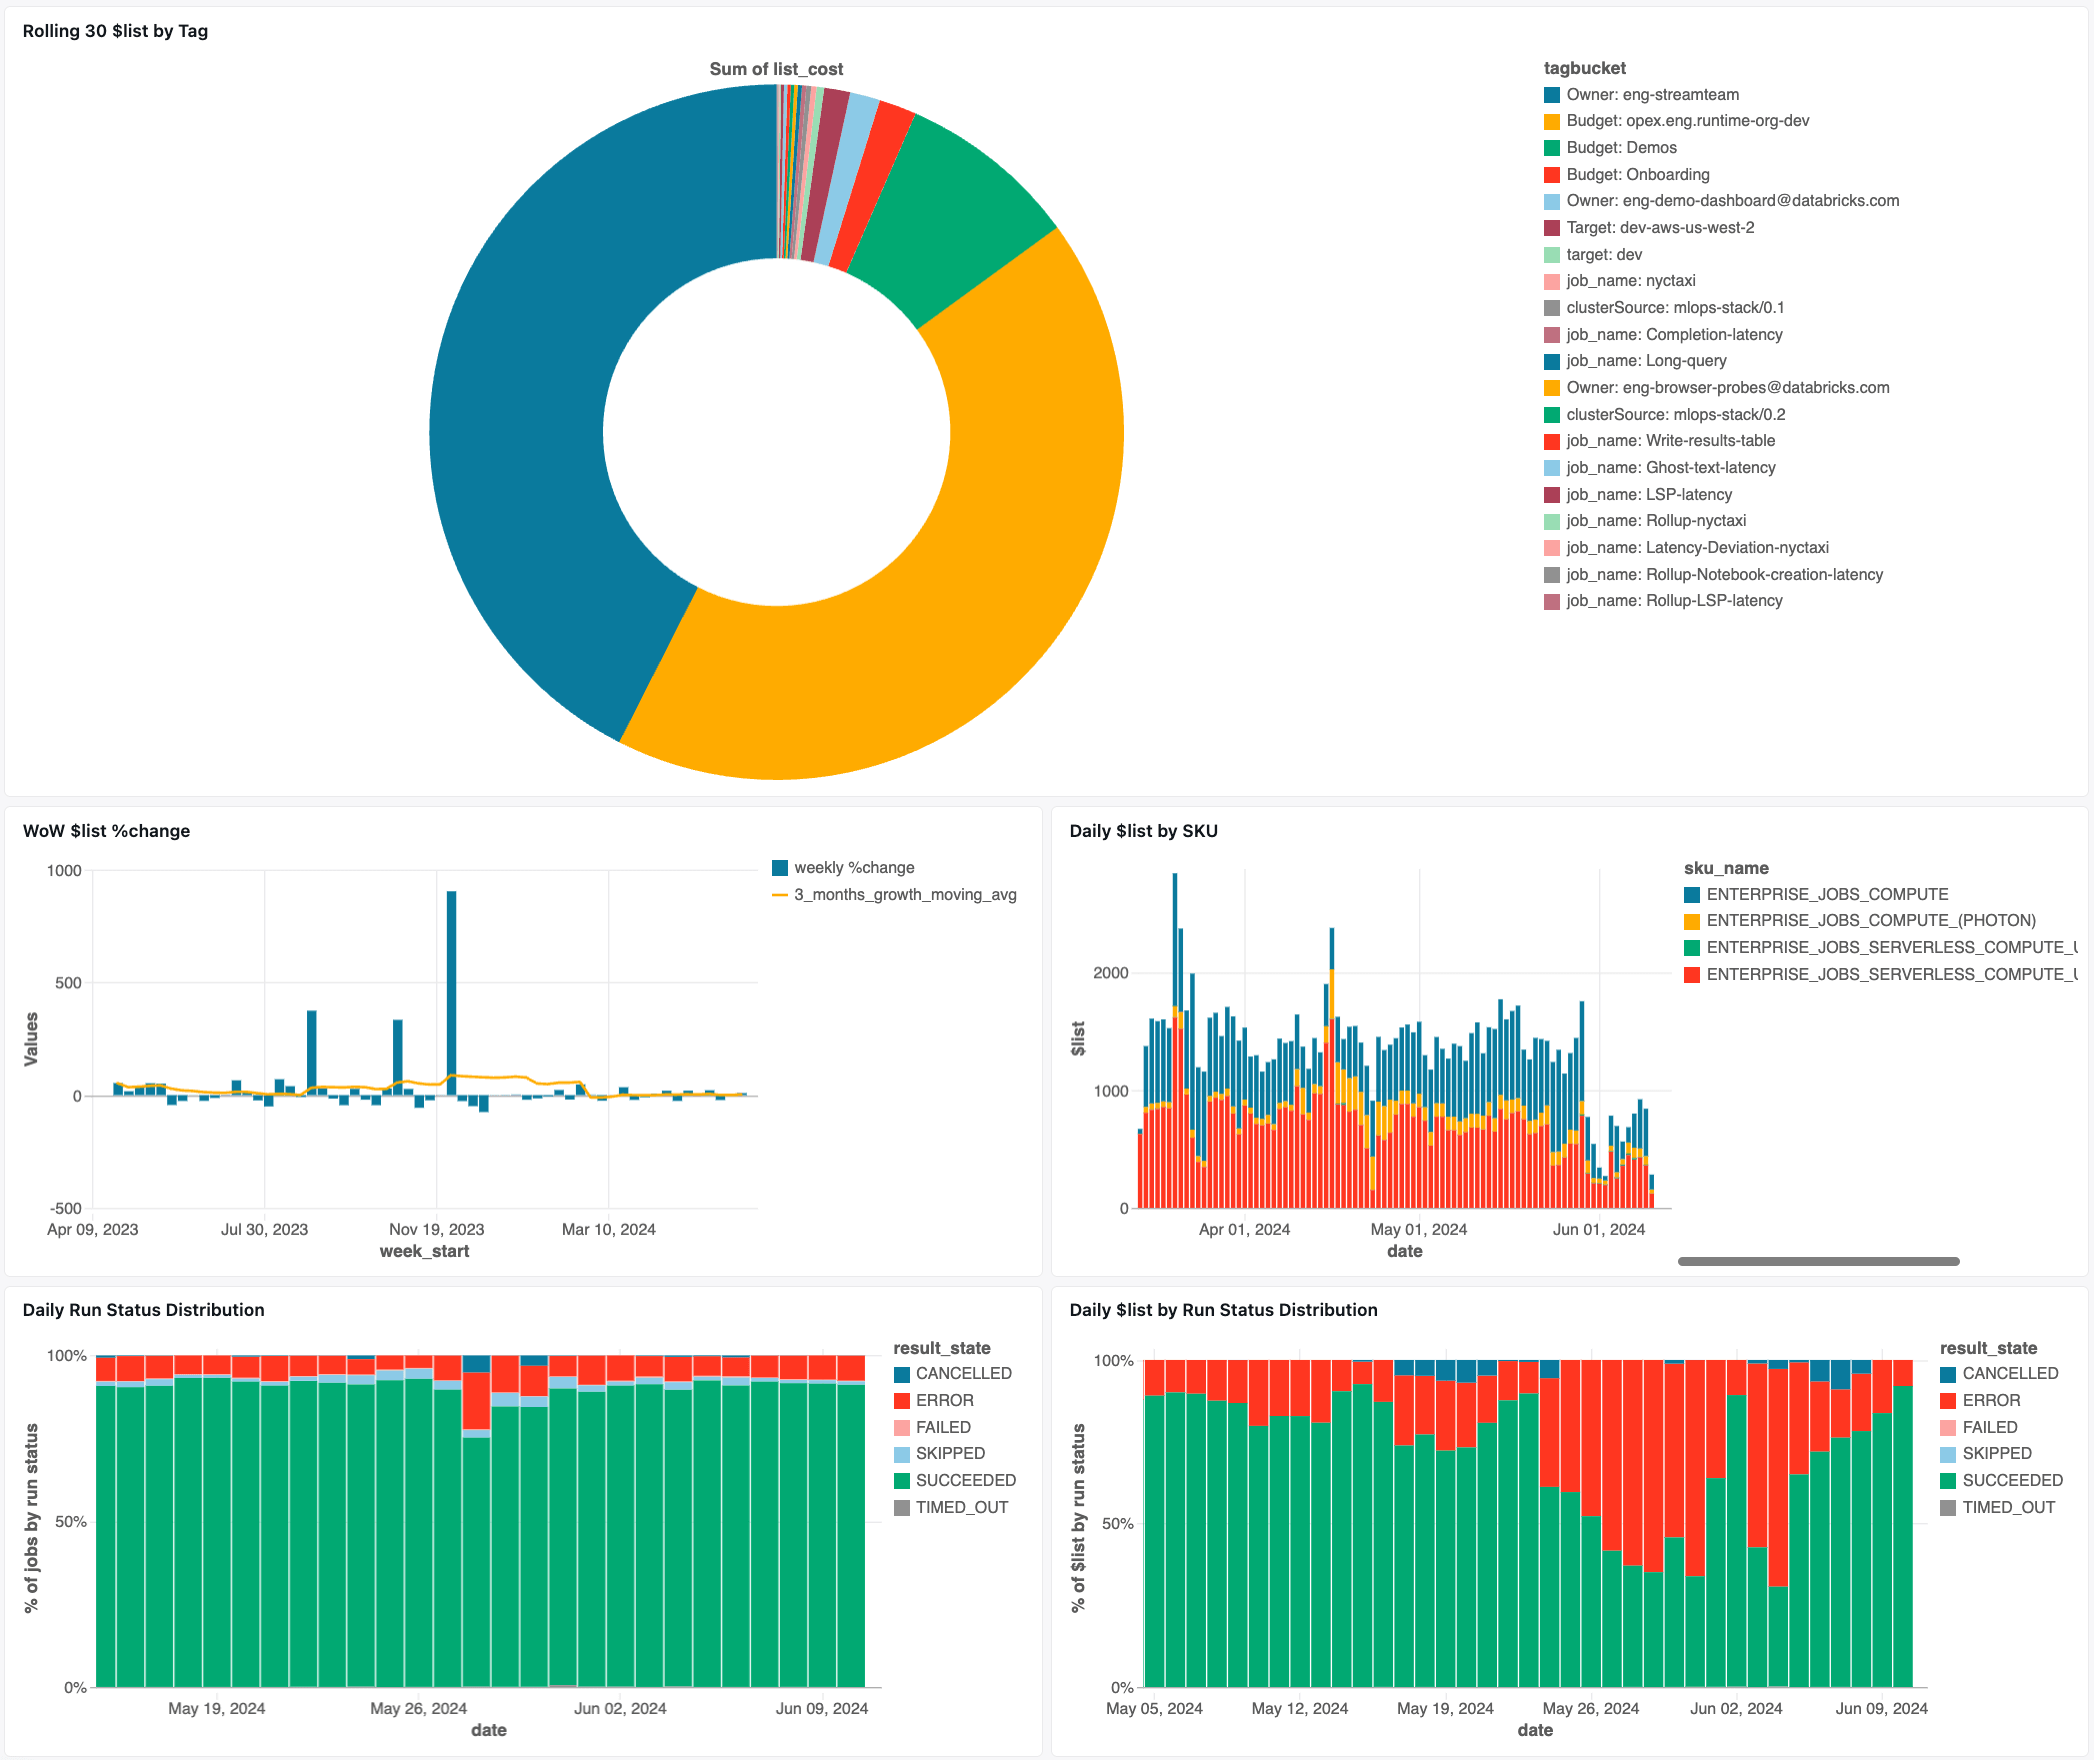
The Account Usage Dashboard
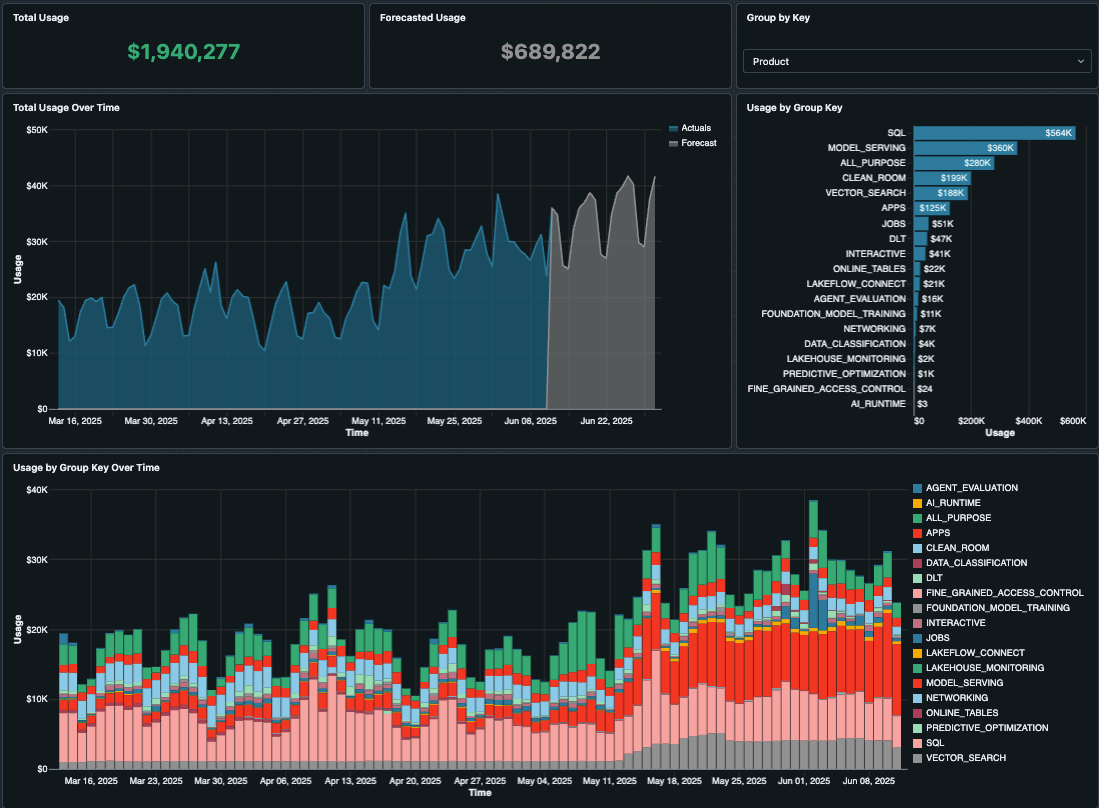
Once you have started tagging your resources and attributing costs to their cost centers, teams, projects, or environments, you can begin to discover the areas where costs are the highest. Databricks provides a Usage Dashboard you can simply import to your own workspace as an AI/BI dashboard, providing immediate out-of-the-box cost reporting.
A new version version 2.0 of this dashboard is available for preview with several improvements shown below. Even if you have previously imported the Account Usage dashboard, please import the new version from GitHub today!
This dashboard provides a ton of useful information and visualizations, including data like the:
- Usage overview, highlighting total usage trends over time, and by groups like SKUs and workspaces.
- Top N usage that ranks top usage by selected billable objects such as job_id, warehouse_id, cluster_id, endpoint_id, etc.
- Usage analysis based on tags (the more tagging you do per Step 1, the more useful this will be).
- AI forecasts that indicate what your spending will be in the coming weeks and months.
The dashboard also allows you to filter by date ranges, workspaces, products, and even enter custom discounts for private rates. With so much packed into this dashboard, it really is your primary one-stop shop for most of your cost reporting needs.
Jobs Monitoring Dashboard
For Lakeflow jobs, we recommend the Jobs System Tables AI/BI Dashboard to quickly see potential resource-based costs, as well as opportunities for optimization, such as:
- Top 25 Jobs by Potential Savings per Month
- Top 10 Jobs with Lowest Avg CPU Utilization
- Top 10 Jobs with Highest Avg Memory Utilization
- Jobs with Fixed Number of Workers Last 30 Days
- Jobs Running on Outdated DBR Version Last 30 Days
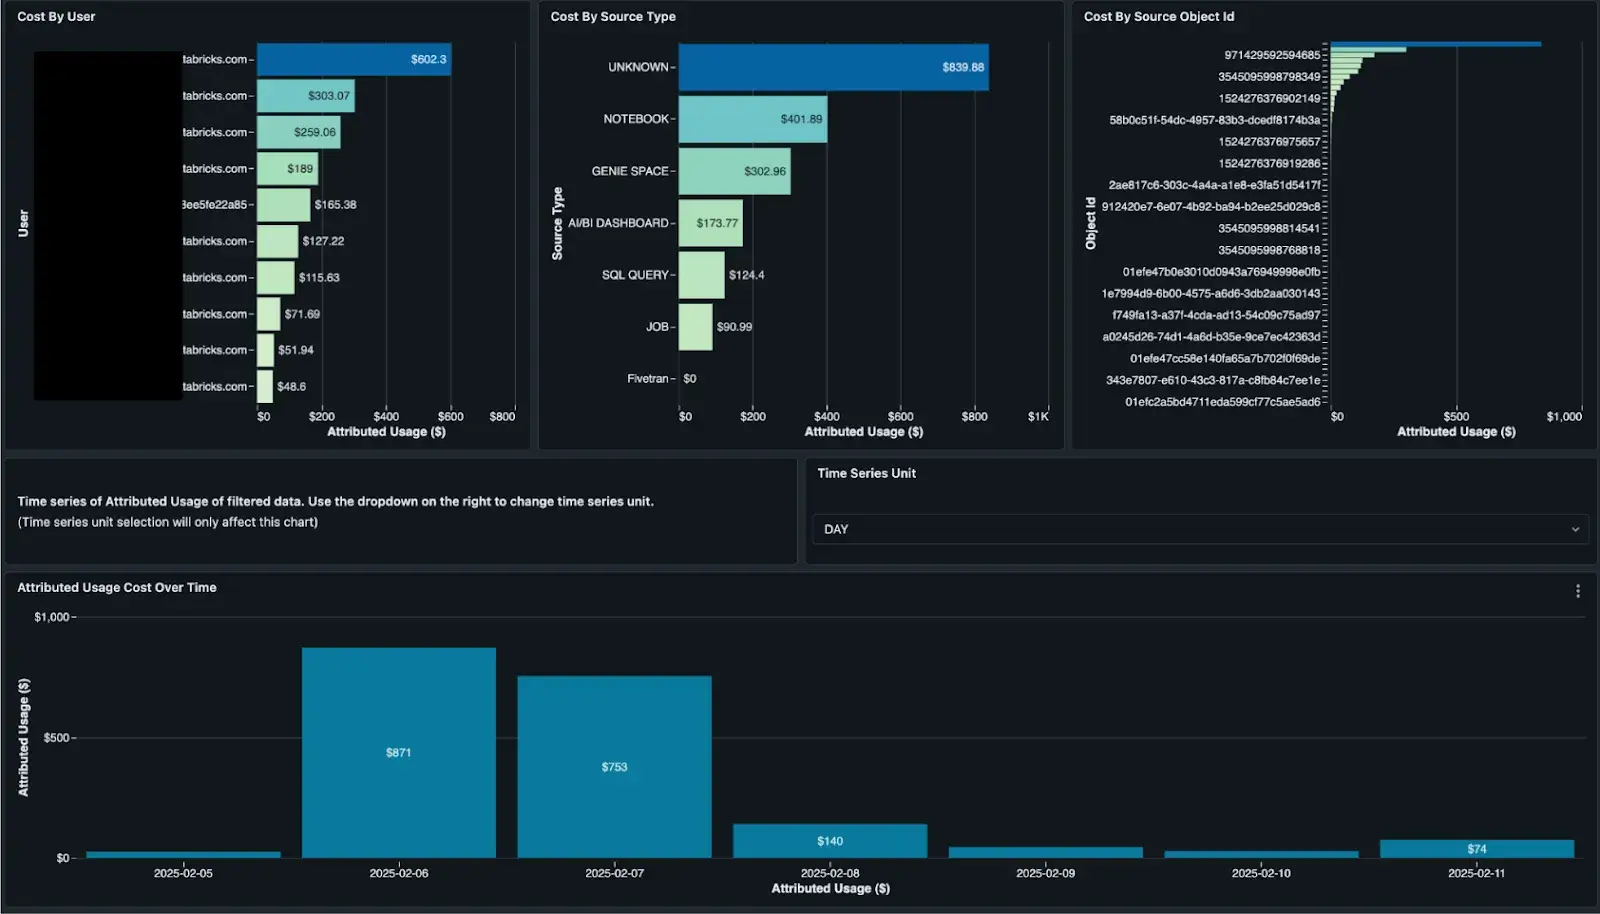
DBSQL Monitoring
For enhanced monitoring of Databricks SQL, refer to our SQL SME blog here. In this guide, our SQL experts will walk you through the Granular Cost Monitoring dashboard you can set up today to see SQL costs by user, source, and even query-level costs.
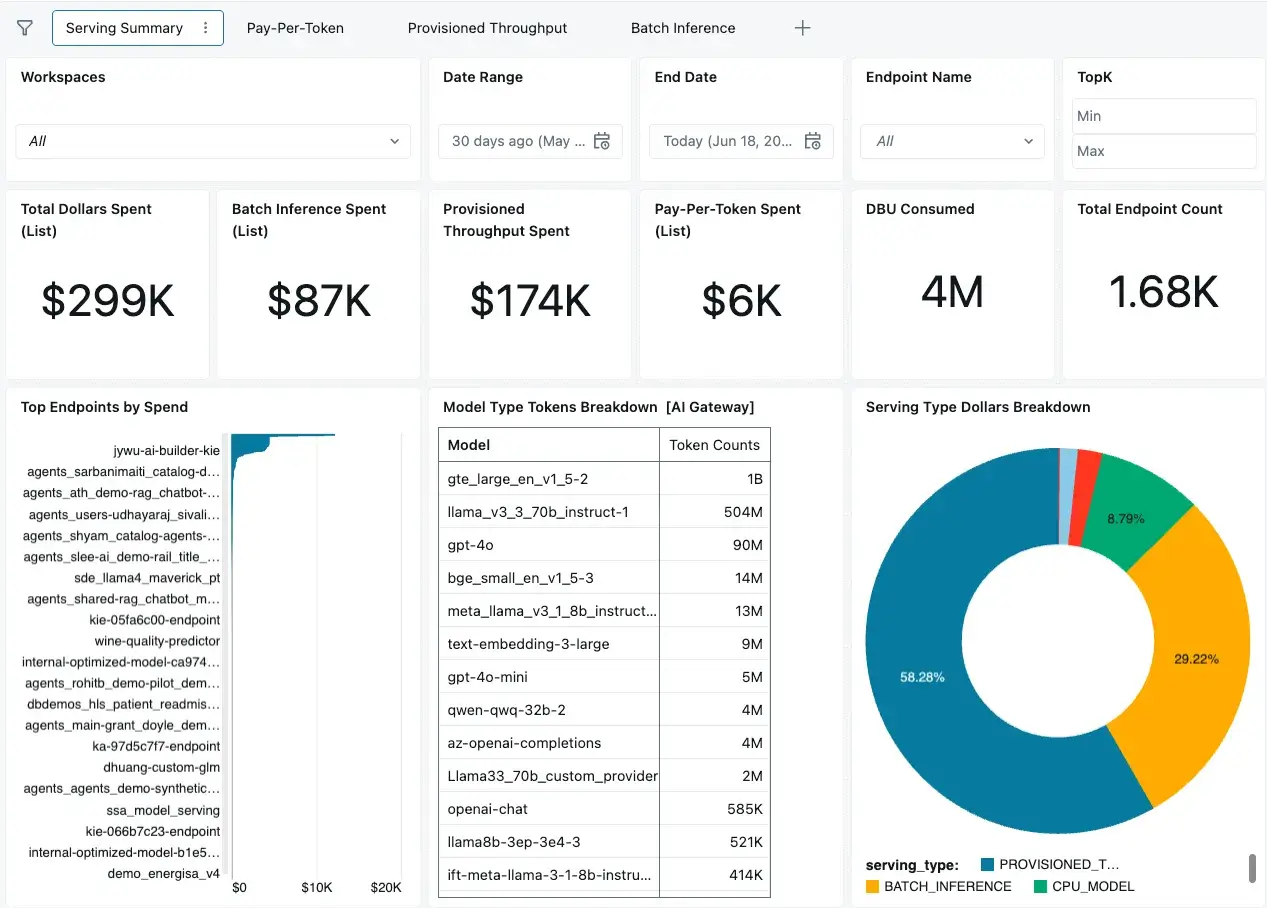
Model Serving
Likewise, we have a specialized dashboard for monitoring cost for Model Serving! This is helpful for more granular reporting on batch inference, pay-per-token usage, provisioned throughput endpoints, and more. For more information, see this related blog.
Budget Alerts
We talked about Serverless Budget Policies earlier as a way to attribute or tag serverless compute usage, but Databricks also has just a Budget (AWS | Azure | GCP), which is a separate feature. Budgets can be used to track account-wide spending, or apply filters to track the spending of specific teams, projects, or workspaces.
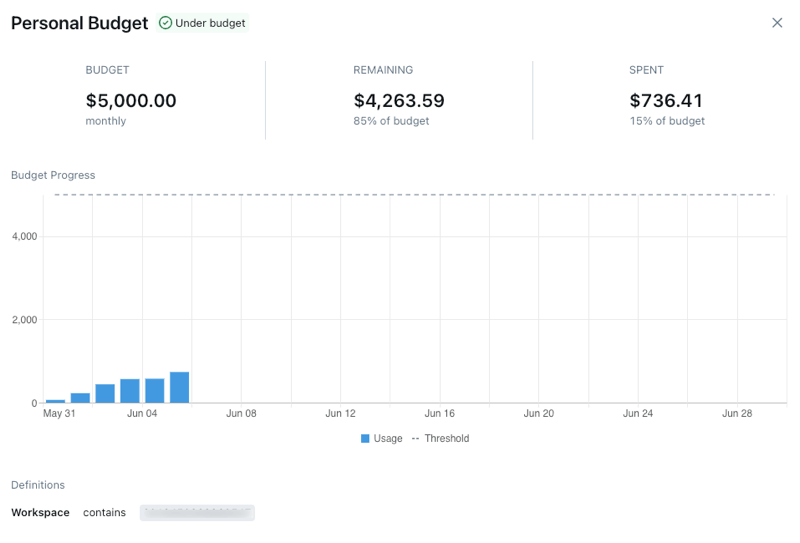
With budgets, you specify the workspace(s) and/or tag(s) you want the budget to match on, then set an amount (in USD), and you can have it email a list of recipients when the budget has been exceeded. This can be useful to reactively alert users when their spending has exceeded a given amount. Please note that budgets use the list price of the SKU.
Step 3: Cost Controls
Next, teams must have the ability to set guardrails for data teams to be both self-sufficient and cost-conscious at the same time. Databricks simplifies this for both administrators and practitioners with Compute Policies (AWS | Azure | GCP).
Several attributes can be controlled with compute policies, including all cluster attributes as well as important virtual attributes such as dbu_per_user. We’ll review a few of the key attributes to govern for cost control specifically:
Limiting DBU Per User and Max Clusters Per User
Often, when creating compute policies to enable self-service cluster creation for teams, we want to control the maximum spending of those users. This is where one of the most important policy attributes for cost control applies: dbus_per_hour.
dbus_per_hour can be used with a range policy type to set lower and upper bounds on DBU cost of clusters that users are able to create. However, this only enforces max DBU per cluster that uses the policy, so a single user with permission to this policy could still create many clusters, and each is capped at the specified DBU limit.
To take this further, and prevent an unlimited number of clusters being created by each user, we can use another setting, max_clusters_by_user, which is actually a setting on the top-level compute policy rather than an attribute you would find in the policy definition.
Control All-Purpose vs. Job Clusters
Policies should enforce which cluster type it can be used for, using the cluster_type virtual attribute, which can be one of: “all-purpose”, “job”, or “dlt”. We recommend using fixed type to enforce exactly the cluster type that the policy is designed for when writing it:
A common pattern is to create separate policies for jobs and pipelines versus all-purpose clusters, setting max_clusters_by_user to 1 for all-purpose clusters (e.g., how Databricks’ default Personal Compute policy is defined) and allowing a higher number of clusters per user for jobs.
Enforce Instance Types
VM instance types can be conveniently controlled with allowlist or regex type. This allows users to create clusters with some flexibility in the instance type without being able to choose sizes that may be too expensive or outside their budget.
Enforce Latest Databricks Runtimes
It’s important to stay up-to-date with newer Databricks Runtimes (DBRs), and for extended support periods, consider Long-Term Support (LTS) releases. Compute policies have several special values to easily enforce this in the spark_version attribute, and here are just a few of those to be aware of:
auto:latest-lts:Maps to the latest long-term support (LTS) Databricks Runtime version.auto:latest-lts-ml:Maps to the latest LTS Databricks Runtime ML version.- Or
auto:latestandauto:latest-mlfor the latest Generally Available (GA) Databricks runtime version (or ML, respectively), which may not be LTS.- Note: These options may be useful if you need access to the latest features before they reach LTS.
We recommend controlling the spark_version in your policy using an allowlist type:
Spot Instances
Cloud attributes can also be controlled in the policy, such as enforcing instance availability of spot instances with fallback to on-demand. Note that whenever using spot instances, you should always configure the “first_on_demand” to at least 1 so the driver node of the cluster is always on-demand.
On AWS:
On Azure:
On GCP (note: GCP cannot currently support the first_on_demand attribute):
Enforce Tagging
As seen earlier, tagging is crucial to an organization’s ability to allocate cost and report it at granular levels. There are two things to consider when enforcing consistent tags in Databricks:
- Compute policy controlling the
custom_tags.attribute. - For serverless, use Serverless Budget Policies as we discussed in Step 1.
In the compute policy, we can control multiple custom tags by suffixing them with the tag name. It is recommended to use as many fixed tags as possible to reduce manual input on users, but allowlist is excellent for allowing multiple choices yet keeping values consistent.
Query Timeout for Warehouses
Long-running SQL queries can be very expensive and even disrupt other queries if too many begin to queue up. Long-running SQL queries are usually due to unoptimized queries (poor filters or even no filters) or unoptimized tables.
Admins can control for this by configuring the Statement Timeout at the workspace level. To set a workspace-level timeout, go to the workspace admin settings, click Compute, then click Manage next to SQL warehouses. In the SQL Configuration Parameters setting, add a configuration parameter where the timeout value is in seconds.
Model Rate Limits
ML models and LLMs can also be abused with too many requests, incurring unexpected costs. Databricks provides usage tracking and rate limits with an easy-to-use AI Gateway on model serving endpoints.
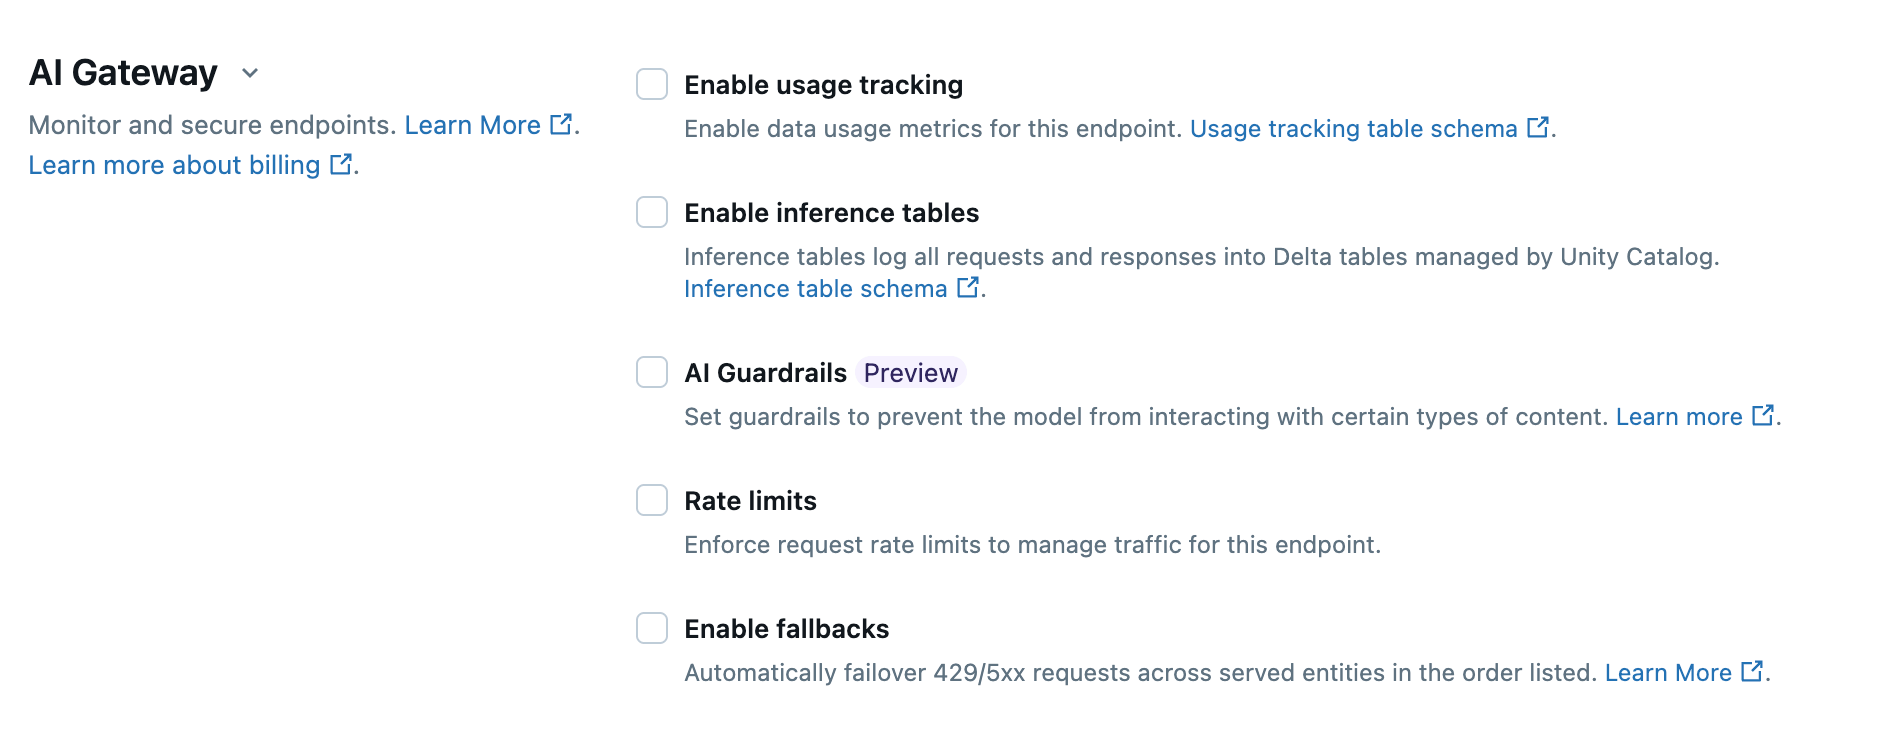
You can set rate limits on the endpoint as a whole, or per user. This can be configured with the Databricks UI, SDK, API, or Terraform; for example, we can deploy a Foundation Model endpoint with a rate limit using Terraform:
Practical Compute Policy Examples
For more examples of real-world compute policies, see our Solution Accelerator here: https://github.com/databricks-industry-solutions/cluster-policy
Step 4: Cost Optimization
Lastly, we will look at some of the optimizations you can check for in your workspace, clusters, and storage layers. Most of these can be checked and/or implemented automatically, which we’ll explore. Several optimizations take place at the compute level. These include actions such as right-sizing the VM instance type, knowing when to use Photon or not, appropriate selection of compute type, and more.
Choosing Optimal Resources
- Use job compute instead of all-purpose (we’ll cover this more in depth next).
- Use SQL warehouses for SQL-only workloads for the best cost-efficiency.
- Use up-to-date runtimes to receive latest patches and performance improvements. For example, DBR 17.0 takes the leap to Spark 4.0 (Blog) which includes many performance optimizations.
- Use Serverless for quicker startup, termination, and better total cost of ownership (TCO).
- Use autoscaling workers, unless using continuous streaming or the AvailableNow trigger.
- Choose the correct VM instance type:
- Newer generation instance types and modern processor architectures usually perform better and often at lower cost. For example, on AWS, Databricks prefers Graviton-enabled VMs (e.g. c7g.xlarge instead of c7i.xlarge); these may yield up to 3x better price-to-performance (Blog).
- Memory-optimized for most ML workloads. E.g., r7g.2xlarge
- Compute-optimized for streaming workloads. E.g., c6i.4xlarge
- Storage-optimized for workloads that benefit from disk caching (ad hoc and interactive data analysis). E.g., i4g.xlarge and c7gd.2xlarge.
- Only use GPU instances for workloads that use GPU-accelerated libraries. Furthermore, unless performing distributed training, clusters should be single node.
- General purpose otherwise. E.g., m7g.xlarge.
- Use Spot or Spot Fleet instances in lower environments like Dev and Stage.
Avoid running jobs on all-purpose compute
As mentioned in Cost Controls, cluster costs can be optimized by running automated jobs with Job Compute, not All-Purpose Compute. Exact pricing may depend on promotions and active discounts, but Job Compute is typically 2-3x cheaper than All-Purpose.
Job Compute also provides new compute instances each time, isolating workloads from one another, while still permitting multitask workflows to reuse the compute resources for all tasks if desired. See how to configure compute for jobs (AWS | Azure | GCP).
Using Databricks System tables, the following query can be used to find jobs running on interactive All-Purpose clusters. This is also included as part of the Jobs System Tables AI/BI Dashboard you can easily import to your workspace!
Monitor Photon for All-Purpose Clusters and Continuous Jobs
Photon is an optimized vectorized engine for Spark on the Databricks Data Intelligence Platform that provides extremely fast query performance. Photon increases the amount of DBUs the cluster costs by a multiple of 2.9x for job clusters, and approximately 2x for All-Purpose clusters. Despite the DBU multiplier, Photon can yield a lower overall TCO for jobs by reducing the runtime duration.
Interactive clusters, on the other hand, may have significant amounts of idle time when users are not running commands; please ensure all-purpose clusters have the auto-termination setting applied to minimize this idle compute cost. While not always the case, this may result in higher costs with Photon. This also makes Serverless notebooks a great fit, as they minimize idle spend, run with Photon for the best performance, and can spin up the session in just a few seconds.
Similarly, Photon isn’t always beneficial for continuous streaming jobs that are up 24/7. Monitor whether you are able to reduce the number of worker nodes required when using Photon, as this lowers TCO; otherwise, Photon may not be a good fit for Continuous jobs.
Note: The following query can be used to find interactive clusters that are configured with Photon:
Optimizing Data Storage and Pipelines
There are too many strategies for optimizing data, storage, and Spark to cover here. Fortunately, Databricks has compiled these into the Comprehensive Guide to Optimize Databricks, Spark and Delta Lake Workloads, covering everything from data layout and skew to optimizing delta merges and more. Databricks also provides the Big Book of Data Engineering with more tips for performance optimization.
Real-World Application
Organization Best Practices
Organizational structure and ownership best practices are just as important as the technical solutions we will go through next.
Digital natives running highly effective FinOps practices that include the Databricks Platform usually prioritize the following within the organization:
- Clear ownership for platform administration and monitoring.
- Consideration of solution costs before, during, and after projects.
- Culture of continuous improvement–always optimizing.
These are some of the most successful organization structures for FinOps:
- Centralized (e.g., Center of Excellence, Hub-and-Spoke)
- This may take the form of a central platform or data team responsible for FinOps and distributing policies, controls, and tools to other teams from there.
- Hybrid / Distributed Budget Centers
- Dispurses the centralized model out to different domain-specific teams. May have one or more admins delegated to that domain/team to align larger platform and FinOps practices with localized processes and priorities.
Center of Excellence Example
A center of excellence has many benefits, such as centralizing core platform administration and empowering business units with safe, reusable assets such as policies and bundle templates.
The center of excellence often puts teams such as Data Platform, Platform Engineer, or Data Ops teams at the center, or “hub,” in a hub-and-spoke model. This team is responsible for allocating and reporting costs with the Usage Dashboard. To deliver an optimal and cost-aware self-service environment for teams, the platform team should create compute policies and budget policies that tailor to use cases and/or business units (the ”spokes”). While not required, we recommend managing these artifacts with Terraform and VCS for strong consistency, versioning, and ability to modularize.
Key Takeaways
This has been a fairly exhaustive guide to help you take control of your costs with Databricks, so we have covered several things along the way. To recap, the crawl-walk-run journey is this:
- Cost Attribution
- Cost Reporting
- Cost Controls
- Cost Optimization
Finally, to recap some of the most important takeaways:
- Solid tagging is the foundation of all good cost attribution and reporting. Use Compute Policies to enforce high-quality tags.
- Import the Usage Dashboard for your main stop when it comes to reporting and forecasting Databricks spending.
- Import the Jobs System Tables AI/BI Dashboard to monitor and find jobs with cost-saving opportunities.
- Use Compute Policies to enforce cost controls and resource limits on cluster creations.
Next Steps
Get started today and create your first Compute Policy, or use one of our policy examples. Then, import the Usage Dashboard as your main stop for reporting and forecasting Databricks spending. Check off optimizations from Step 3 we shared earlier for your clusters, workspaces, and data. Check off optimizations from Step 3 we shared earlier for your clusters, workspaces, and data.
Databricks Delivery Solutions Architects (DSAs) accelerate Data and AI initiatives across organizations. They provide architectural leadership, optimize platforms for cost and performance, enhance developer experience, and drive successful project execution. DSAs bridge the gap between initial deployment and production-grade solutions, working closely with various teams, including data engineering, technical leads, executives, and other stakeholders to ensure tailored solutions and faster time to value. To benefit from a custom execution plan, strategic guidance, and support throughout your data and AI journey from a DSA, please contact your Databricks Account Team.
Get the latest posts in your inbox
Subscribe to our blog and get the latest posts delivered to your inbox.