Tutorial: 3 Free Databricks Analytics Projects You Can Do In An Afternoon
A hands-on introduction to Databricks Free Edition through three real, portfolio-ready analytics projects—complete with data, dashboards, SQL, and AI-powered insights.
- Three beginner-friendly analytics projects you can complete in an afternoon using Databricks Free Edition, no credit card required.
- How to import and analyze public datasets using AI/BI dashboards, natural language queries, AI functions, and light ML forecasting.
- Practical, portfolio-ready examples (dashboards + code) that help students, job-seekers, and BI users build real analytics artifacts they can showcase.
Want a real analytics project you can share publicly, talk about in interviews, or add to your resume or portfolio, all without needing a credit card?
Databricks Free Edition gives students, young professionals, and the AI-curious access to the same data+AI tools used at leading companies, with the right amount of compute for personal projects, and Databricks’ AI/BI dashboard and analytics tools are a great place to start. This blog will walk through bringing in some public datasets to slice and dice, build a polished dashboard, and tell a clear story about the trends and insights hidden within.
Whether you’re a spreadsheet power-user looking to level up with SQL and Python, or an experienced BI engineer experimenting with AI-powered analytics, these projects are designed to help you build something tangible, fast. If you want to go deeper, you can explore Databricks’ free self-paced AI/BI training, in-depth AI/BI author courses, or join a live free onboarding session. You can also access dozens of other installable public demos here.
Setup
If you don’t already have an account, you can sign up for Databricks Free Edition here, no credit card or phone number required. You get access to Databricks for free, perpetually, for experimentation and learning with Databricks Free Edition. Note: Free Edition is for personal use, not for production or commercial use. If you’re looking for a production-grade, fully supported data platform for your business, reach out to Databricks here.
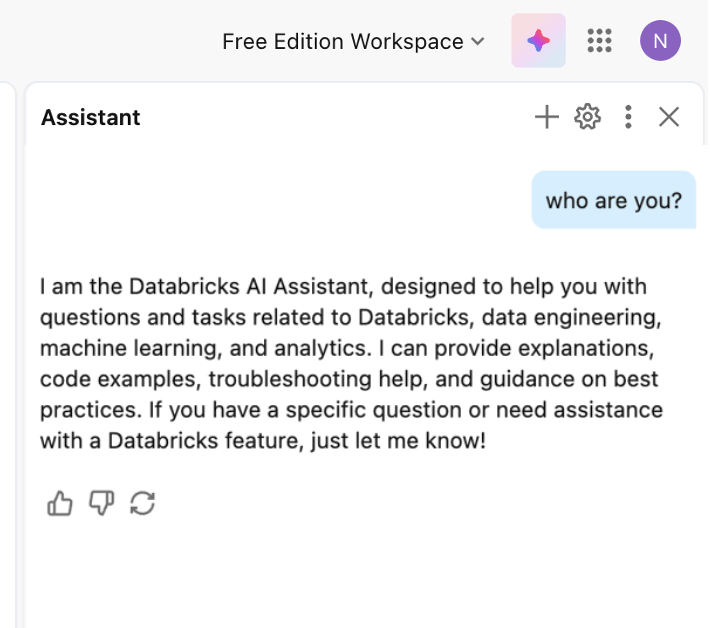
One last tip before you start: if you hit errors or get stuck at any point, Databricks Assistant (the purple diamond in the upper-right corner) is incredibly helpful for debugging, generating SQL, and explaining concepts as you go.
With the setup out of the way, let’s dive in!
1. Analyze a (simulated) Cookie Bakery
We’ll start with an easy warm-up. For a small business, keeping a pulse on the operations and trends is critical for success. A small business owner might be looking for insights like finding the best-selling product, asking what the best-performing locations are, or forecasting what sales might look like next year.
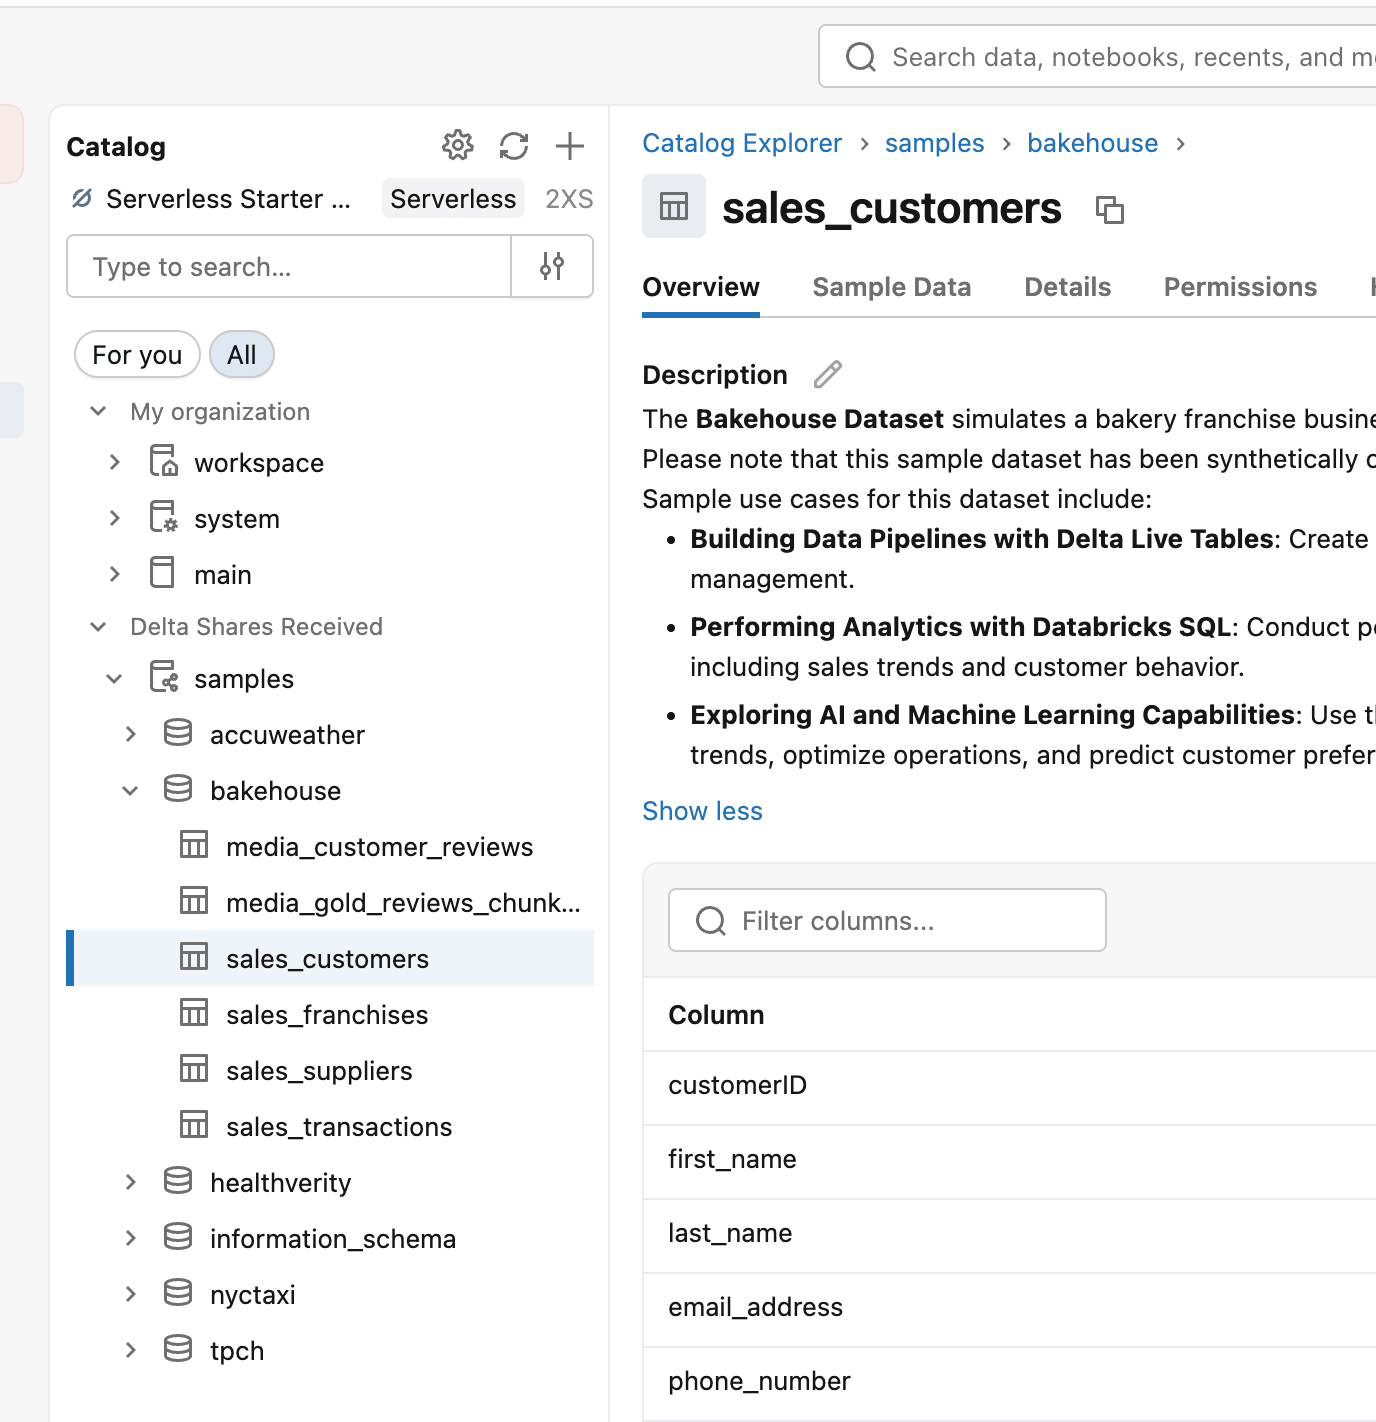
Every Databricks workspace comes with a pre-installed set of sample data under the ‘samples’ catalog, which is a great starting point for experimenting with new features. The ‘bakehouse’ simulated dataset of suppliers, reviews, and transactions specifically is a good place to practice telling a story about how ‘our’ small business is performing. You can find the dataset under the ‘catalog’ portion in the left menu sidebar of Databricks, which is the core of every workspace and lets you explore datasets available for analysis.
In this case you can expand the ‘samples’ catalog and ‘bakehouse’ schema to find the data.
To get started, create a fresh dashboard by clicking ‘new->Dashboard’ in the upper left corner of the workspace, then under the dashboard’s ‘data’ tab, select from one of the tables by using SQL like below (or pick it from the UI table picker):
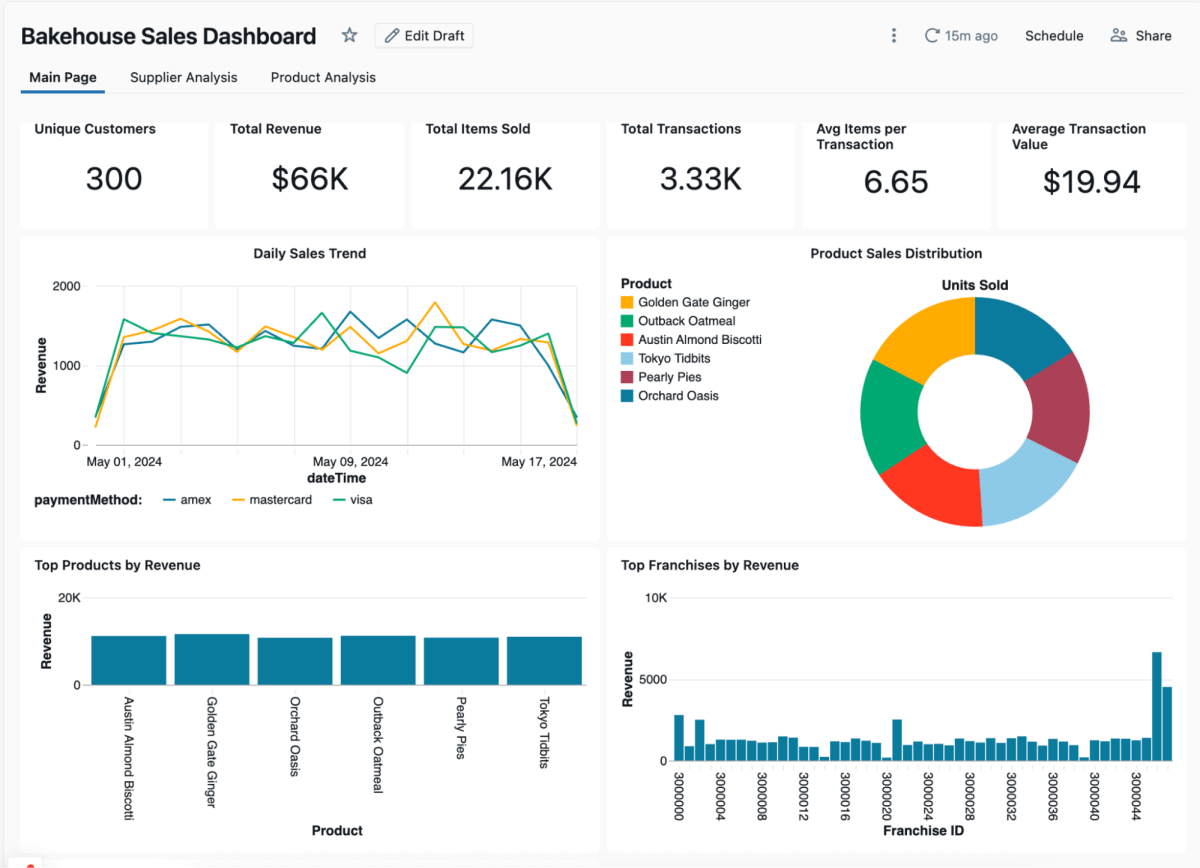
On the dashboard canvas, add visualizations and text that help you tell a clear story. For example, you might use pie charts for composition (such as product mix), line charts for trends (like sales over time), and counters to highlight key numbers, like total transactions or revenue.
The Bakehouse dataset also includes simulated customer reviews, which makes it a great place to try out AI-assisted analysis using the AI_Query() function. This creates a new dataset by applying an AI model directly to your data — in this case, classifying each review as positive, negative, or neutral. You might also modify the prompt to generate an auto-reply for each review (and you may want to experiment by asking for different tones of voice).
Next-level Challenge: Can you find a way to apply another AI function like ai_classify() or ai_gen()? Can you tweak the AI_Query() prompt to make dashboard commentary for you? Or automatic replies to the reviews? Can you go all the way and build an agent to auto-generate marketing copy based on the top reviews, like Kasey Uhlenhuth did at Data & AI Summit 2024?
2. Predict Your Rent
Housing data is often a great place to stretch your analytics muscle — there are many strong correlations to find, like weather and interest rates, and there’s a plethora of high-quality data released by official (often government) sources. For a couple of examples, Zillow Research’s open datasets offer great USA housing data, while the UK government’s Office for National Statistics provides high-quality census data. Common analysis questions are things like ‘Which state/province has the highest growth rates?’, ‘Where is the most new construction?’, or ‘What’s the relationship between housing costs and interest rates?’
My personal favourite is a ‘rental asking price’ dataset from the Government of Canada’s Open Government portal, which contains a set of advertised rents with attributes like year, metropolitan area, number of bedrooms, etc. I find that the way the data has years laid out as individual rows makes it easy to filter and analyze.
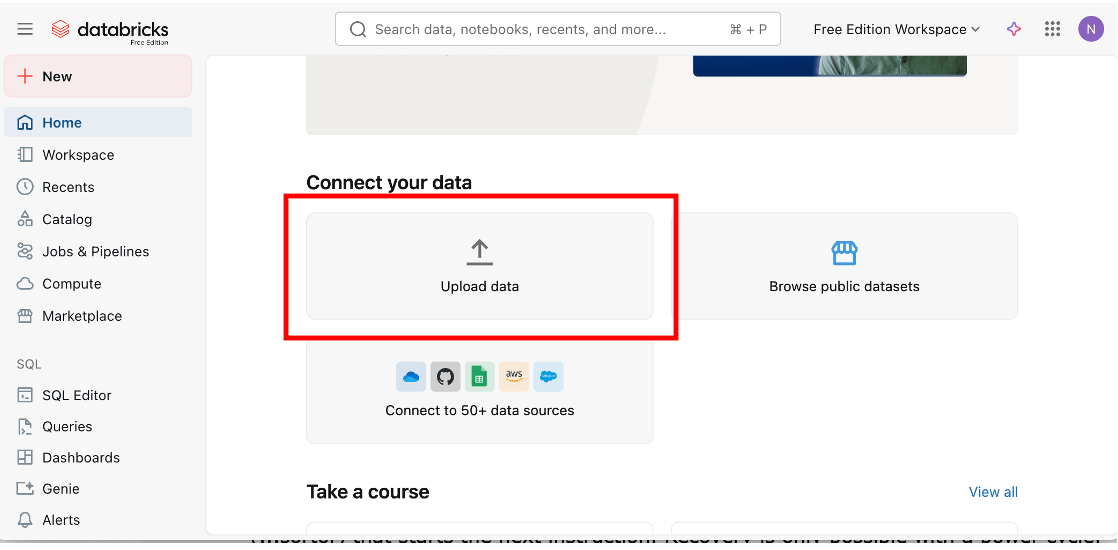
To get the data into your workspace, download the dataset from the portal, extract the data file from the zip (‘46100092.csv’), then hit the ‘upload data’ button on your workspace home page to work through a small wizard on parsing the CSV format into a table.
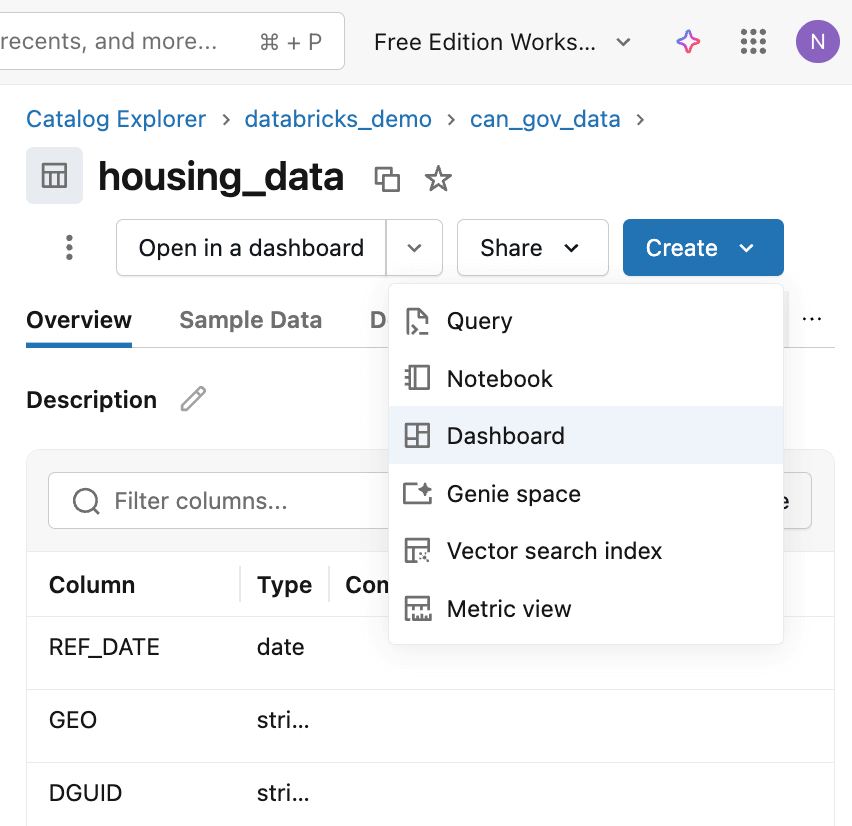
By default, it will name the resulting table the same as the technically-named file, so keep an eye out for a chance to rename it to something meaningful like ‘Housing_data’. Once it’s created, use the ‘catalog’ section of the workspace to find it and then create a dashboard using the ‘create’ button to get one that’s pre-populated with a skeleton around the dataset.
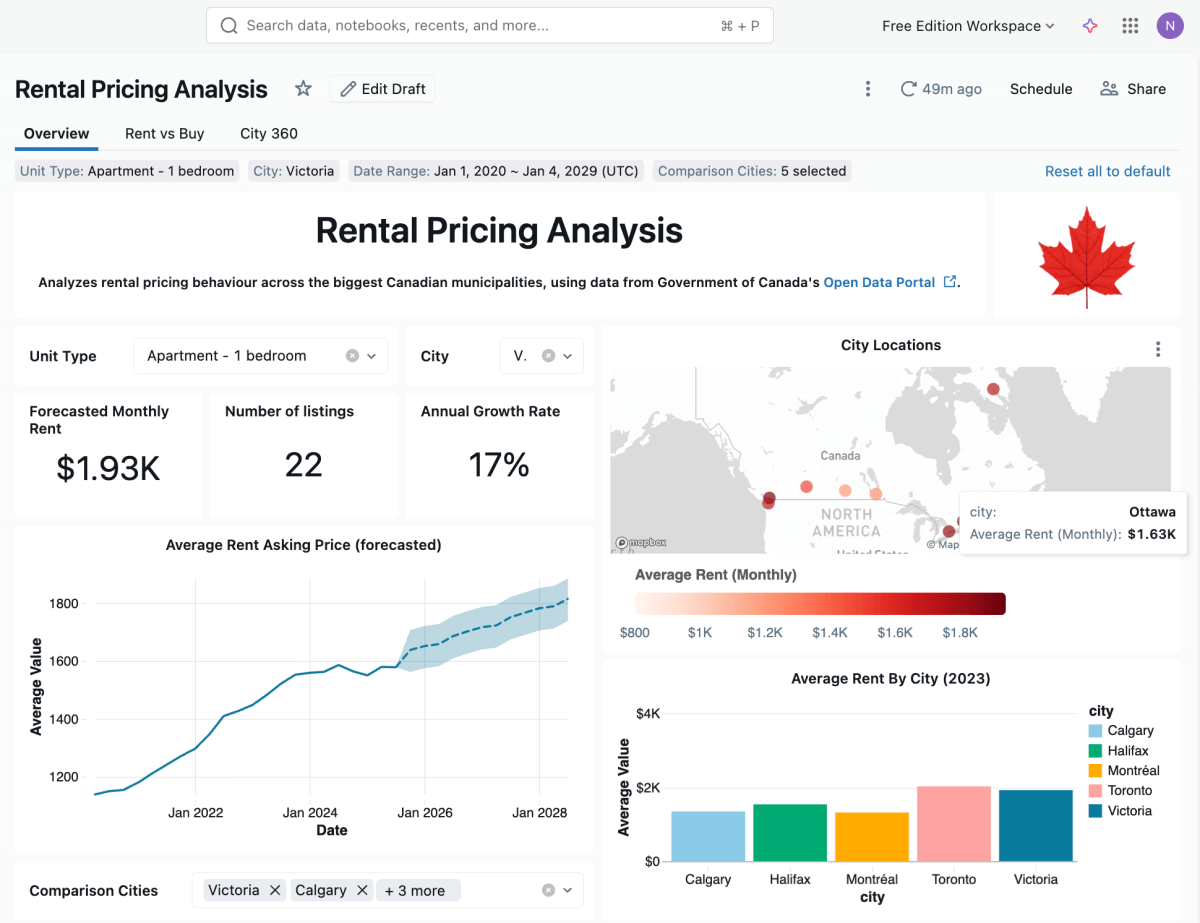
To enhance the starter dashboard, you could add other slices and comparisons that add context and colour to the analysis. You might consider comparing average rents or growth in other cities, or examining the ratio of one-bedroom units to other housing types. What’s the most expensive city? Remember to also add filters so users can focus down on their specific cities or unit types of interest.
In some cases, you may need to write a different SQL query or incorporate other data; remember that Databricks Assistant (purple diamond in the upper right corner) can be helpful. In my example, I asked Assistant to add latitude/longitude for the cities so I could build the map view.
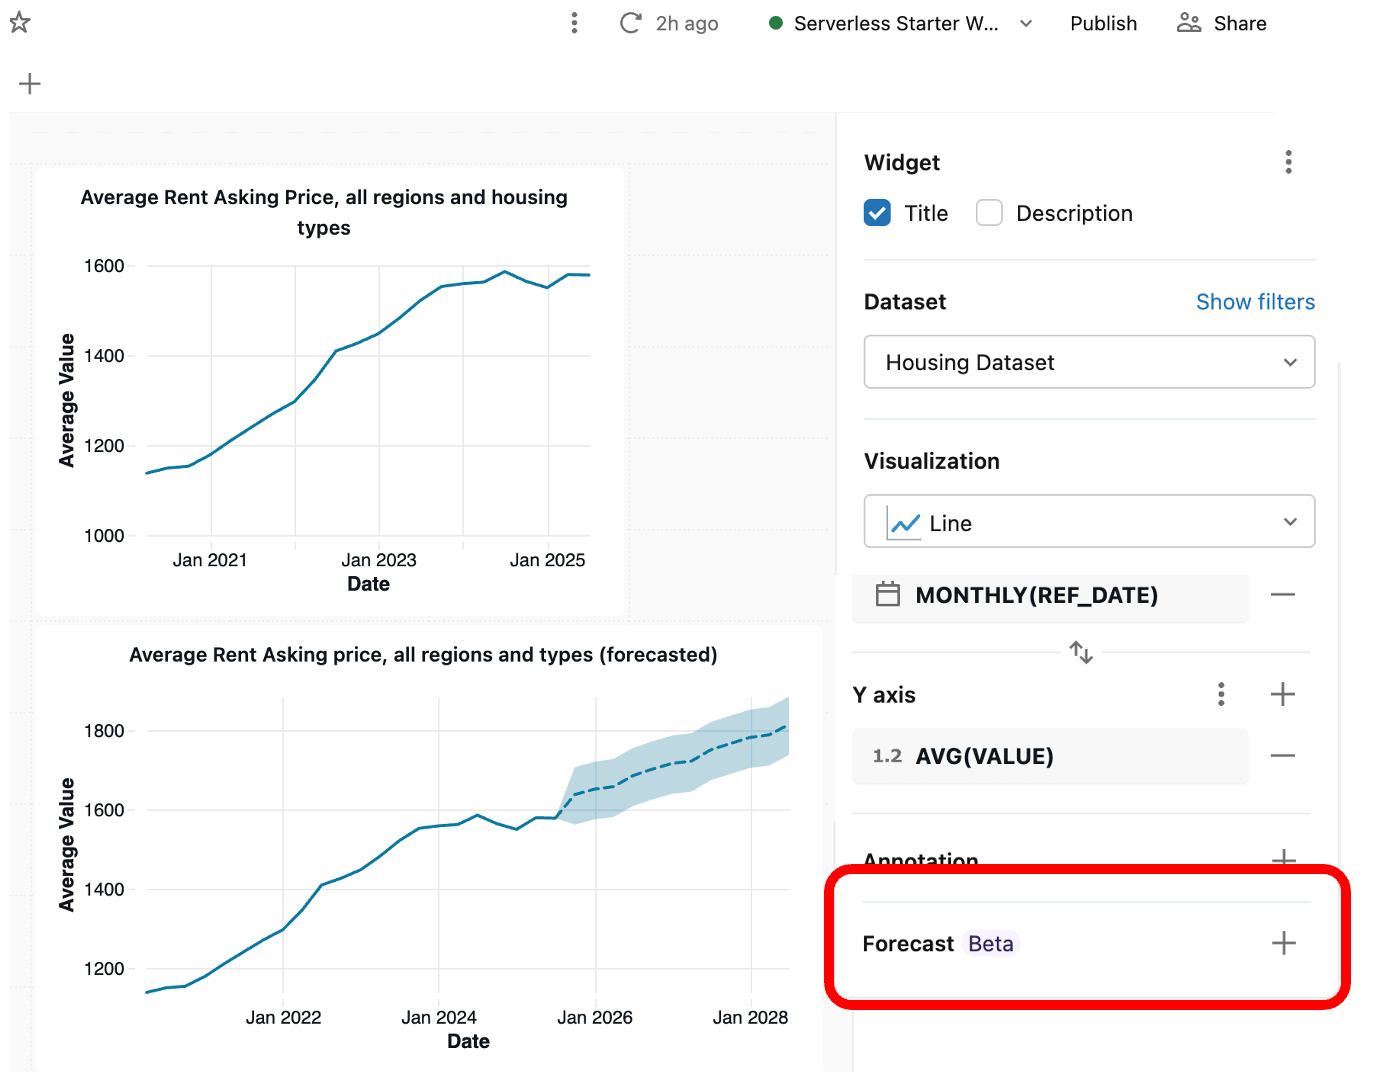
To generate a prediction, start with a regular line chart that has the x-axis as reference date and asking price (value) as y-axis, Then look for the ‘add forecast’ button in the side bar. This will add a new forecast visualization to your dashboard canvas, built on a new sql dataset with Databricks’ ‘AI_Forecast()’ sql function that calls a time-series ML model and applies it to your data. This beta feature is still evolving (we’d love to hear feedback!), but it’s still a helpful launching point for applying ML to a real-world use-case. Remember too that Databricks Assistant can always help you craft your own custom SQL for new datasets.
Next-level challenge: While AI_Forecast() is great for a quick reference prediction, a more accurate one would involve combining other data points and applying a custom machine learning algorithm — you can see what a complete solution of that would look like (in this case, predicting wind turbine maintenance) in our Databricks demos site.
3. Find a Movie Shoot to Observe
In cities that are frequently used as a film backdrop, you might be lucky enough to stumble upon film trucks, production assistants, and small directors' booths around historic buildings or picturesque parts of town. Before movie productions can block off public property for these shoots, they must obtain filming permits, which are then published in open datasets by government agencies.
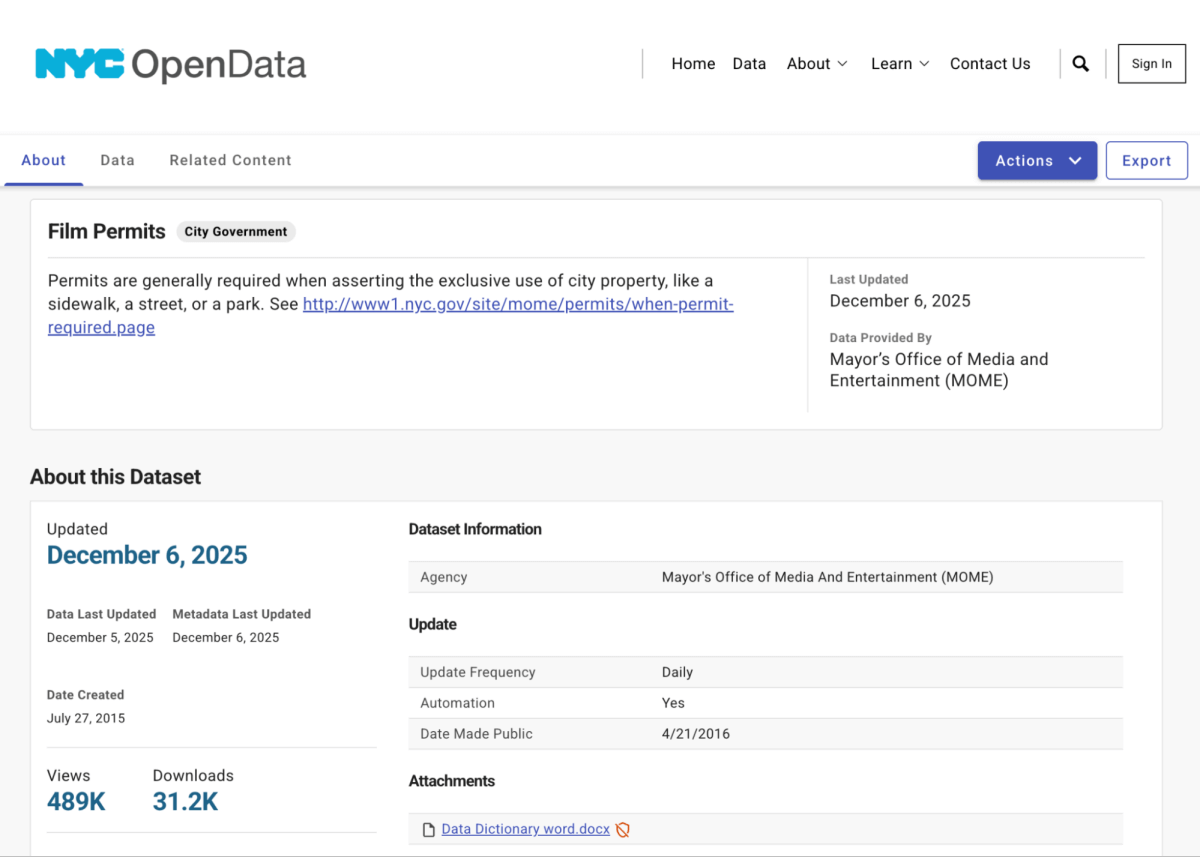
While it doesn’t have future-looking permits, one of the best examples of this kind of dataset is the City of New York’s Open Data Portal listing for film permits. It lists the type of shoot (i.e, news, feature film, or series) along with the start and end time of the shoot, borough, and zip code. By slicing and dicing the dataset, you can identify the most common locations and hopefully catch a peek of a star at work.
Like the earlier examples, we have to start by loading the data into Databricks. NYC’s open data portal allows you to easily download the .csv and import it via the ‘upload data’ in the UI like we did for the previous exercises. However, one interesting feature of this dataset is that it’s updated daily. Let’s grab that data programmatically so we could run it on a schedule. That’s much closer to how you might approach it in an enterprise context.
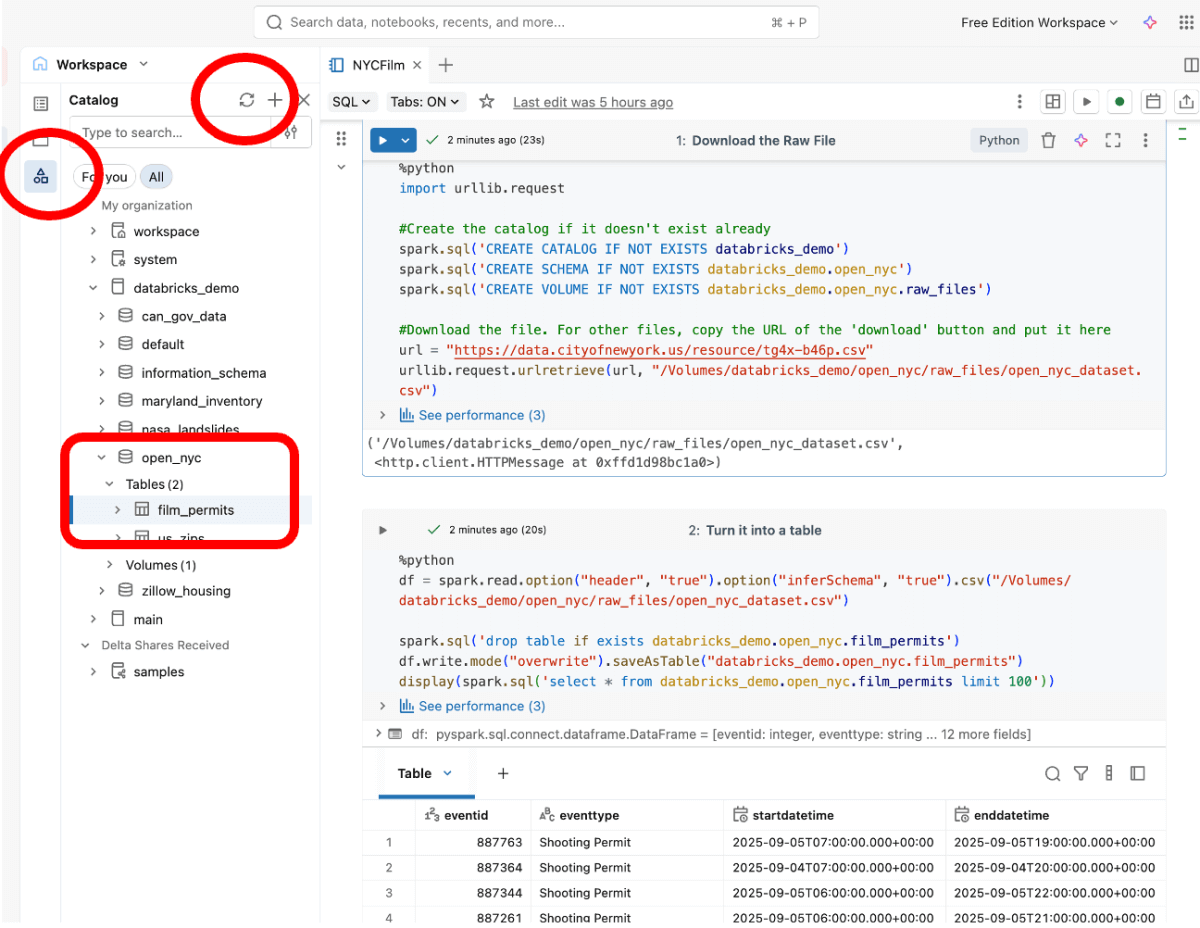
Databricks makes it really easy to run the Python we need via Notebooks. In this case, create a notebook (new->notebook in the upper left corner), copy and paste the code below, and hit run to download the CSV in your workspace and parse it into a table. Remember that if you hit issues, you can always use Databricks Assistant (via the purple diamond) to help!
This first piece of code creates a Volume (a place to store arbitrary files) and then downloads the dataset using the Python URLLib library. Feel free to modify the catalog+schema names to suit your style!
This second piece of code takes the raw file and creates a table called ‘film_permits’ we can use in our dashboard. Try asking Assistant to explain it if you need to.
If it worked successfully, you should be able to find the table via the catalog portion of the workspace or by opening the data explorer sidebar (three shape icon) in the notebook, and then expanding the databricks_demo catalog and open_nyc schema to see the table. You may need to hit the ‘refresh’ button if you already had it open.
Reminder: If you encounter any issues with the code, remember that you can always abandon the code approach and import the data manually by downloading it from the portal and uploading it via the ‘Upload Data’ button on your workspace home page.
Once you have the table loaded, it’s time to slice and dice and present a story! You might want to check trends with a line chart - are there more shoots for series or feature films? Is that changing over time? Or you might think about distribution with a bar or pie chart - do news or commercial filming locations overlap much with movies?
If you try and build a map viz, you may notice that while the film permits have a zip code, the AI/BI dashboard map visualization requires latitude and longitude attributes. Luckily, zip<>coordinate mapping datasets are easy to find online and can be brought into the dashboard using Assistant. You could download this open dataset (licensed under Creative Commons) and then create a new dataset on your dashboard, asking Assistant to generate a combined query. Here’s the prompt that I used (adjust for your specific catalog and table names):
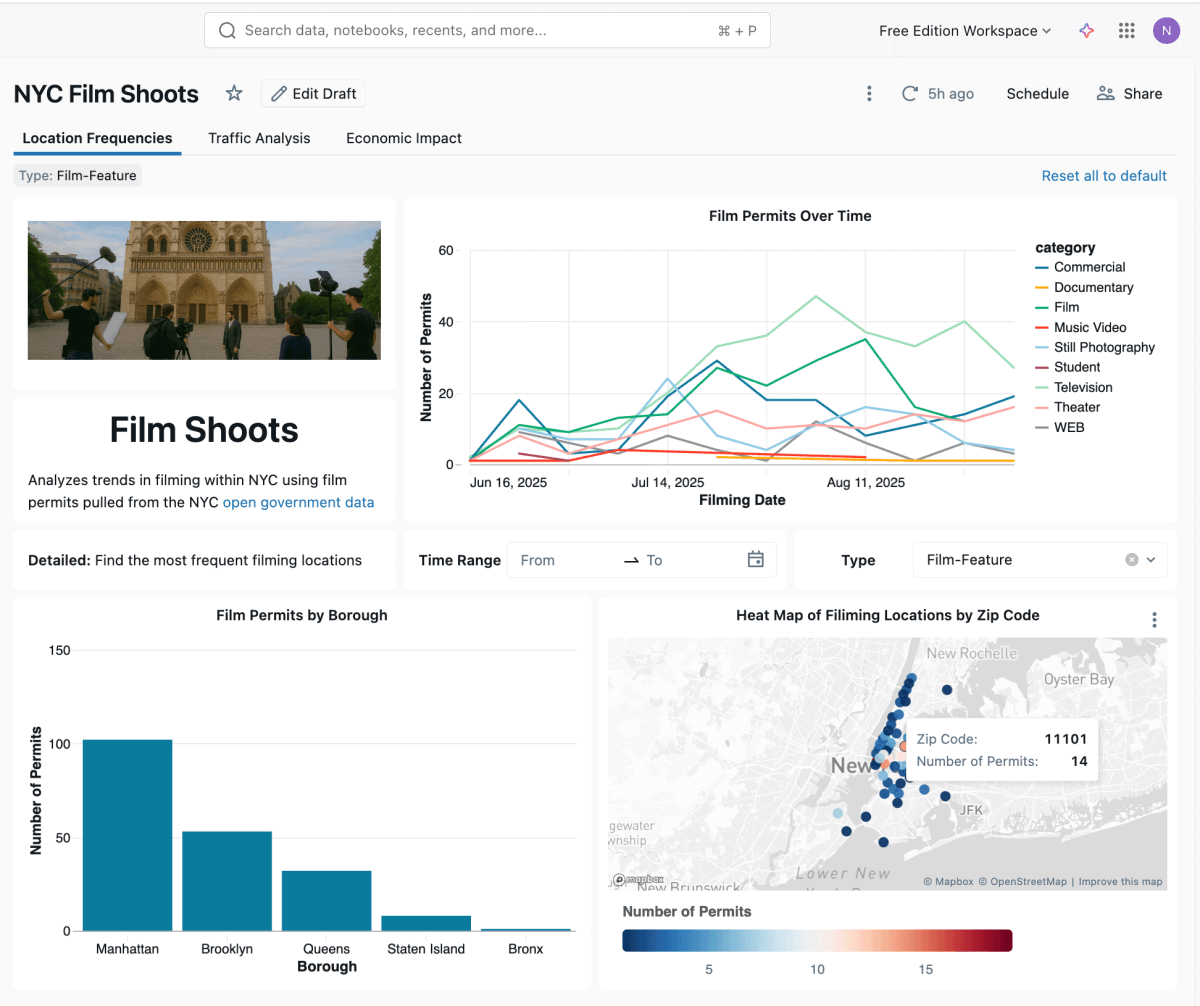
And here’s a version of what your final dashboard could look like!
Challenge: What other data from OpenNYC could you overlay, maybe taxi or rideshare volumes? Significant landmarks? If you’re politically active, is there an analysis that would further your cause? Other cities and states offer similar open datasets, like Seattle’s Building Energy Benchmark dataset of emissions that might be closer to home for you.
Can you extend the geospatial analysis using Databricks native ‘ST Functions’, to look up closest other points?
Wrap up
My favourite part of analytics are the lightbulb moments you get while chasing curiosity, and I hope these examples sparked some ideas. If you want to learn more or decide to work towards a certification you can put on a resume, you can access Databricks’ free self-paced AI/BI overview training course here, a more in-depth author training course here, or join a free live onboarding class! The Databricks docs site is also a great place to reference for specific features
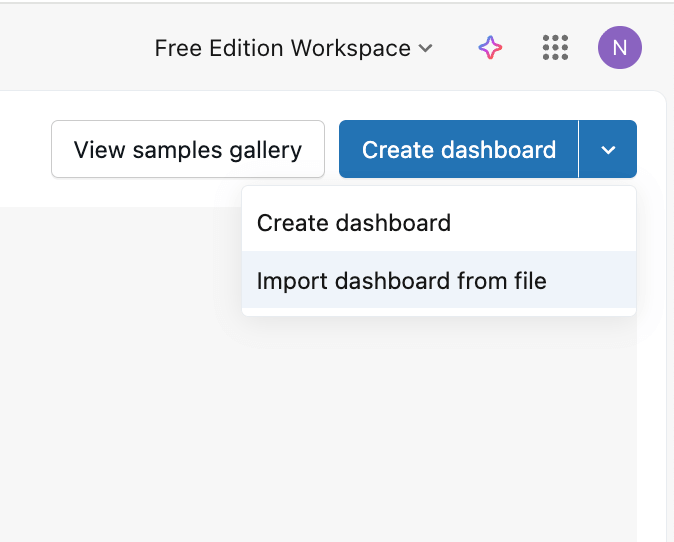
If you want to import any of the example dashboards in this blog, you can check out this repo for the source. AI/BI dashboard specs are just json, so download the file and import via the ‘import’ dropdown on the dashboards home page.
Lastly you can find dozens of installable demos ranging from ML to dashboarding to agentic AI in the Databricks Demo center. Give something new a try, or share what you’ve built with the Databricks community on your favourite social media platform. Happy hacking!
Start building with Databricks Free Edition
Spin up your free workspace—no credit card required—and turn these projects into portfolio-ready dashboards today.
Get the latest posts in your inbox
Subscribe to our blog and get the latest posts delivered to your inbox.