Introducing Streaming k-means in Apache Spark 1.2
Many real world data are acquired sequentially over time, whether messages from social media users, time series from wearable sensors, or — in a case we are particularly excited about — the firing of large populations of neurons. In these settings, rather than wait for all the data to be acquired before performing our analyses, we can use streaming algorithms to identify patterns over time, and make more targeted predictions and decisions.
One simple strategy is to build machine learning models on static data, and then use the learned model to make predictions on an incoming data stream. But what if the patterns in the data are themselves dynamic? That's where streaming algorithms come in.
A key advantage of Apache Spark is that its machine learning library (MLlib) and its library for stream processing (Spark Streaming) are built on the same core architecture for distributed analytics. This facilitates adding extensions that leverage and combine components in novel ways without reinventing the wheel. We have been developing a family of streaming machine learning algorithms in Spark within MLlib. In this post we describe streaming k-means clustering, included in the recently released Apache Spark 1.2.
k-means Algorithm
The goal of k-means is to partition a set of data points into k clusters. The now classic k-means algorithm — developed by Stephen Lloyd in the 1950s for efficient digital quantization of analog signals — iterates between two steps. First, given an initial set of k cluster centers, we find which cluster each data point is closest to. Then, we compute the average of each of the new clusters and use the result to update our cluster centers. At each of these steps — re-assigning and updating — we are making the points within each cluster more and more similar to one another (more formally, we are in both steps shrinking the within-cluster-sum-of-squares). By iterating between these two steps repeatedly, we can usually converge to a good solution.
[breadcrumb slug="image-1"]
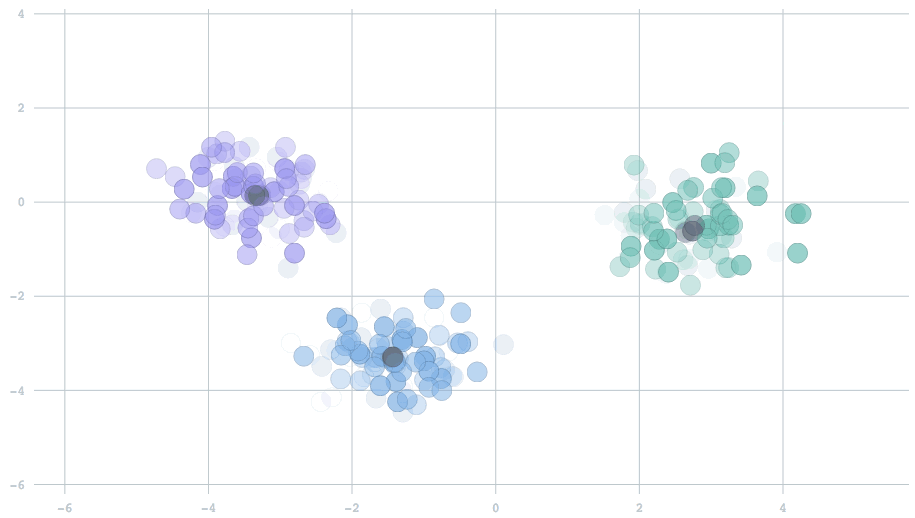
In the streaming setting, our data arrive in batches, with potentially many data points per batch. The simplest extension of the standard k-means algorithm would be to begin with cluster centers — usually random locations, because we haven't yet seen any data — and for each new batch of data points, perform the same two-step operation described above. Then, we use the new centers to repeat the procedure on the next batch. Above is a movie showing the behavior of this algorithm for two-dimensional data streaming from three clusters that are slowly drifting over time. The centers track the true clusters and adapt to the changes over time.
Forgetfulness
If the source of the data is constant — the same three clusters forever — the above streaming algorithm will converge to a similar solution as if k-means was run offline on the entire accumulated data set. In fact, in this case the streaming algorithm is identical to a well-known offline k-means algorithm, “mini-batch” k-means, which repeatedly trains on random subsets of the data to avoid loading the entire data set into memory.
However, what if the sources of data are changing over time? How can we make our model reflect those changes?
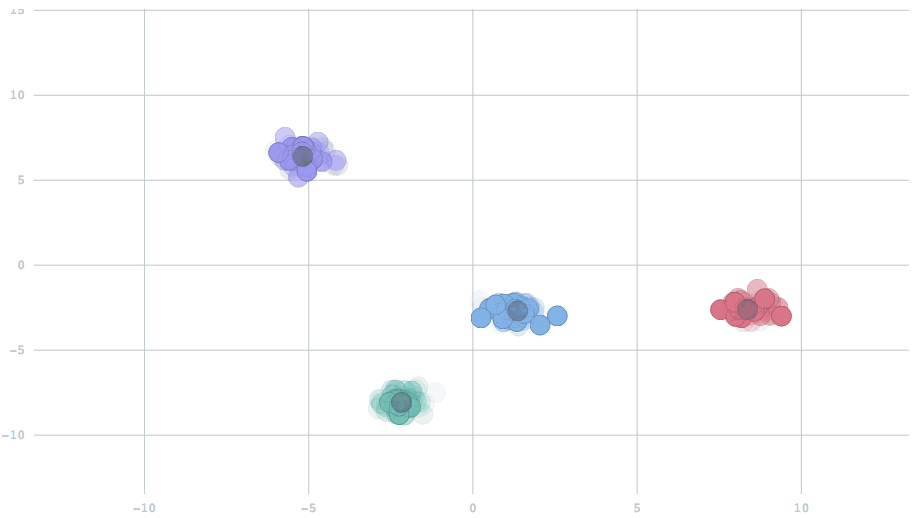
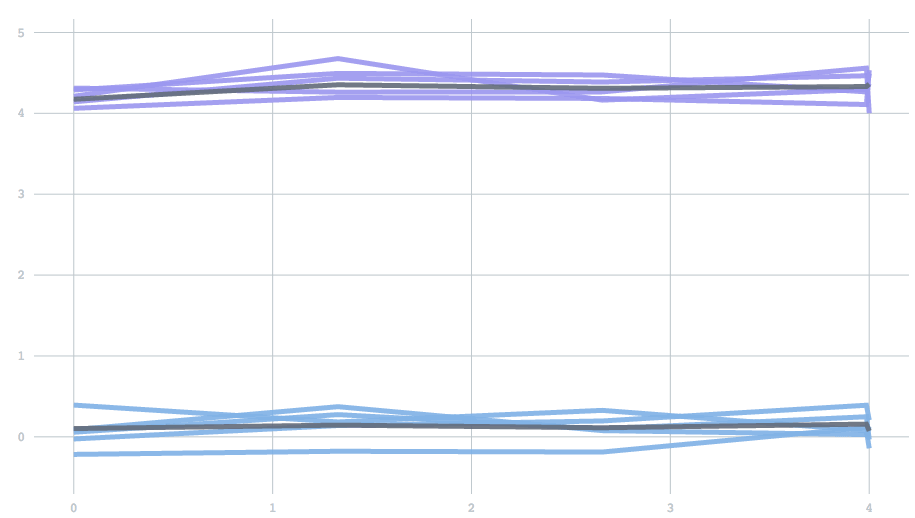
For this setting, we have extended the algorithm to support forgetfulness, allowing the model to adapt to changes over time. The key trick is to add a new parameter that balances the relative importance of new data versus past history. One setting of this parameter will be equivalent to the scenario described above, where all data from the beginning of time are treated equally. At the other extreme, only the most recent data will be used. Settings in between will combine the present with a partial reflection of the past. Here is an animation showing two settings of this forgetfulness parameter, in streams where the centers change half-way through. Watch how the cluster centers quickly adjust to the new locations in the second case, but take a while to shift in the first.
[breadcrumb slug="image-2"]
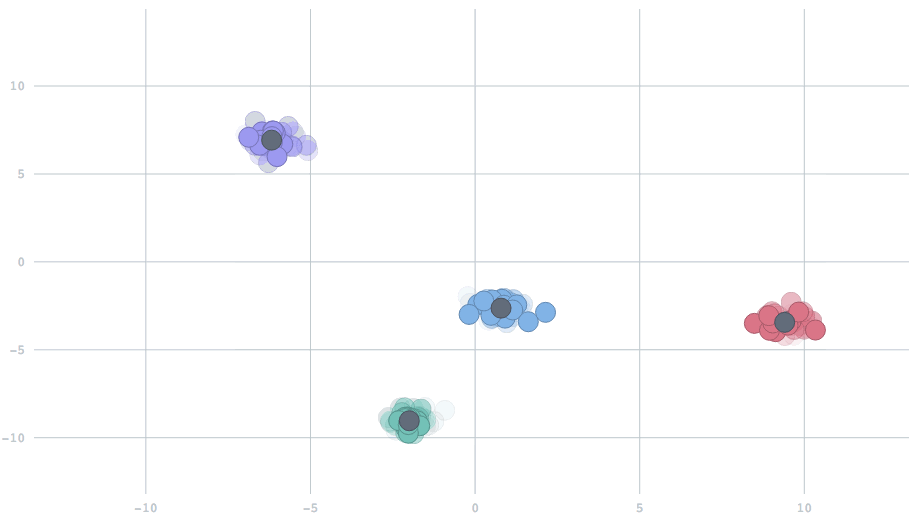
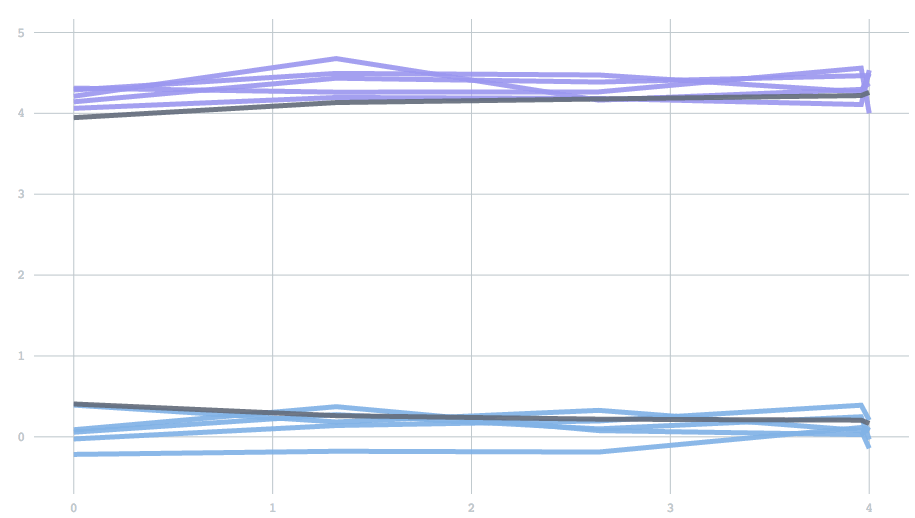
With the appropriate setting of the parameter, we can have cluster centers that smoothly adapt to dynamic changes in the data. In this animation, watch five clusters drift over time, and the centers track them.
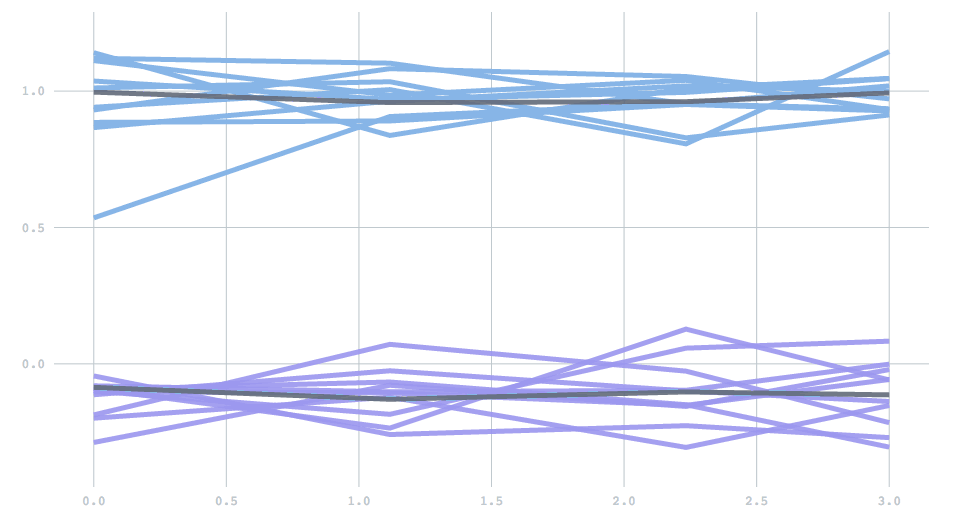
Mathematically, forgetfulness amounts to adding an extra parameter to the update rule: the equation describing how to update centers given a new batch of data. However, as a scalar value between 0 to 1, it is not a particularly intuitive parameter. So instead, we expose a half-life, which describes the time it takes before past data contributes to only one half of the current model. To demonstrate, we’ll use a one-dimensional version of the examples above. We start with data drawn from two clusters, and then switch to data from two different clusters. The half life determines how many batches it will take for the contribution from the initial set of points to reduce to half. You can see the effect of changing the half-life in the time it takes for the clusters adjust. With a half-life of 0.5 batches the change finishes in about 1 batch, but with a half-life of 5 it takes about 10 batches.
[breadcrumb slug="image-3"]
Users may want to think about their half-life in terms of either the number of batches (which have a fixed duration in time), or the number of points. If you have 1000 data points in one batch and 10 in the other, perhaps you want those 1000 to have a proportionately larger impact. On the other hand, you might want to remain stable across fluctuations in data points, and instead treat all periods of time equally. To solve this, we've introduced the concept of a time unit that can be specified as either batches or points. Given a user-specified half life and time unit, the algorithm automatically calculates the appropriate forgetfulness behavior.
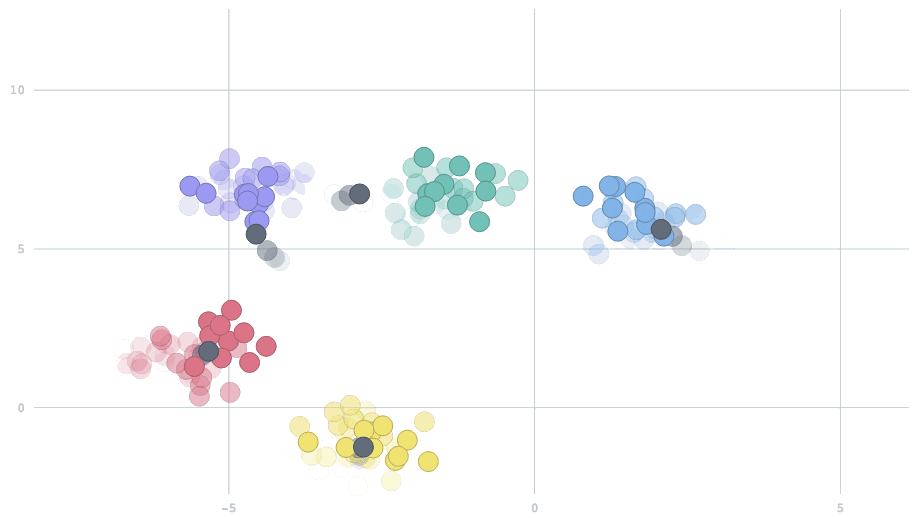
A final feature included is a check to eliminate dying clusters. If there is a dramatic change in the data generating process, one of the estimated clusters may suddenly be far from any data, and stay stuck in its place. To prevent this scenario, clusters are checked for such behavior on each batch. A cluster detected as dying is eliminated, and the largest cluster is split in two. In this one-dimensional demo, two clusters are initially far apart, but then one changes to be much closer to the other. At first the incorrect cluster persists (top line), but soon it disappears, and the other cluster splits to correctly lock on to the new cluster centers.
[breadcrumb slug="image-4"]
Getting started
To get started using streaming k-means yourself, download Apache Spark 1.2 today, read more about streaming k-means in the Apache Spark 1.2 documentation, and try the example code. To generate your own visualizations of streaming clustering like the ones shown here, and explore the range of settings and behaviors, check out the code in the spark-ml-streaming package.
Looking forward
Many algorithms and analyses can benefit from streaming implementations. Along with streaming linear regression (as of 1.1) and streaming clustering (as of 1.2), we plan to add streaming versions of of factorization and classification in future releases, incorporate them into the new Python Streaming API, and use our new forgetfulness parameterization across the algorithms as a unified way to control dynamic model updating.
Special thanks to Xiangrui Meng, Tathagata Das, and Nicholas Sofroniew (for work on algorithm development) and Matthew Conlen (for visualizations).
Get the latest posts in your inbox
Subscribe to our blog and get the latest posts delivered to your inbox.