Simplify Machine Learning on Apache Spark with Databricks
by Denny Lee
As many data scientists and engineers can attest, the majority of the time is spent not on the models themselves but on the supporting infrastructure. Key issues include on the ability to easily visualize, share, deploy, and schedule jobs. More disconcerting is the need for data engineers to re-implement the models developed by data scientists for production. With Databricks, data scientists and engineers can simplify these logistical issues and spend more of their time focusing on their data problems.
Simplify Visualization
An important perspective for data scientists and engineers is the ability to quickly visualize the data and the model that is generated. For example, a common issue when working with linear regression is to determine the model’s goodness of fit. While statistical evaluations such as Mean Squared Error are fundamental, the ability to view the data scatterplot in relation to the regression model is just as important.
Training the models
Using a dataset comparing the population (x) with label data of median housing prices (y), we can build a linear regression model using Spark MLlib’s Linear Regression with Stochastic Gradient Descent (LinearRegressionWithSGD). Spark MLlib is a core component of Apache Spark that allows data scientists and data engineers to quickly experiment and build data models - and bring them to production. Because we are experimenting with SGD, we will need to try out different iterations and learning rates (i.e. alpha or step size).
An easy way to start experimenting with these models is to create a Databricks notebook in your language of choice (python, scala, Spark SQL) and provide contextual information via markdown text. The screenshot below is two cells from an example DBC notebook where the top cell contains markdown comments while the bottom cell contains pyspark code to train two models.
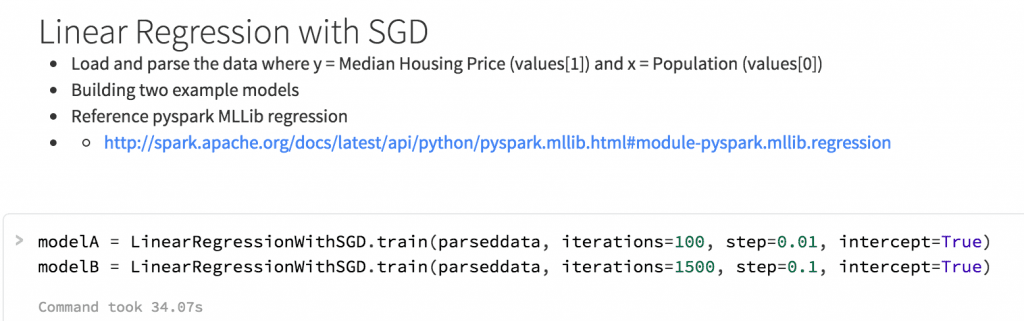
Figure 1: Screenshot of Databricks Notebook training two models with Linear Regression with SGD
Evaluating the models
Once the models are trained, with some additional pyspark code, you can quickly calculate the mean squared error of these two models:
The definition of the models and MSE results are in the table below.
| # of iterations | Step Size | MSE | |
| Model A | 100 | 0.01 | 1.25095190484 |
| Model B | 1500 | 0.1 | 0.205298649734 |
While the evaluation of statistics most likely indicates that Model B has a better goodness of fit, the ability to visually inspect the data will make it easier to validate these results.
Visualizing the models
With Databricks, there are numerous visualization options that you can use with your Databricks notebooks. In addition to the default visualizations automatically available when working with Spark DataFrames, you can also use matplotlib, ggplot, and d3.js - all embedded with the same notebook.
In our example, we are using ggplot (the python code is below) so we can not only provide a scatter plot of the original dataset (in blue), but also graph line plots of the two models where Model A is in red and Model B is in green.
Embedded within the same notebook is the median housing prices ggplot scatterplot figure where the x-axis is the normalized population and y-axis is the normalized median housing price; Model A is in red while Model B is in green.
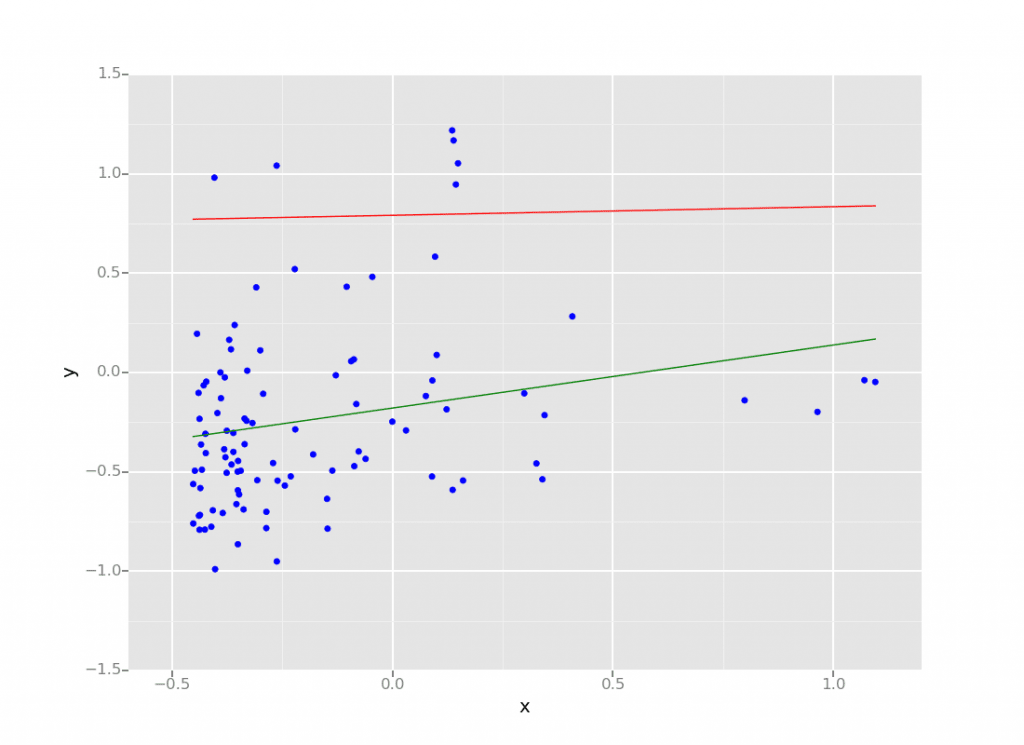
Figure 2: Screenshot of a ggplot scatterplot embedded within a Databricks notebook
As you can see from the above figure, the green line (Model B) has a better goodness of fit compared to the red line (Model A). While the evaluation statistics pointed toward this direction, the ability to quickly visualize the data and the models within the same notebook allows the data scientist to spend more time understanding and optimizing their models.
Simplify Sharing
Another crucial aspect of data sciences is the collaborative effort needed to solve data problems. With many developers, engineers, and data scientists often working in different time zones, schedules, and/or locations, it is important to have an environment that is designed for collaboration.
Portability
With Databricks, you can make it easier to collaborate with your team. You can share your Databricks notebooks by sharing its URL so that any web browser on any device can view your notebooks.
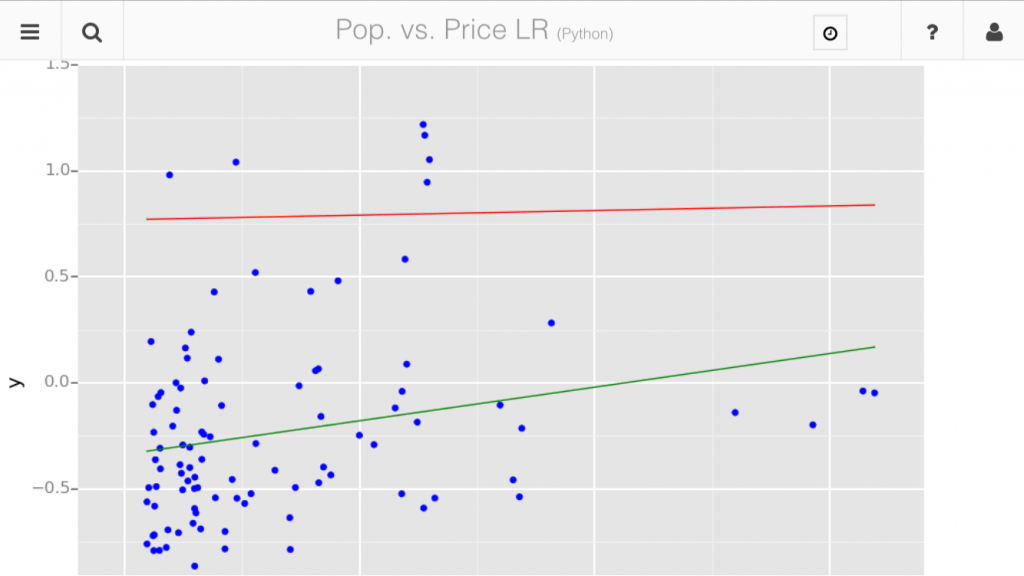
Figure 3: Databricks notebook view of a the same linear regression SGD model via matplotlib on an iPhone 6.
Non-proprietary
While these notebooks are optimized for Databricks, you can export these notebooks to python, scala, and SQL files so you can use them in your own environments. A common use-case for this approach is that data scientists and engineers will collaborate and experiment in Databricks and then apply their resulting code into their on-premises environment.
Share Definitions
As a data scientist or data engineer working with many different datasets, keeping up with all of the changes in schema and locations itself can be a full time job. To help keep this under control, Databricks includes centralized table definitions. Instead of searching for include files that contain the schema, go the tables tab within Databricks and you can define all of your tables in one place. This way as a data engineer updates the schema or source location for these table, these changes are immediately available to all notebooks.
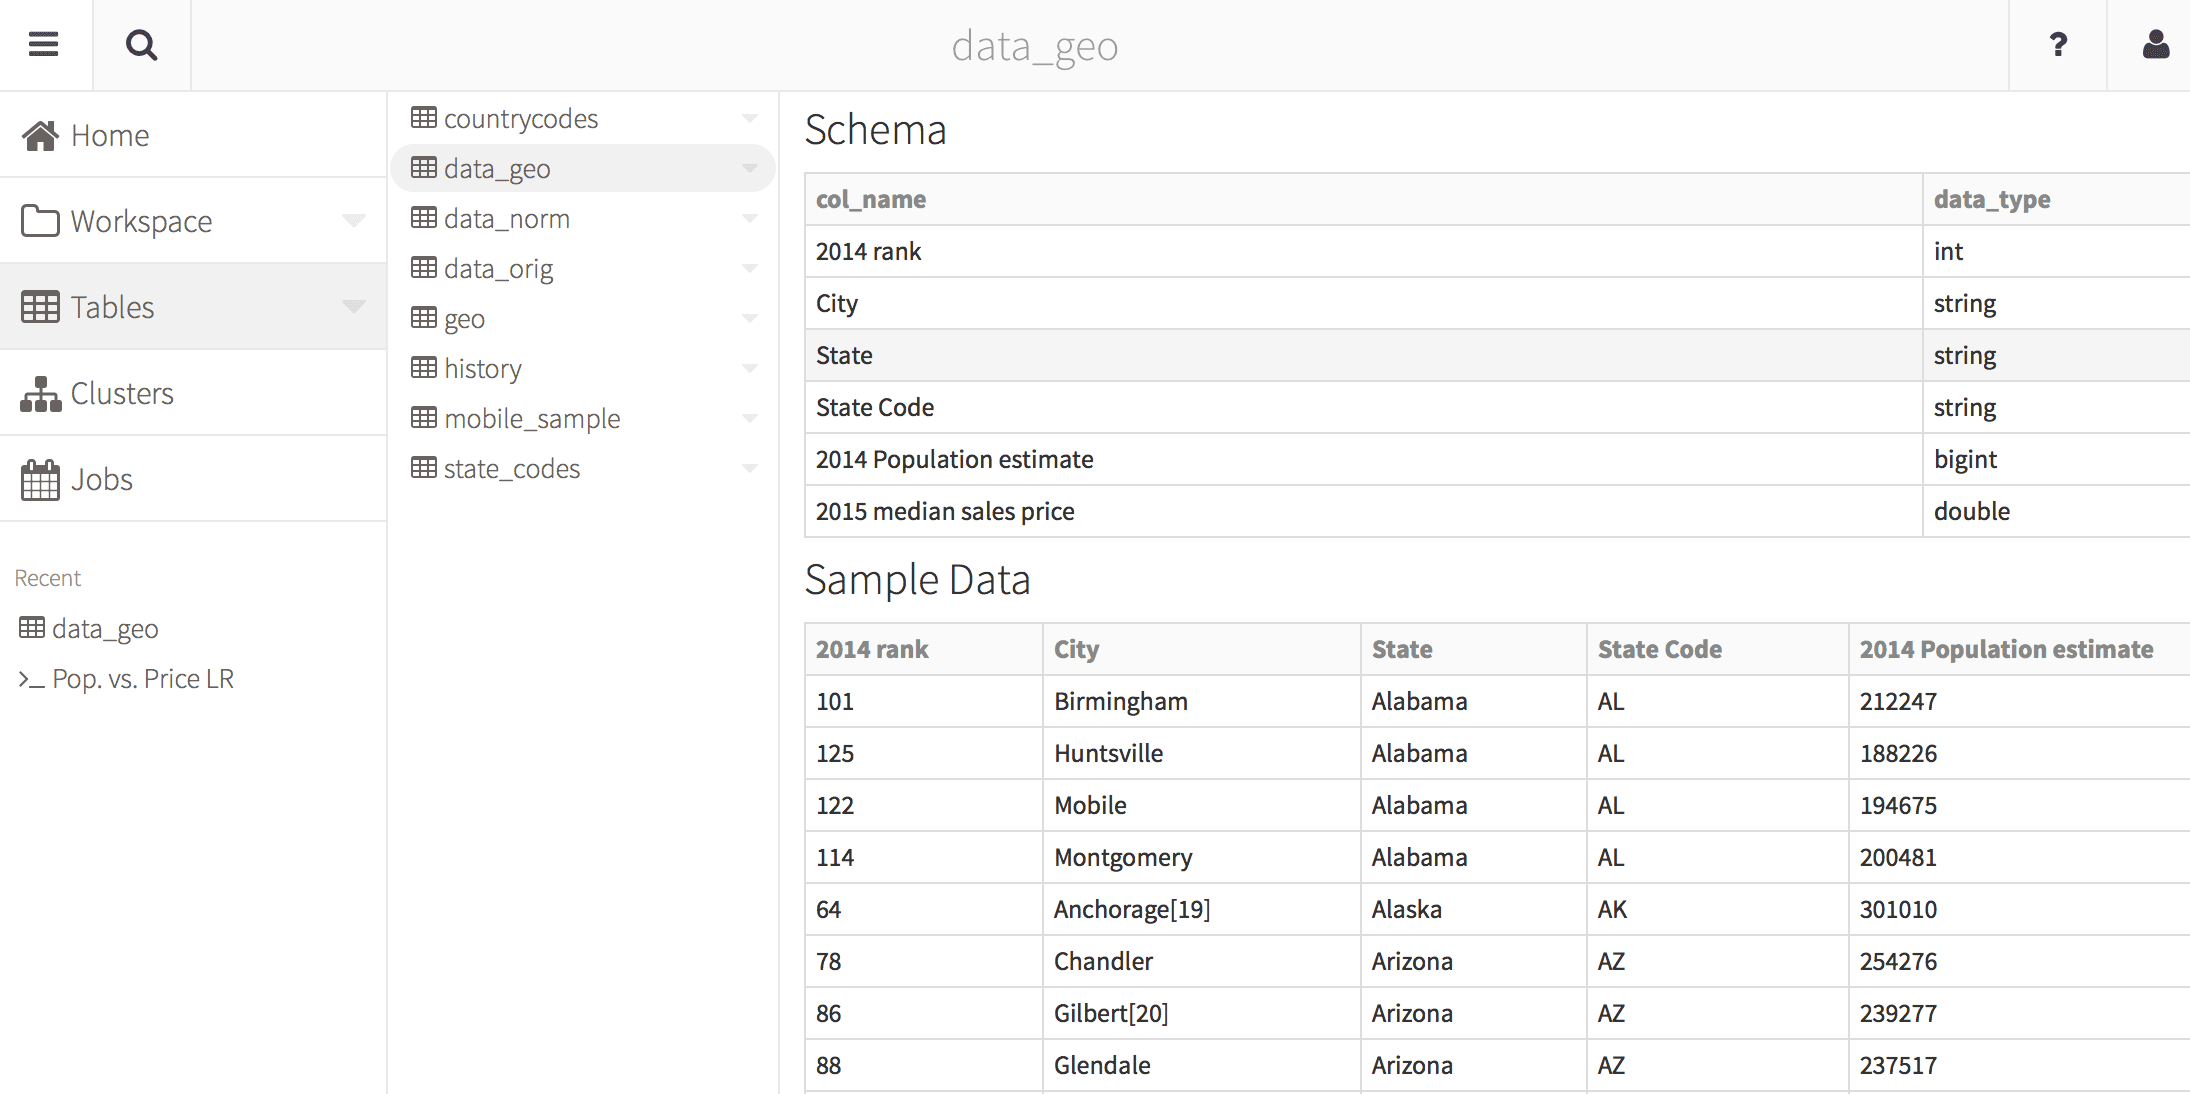
Figure 4: View of table definitions (schema and sample data) all from one place.
Collaborate
As notebooks are being created and shared, users can comment on the code or figures so they can provide input to the notebooks without making any changes to them. This way you can lock the notebooks to prevent accidental changes and still accept feedback.
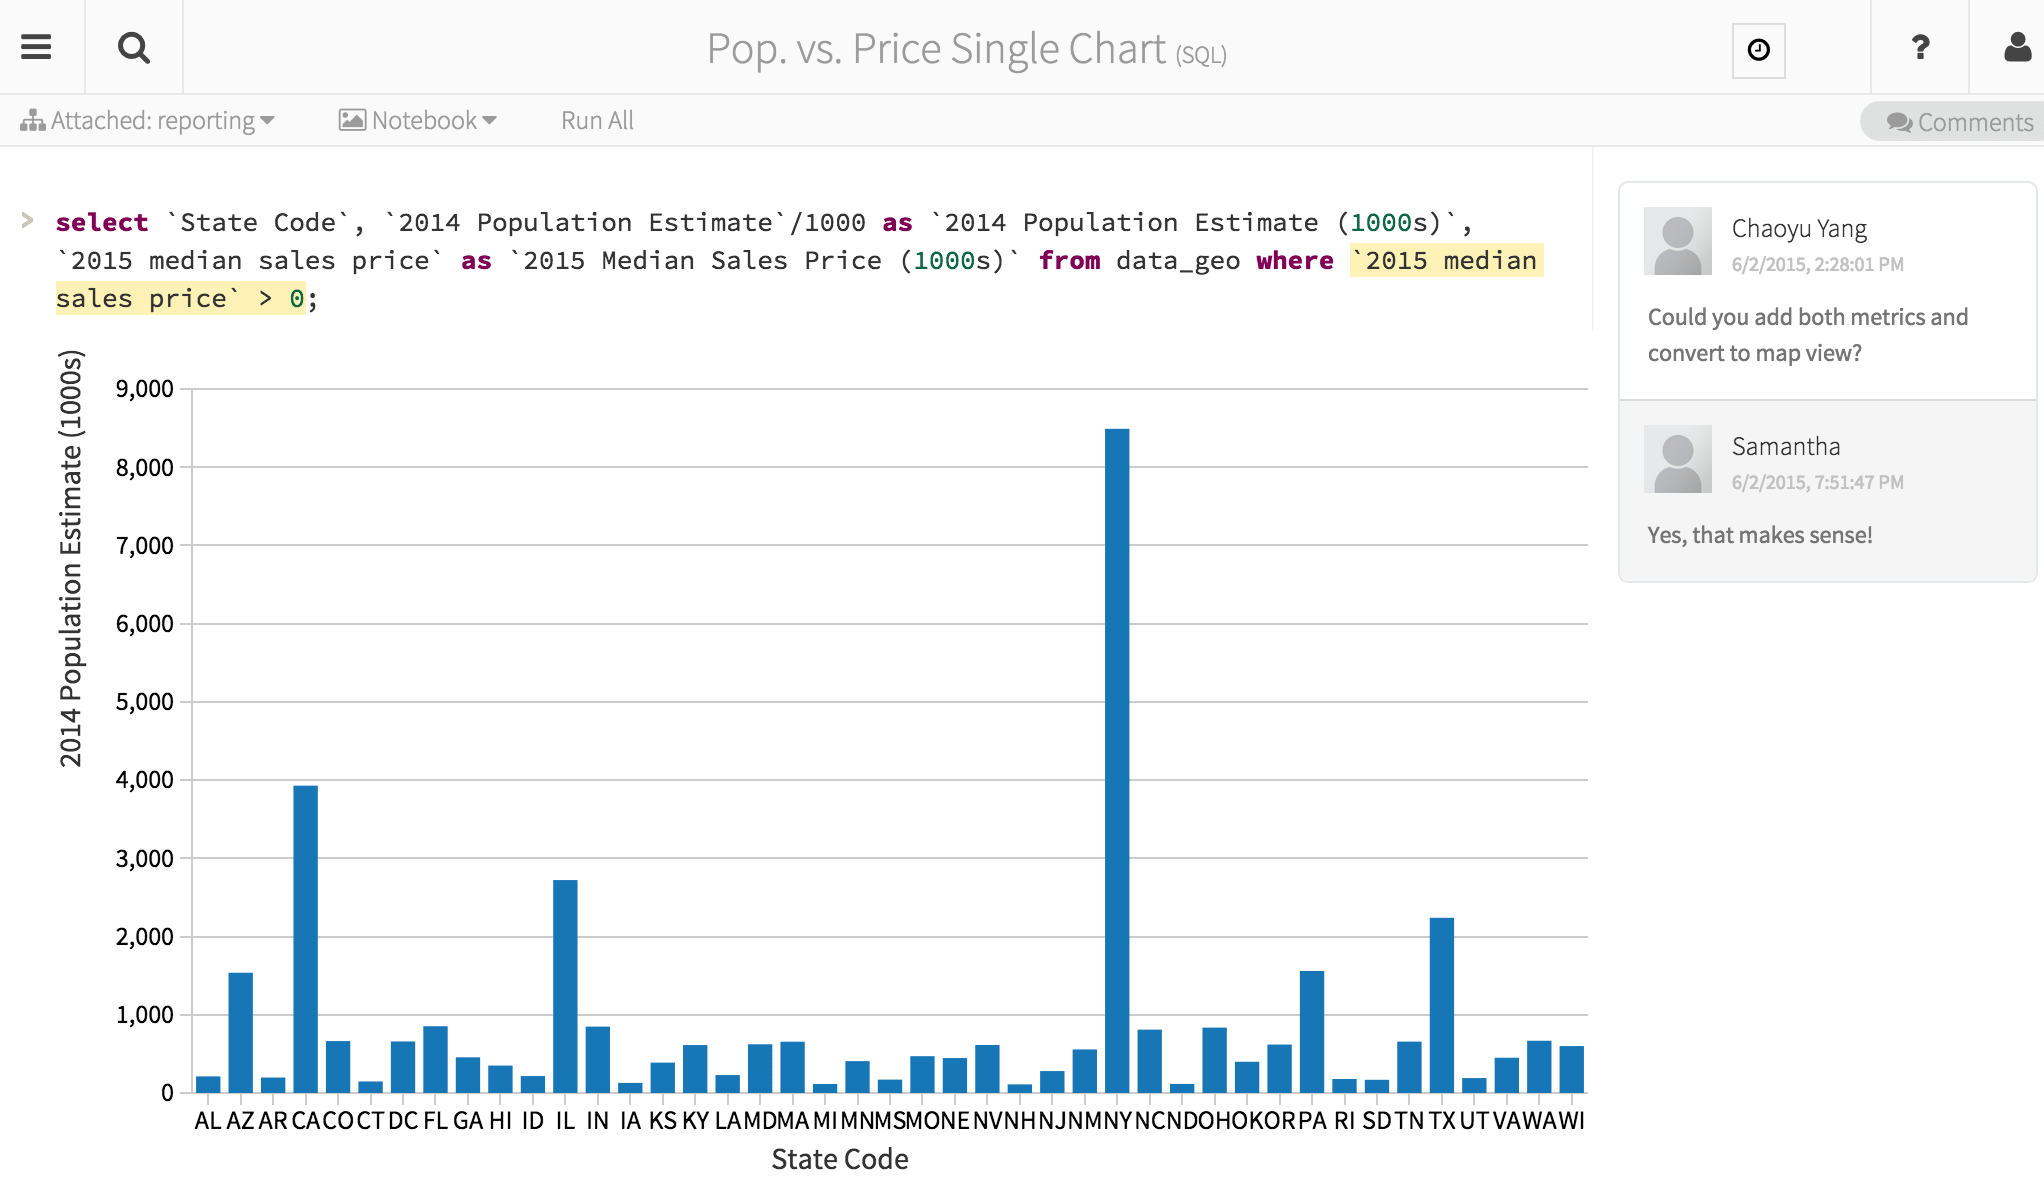
Figure 5: Users commenting on a Databricks notebook to more easily facilitate feedback
Simplify Deployment
One of the key advantages of Databricks is that the model developed by data scientists can be run in production. This is a huge advantage as it reduces the development cycle and tremendously simplifies the maintenance. In contrast, today data scientists develop the model using single machine tools such as R or Python and then have data engineers re-implement the model for production.
Simplify Infrastructure
As a data engineer, there are many steps and configurations to deploy Apache Spark in production. Some examples include (but are not limited to):
- Configuring High Availability and Disaster Recovery for your Spark clusters
- Building the necessary manifests to spin up and down clusters
- Configuring Spark to utilize local SSDs for fast retrieval
- Upgrading or patching your Spark clusters to the latest version of the OS or Apache Spark
With Databricks, the management of your Spark clusters are taken care by dedicated Databricks engineers who are supported by the developers and committers of the Apache Spark open source project. These clusters are configured for optimal performance and balance the issues surrounding resource scheduling, caching, and garbage collection.
Once deployed, you can quickly view what clusters are available and their current state including the libraries and notebooks that are attached to the cluster(s). Concerns around high availability, disaster recovery, manifests to build and deploy clusters, service management, configurations, patching, and upgrades are all managed on your behalf using your own (or your company’s) AWS account.
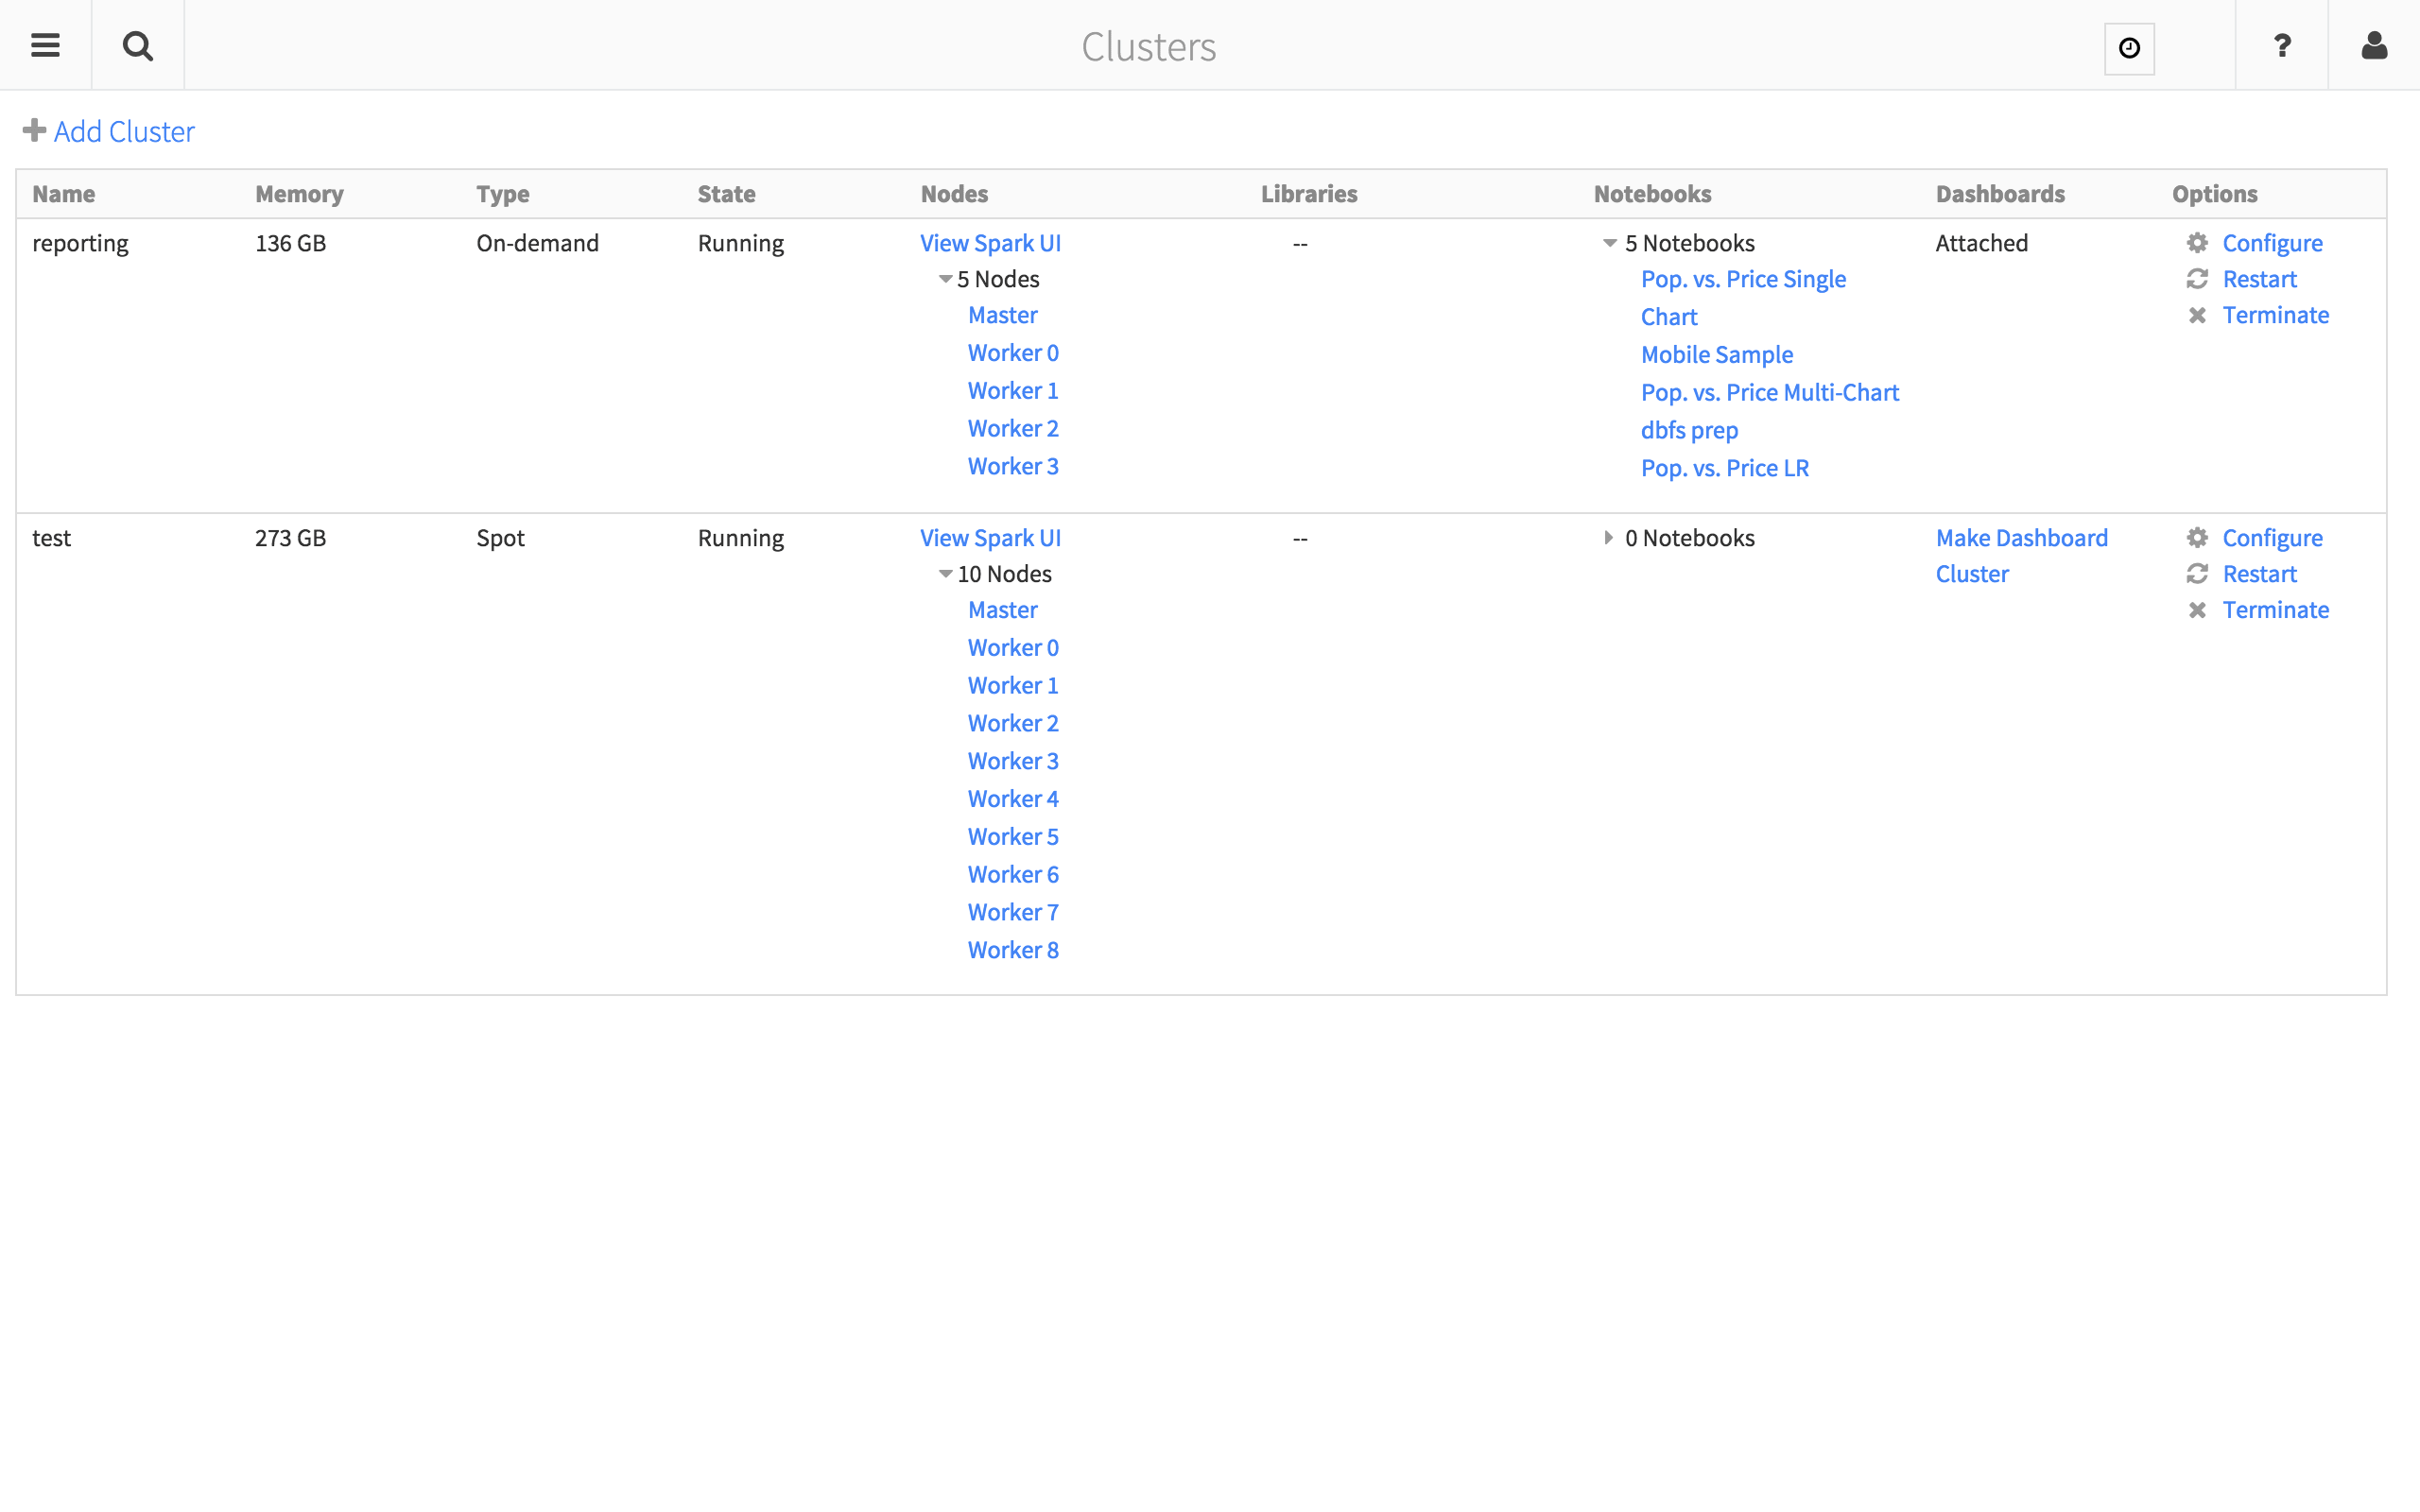
Figure 6: Databricks Cluster view for easier management of your Databricks infrastructure
Simplify Job Scheduling
Traditionally, transitioning from code development to production is a complicated task. It typically involves separate personnel and processes to build the code and push it into production. But Databricks has a powerful Jobs feature for running applications in production. You can take the notebook you had just created and run it as a periodic job - scheduling it minute, hourly, daily, weekly, or monthly intervals. It also has a smart cluster allocation feature that allows you to run your notebook on an existing cluster or on an on-demand cluster. You can also receive email notifications for your job as well as configure retries and timeouts.
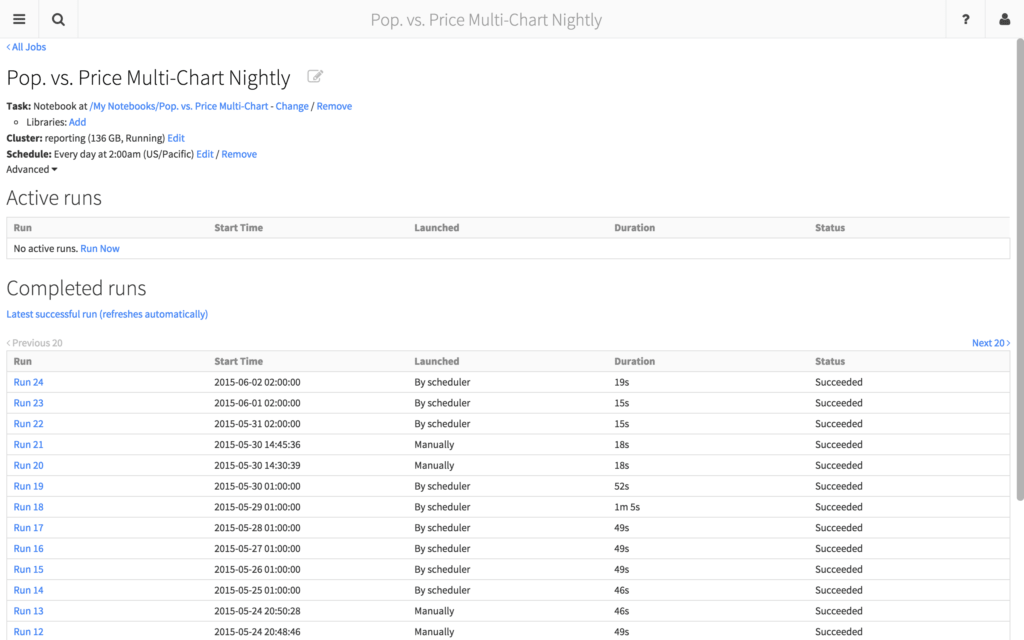
Figure 7: View of the Population vs. Price Multi-Chart Notebook Nightly Job
As well, you can upload and execute any Spark JAR compiled against any Spark installation within the Jobs feature. Therefore any previous work can be used immediately instead of recreating and rebuilding the code-base.
Try out Databricks
We created Databricks to make it easier for data scientists and data engineers to focus on experimenting and training their models, quickly deploy and schedule jobs against those models, easily collaborate and share their learnings, and easily share the schema and definitions for their datasets. Let us manage the cluster, configure it for optimal performance, perform upgrades and patches, and ensure high availability and disaster recovery.
Machine Learning with Spark MLlib is a lot more fun when you get to spend most of your time doing Machine Learning!
Get the latest posts in your inbox
Subscribe to our blog and get the latest posts delivered to your inbox.