SparkR Tutorial at useR 2016

AMPLab and Databricks gave a tutorial on SparkR at the useR conference. The conference was held from June 27 - June 30 at Stanford. In this blog post, we provide high-level introductions along with pointers to the training material and some findings from a survey we conducted during the tutorial.
Part I: Data Exploration
The first part of the tutorial was about big data exploration with SparkR. We started the tutorial with a presentation introducing SparkR. This included an overview of SparkR architecture and introduced three types of machine learning that is possible with SparkR:
- Big Data, Small Learning
- Partition, Aggregate
- Large Scale Machine Learning
The hands-on exercise started with a brief overview of Databricks Workspace. We used R Notebooks in Databricks Community Edition to run R and SparkR commands. It is a free service that supports running Spark in Scala/Python and R.
Participants started by importing the first notebook into their workspace. As you can see in this notebook, we started by reading the one million songs dataset as a Apache Spark DataFrame and visually explored it with two techniques:
- Summarizing and visualizing
- Sampling and visualizing
The notebook introduces both techniques with practical examples and ends with a few exercises.
Part II: Advanced Analytics
In the second part of the tutorial we introduced machine learning algorithms that are available in SparkR. These include the SparkML algorithms that are exposed to R users through a natural R interface. For example, SparkR users can take advantage of a distributed GLM implementation just the same way they would use existing glmnet package. We also introduced two new powerful API that have been added to SparkR in Apache Spark 2.0.
- dapply used for applying an R function on all partitions of Spark DataFrame in parallel
- spark.lapply used for parallelizing R functions in multiple machines/workers
The second notebook again used the Million Songs dataset to do K-Means clustering and also built a predictive model using GLM. Like the first part, it ends with a few exercises for further practice.
Survey Results

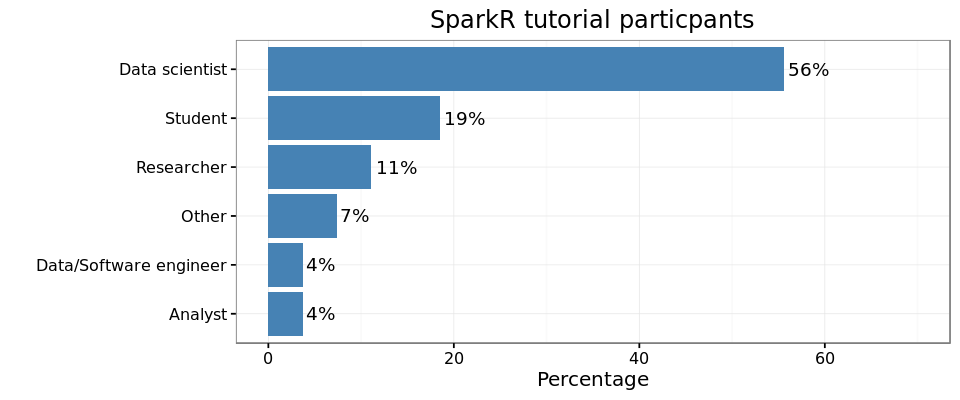
Here is a short summary of survey responses. More than half of the attendees were data scientists, and about 20% were students. When asked about their use cases of R, every one listed “data cleaning and wrangling” as a use case. The majority (~80%) also included “data exploration” and “predictive analytics” as their uses for R. A large majority of participants indicated that they load their data into R, from local filesystem. Loading from RDBMS systems was second in popularity with 60%.
Majority of participants were dplyr users, and about 60% indicated that they prefer hadleyverse for data cleaning and wrangling. When asked about how they communicate their findings, the most popular method is publishing R plots in slides/documents and closely after is sharing rMarkdown files.

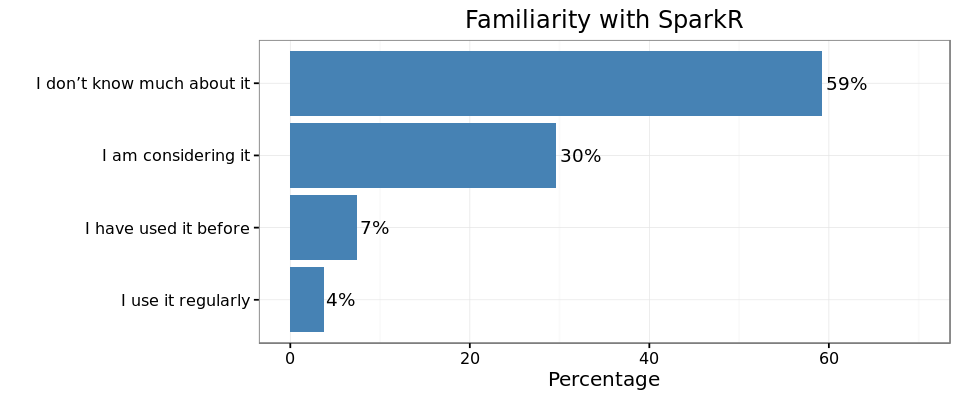
More than half of the attendees had never used SparkR or MLLib and about 25% were actively considering both. We hope this tutorial was helpful to the attendees.
What’s Next?
If you want to try these notebooks do the following:

