Industrial IoT Analytics with DeepIQ DataStudio and Databricks
by Samir Gupta and Jeff Washburn
A recent survey by Bain & Company shows that more than 30% of industrial companies are concerned about Information Technology and Operations Technology (IT&OT) integration. Another recent report by McKinsey & Company states that 70% of companies are still in “Pilot Purgatory” mode with industrial analytics projects, such as the use of the industrial internet of things (iiot) and industrial iot devices to reduce costs and/or improve operational efficiency. Clearly, the implementation of industrial analytics is not a trivial task – whether it’s IT&OT data integration or building machine learning (ML) models for predictive maintenance or asset optimization purposes.
DeepIQ DataStudio is a self-service analytics tools for industrial users and IoT applications that is powered by Databricks to make building analytic pipelines on IT&OT simple. With DataStudio running natively on Databricks, you can:
- Build and deploy sophisticated analytics pipelines in minutes with no programming needed
- Use the cloud’s distributed compute capability for 50x performance gains using Databricks
- Auto-scale storage and compute independently for industrial data volumes: from KB to PB
- Leverage a rich library of native analytics for OT data to build accurate predictive models
- Ingest, process and analyze any operational data source using built-in connectors such as:
- Historians and SCADA systems (e.g. DeepIQ ISV partner OSIsoft PI and Asset Framework)
- Relational data sources (e.g. AP Plant Maintenance (PM) and SAP Manufacturing Intelligence and Integration (SAP MII)
- Geo-spatial data
The user-friendly, drag-n-drop functionality, coupled with built-in sophisticated mathematical functions, empower you to manage your data at ease – from data cleansing to merging of multiple data streams to data processing to building supervised and unsupervised machine learning ( ML) models.
The Manufacturing Industry Use Case: Improving the Life of Industrial Dryers
Industrial dryers are routinely used by many industries including chemical, food and beverage, paper and pulp, agriculture, and plastics. Like any other processing equipment, dryers need to be maintained to alleviate unexpected failures which could lead to significant losses. Predictive maintenance programs can help you reduce your OPEX by maintaining the equipment based on the actual conditions of various components of the dryer. The common failure components for the industrial dryer are trunnion wheels and shafts, drum tires, trunnion bearings and seals.
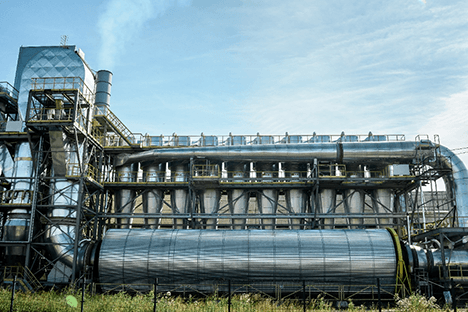
Figure 1: A Typical Industrial Dryer
In this article, we present the predictive maintenance of trunnion bearings using ML models on enriched sensor data.
- We begin ingesting historical time-series sensor readings from an OSIsoft PI System in a scalable, reliable Delta storage format.
- We then enrich our machine-to-machine sensor readings with maintenance report data pulled from an SAP Plant Maintenance system using simple drag-and-drop pipelines running on Databricks.
- Lastly, we analyze the data, identify anomalies and build a predictive maintenance ML model to detect failures before they occur.
Step 1: Data Consolidation
We start by connecting the Pi System’s Asset Framework (AF) server with DataStudio and ingest all the time-series tags for the dryer of interest into the Delta Lake. The drag-and-drop interface of DataStudio makes it easy to create powerful data ingestion and consolidation pipelines.
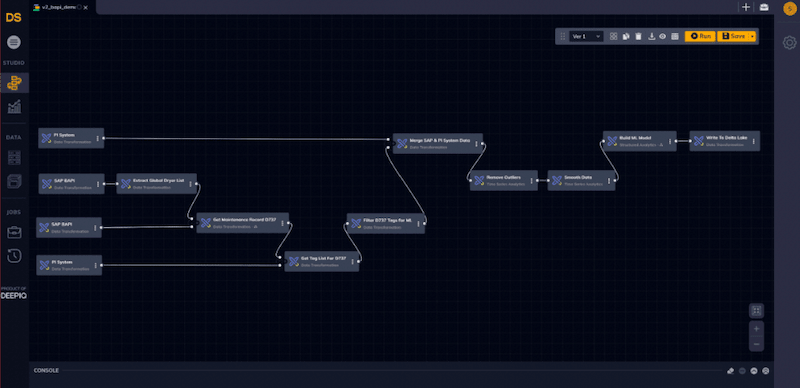
Figure 3: DataStudio workflow: SAP BAPI to Delta Lake
Historic time-series data sets are massive and can be prohibitively expensive to store in traditional relational databases. Delta Lake is an open source storage format that resides on and augments the capabilities of cloud object storage (e.g. Azure Data Lake or Amazon S3) by providing a unified, ACID-compliant, extremely fast storage location for streaming and batch big data sources. It is the recommended storage format for ingesting, processing and training models against time-series data.
With DataStudio, querying OSIsoft PI AF is an easy task. Once the AF server details are configured, we just need to specify the root element of the asset, the tags and the time range of interest - DataStudio handles the remaining complex tasks. Let’s collect the data for tags that measure solid and liquid rates, ambient temperature and humidity, and the dryer rotation rate for the last 5 years for all bearings of a dryer into Delta Lake. Since the bearing vibrations are available at one hertz frequency, each bearing will have over 150 million values! Many of our customers ingest hundreds of thousands of tags generating PB of data. DataStudio achieves this scale by running natively on an auto-scaling Databricks cluster.
Similarly, let’s extract the dryer failure dates from SAP PM. In DataStudio, we provide the parameters of the SAP BAPI we want to query, and the data is made available to us.
Step 2: Data Processing
Using DataStudio’s data visualization tool, we notice that there are few unexpectedly high and low values and possibly missing readings that are auto filled by the SCADA system. These outliers can be filtered out using a MAD outlier’s algorithm in DataStudio.
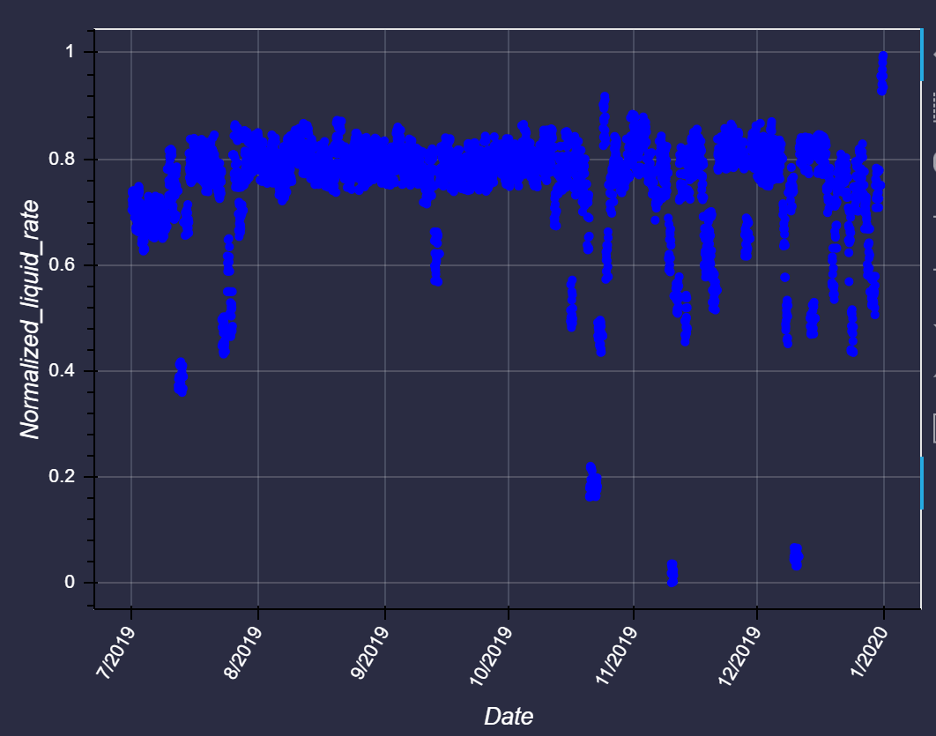
(a) Before outlier removal
(b) After outlier removal
Figure 4: Outlier removal time series (a) before and (b) after
We now notice extremely high frequency noise that obfuscates some of the signal in your sensor readings. Let’s run an exponential smoothing algorithm to filter out the frequency noise.
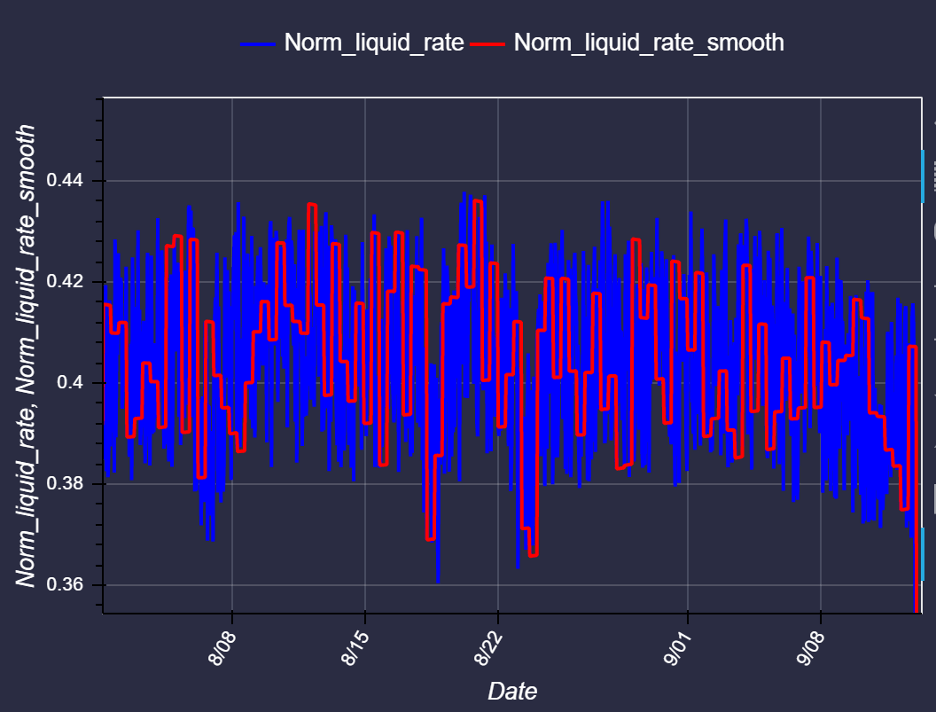
Figure 5: Smoothed data
We can now overlay the failure dates from SAP on our time-series data to see if any of the univariate signals have a direct signature of failure.
Step 3: Data Analytics
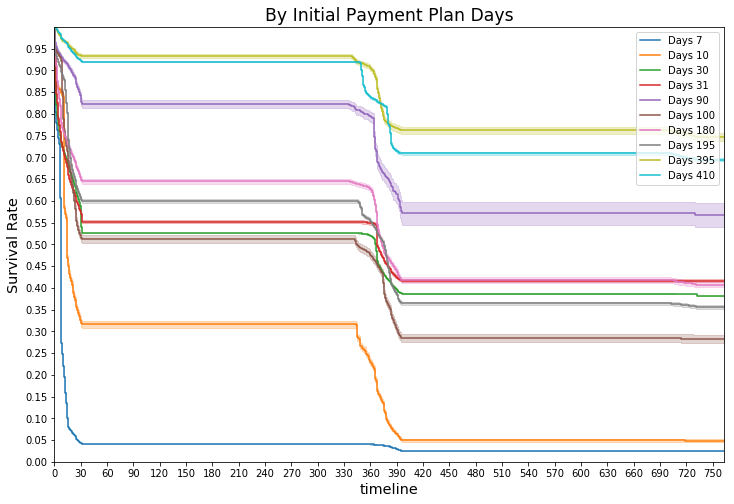
We use an auto-generative neural network to map the data into low dimensions and look at the failure dates vs time-series plots again. One of the hidden dimensions looks to have a strong failure signal because it is showing a significant drop before failure.
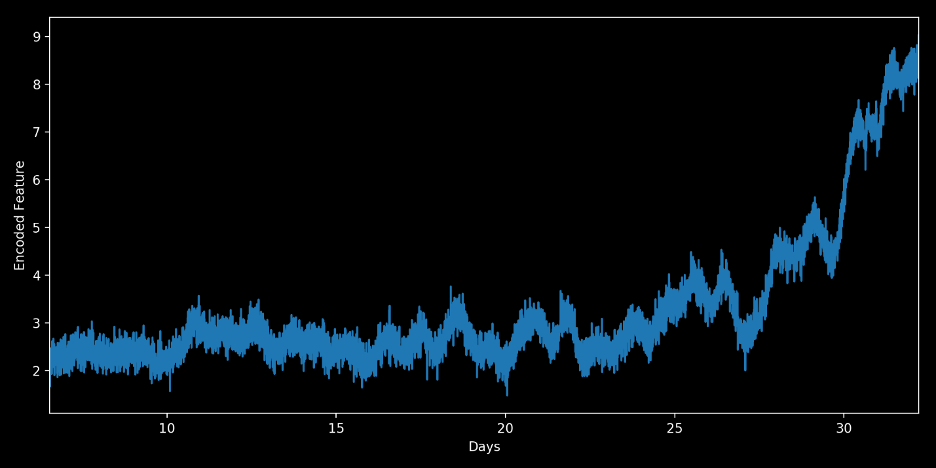
Figure 6: Encoded feature plot from an auto-generative neural network model, overlaid with failure date
By verifying the presence of this trend before other failures, we understand the true negative rate. Many failures show this degradation at least 2 days prior to catastrophic failure. To improve our analysis, let’s develop a supervised machine learning model to predict the failure.
Step 4: Machine Learning
We notice that around 2 days before the failure, the residuals for the encoded liquid rate start rising significantly higher. To detect failures with lead time, we will train an ML model to predict the values of this tag using the other tags pulled in as features under normal operating conditions. When the predicted value of our tag 2 days into the future is outside normal operating conditions, we can fire off an alert for a predicted failure.
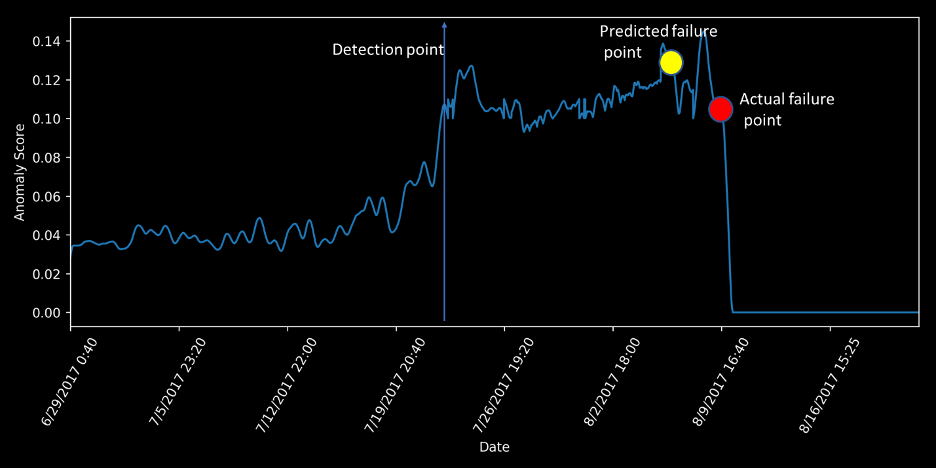
Figure 7: Anomaly score (residuals)
Step 5: Model Deployment and Monitoring
We can now execute the ML model in a batch or streaming mode to generate intelligent alerts by simply adding it to our pipeline in DataStudio. The alerts are based on deviation from the expected value for the current operating conditions.
As new data is generated; the analytic workflows will continue to monitor model performance against them using the metrics we define. The training workflows can be scheduled to retrain your model on a regular basis to ensure that your models are up to date with the latest failure data.
Finally, any visualization software such Spotfire, Tableau or PowerBI can be used to visualize actionable insights in near real time.
Next Steps: Get Started
We have shown the ease of use of building data ingest, cleansing, processing and analytics pipelines using DataStudio on Databricks. With native integrations to Delta Lake, DataStudio offers peta-byte scale data pipelines and machine learning. Look for an upcoming Databricks webinar where we show DataStudio in action!
If you would like additional information about this Blog post, or would like to start a pilot project, please visit https://deepiq.com or reach out to info@deepiq.com. You can follow us on LinkedIn at https://www.linkedin.com/company/deepiq16.
Get the latest posts in your inbox
Subscribe to our blog and get the latest posts delivered to your inbox.