Automated Background Removal in E-commerce Fashion Image Processing Using PyTorch on Databricks
This is a guest blog from Simona Stolnicu, a data scientist and machine learning engineer at Wehkamp, an e-commerce company, where her team builds data pipelines for machine learning tasks at scale.
Wehkamp is one of the biggest e-commerce companies in the Netherlands, with more than 500,000 daily visitors on their website. A wide variety of products offered on the Wehkamp site aims to meet its customers’ many needs.
An important aspect of any customer visit on an e-commerce website is a qualitative and accurate visual experience of the products. At a large scale, this is no easy task, with thousands of product photos processed in a local photo studio.
One aspect of creating a great customer experience is consistency. Since these images' backgrounds are highly varied, before an image goes on the website, the background is removed to create a uniform look on the web pages. If done manually, this is a very tedious and time-consuming job. When it comes to millions of images, the time and resources needed to manually perform background removal are too high to sustain the dynamic flow of the newly arrived products.
In this blog, we describe our automated end-to-end pipeline, which uses machine learning (ML) to reduce image processing time and increase image quality. For that, we employ PyTorch for image processing and Horovod on Databricks clusters for distributed training.
Image processing pipeline overview
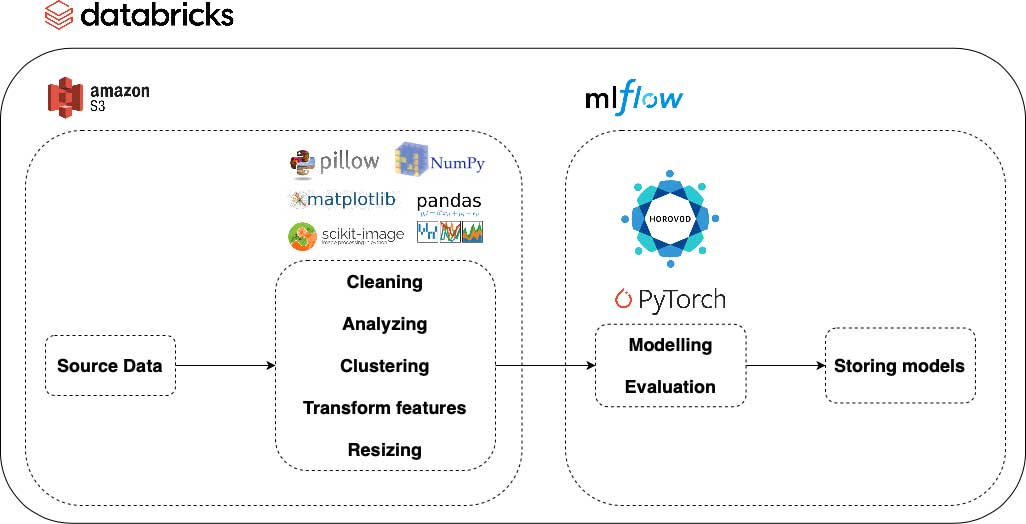
In the following diagram, you can observe all the principal components of our pipeline, starting from data acquisition to storing the models which have been trained and evaluated on the processed data. Additionally, you can see the services and libraries that were used at each step in the image processing pipeline. As an outline, we used Amazon S3 buckets to load and save both the raw and processed image data. For the model training and evaluation, we used MLflow experiments to store parameters and results. Also, the models are versioned in the MLflow Model Registry from where they can go to the production environment.
Fashion image dataset processing
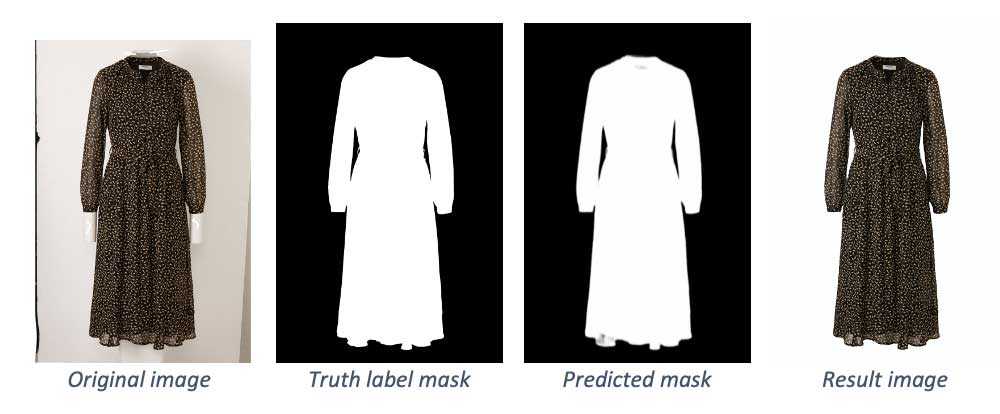
In order for the machine learning model to learn the distinction between an image's background and foreground, the model needs to process a pair of the original image and a binary mask showing which pixels belong to the background or foreground.
The dataset used for this project has around 30,000 pair images. The predicted output of the model will be a binary mask, and the resulting final image is obtained by removing the background area marked in the binary mask from the original image.
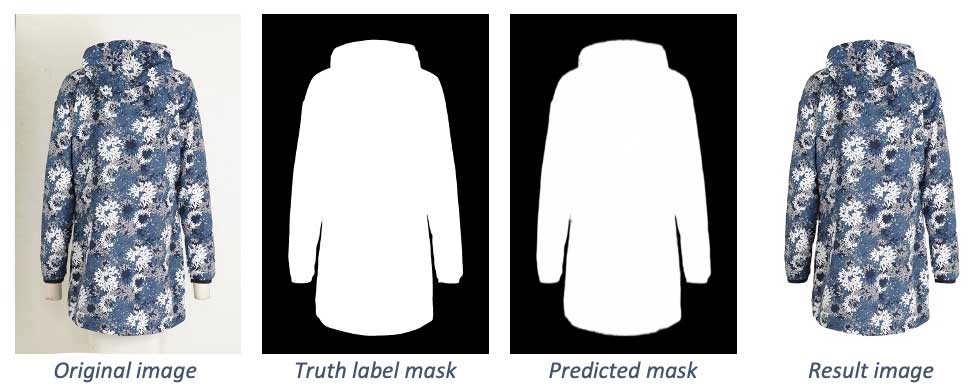
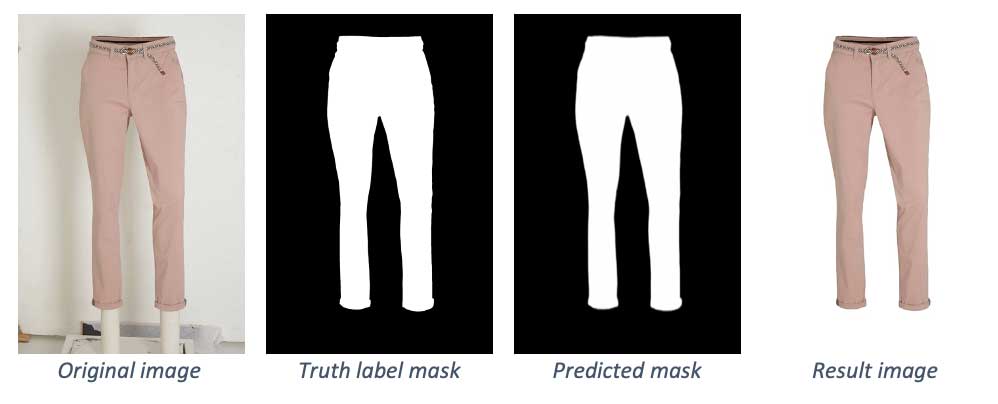
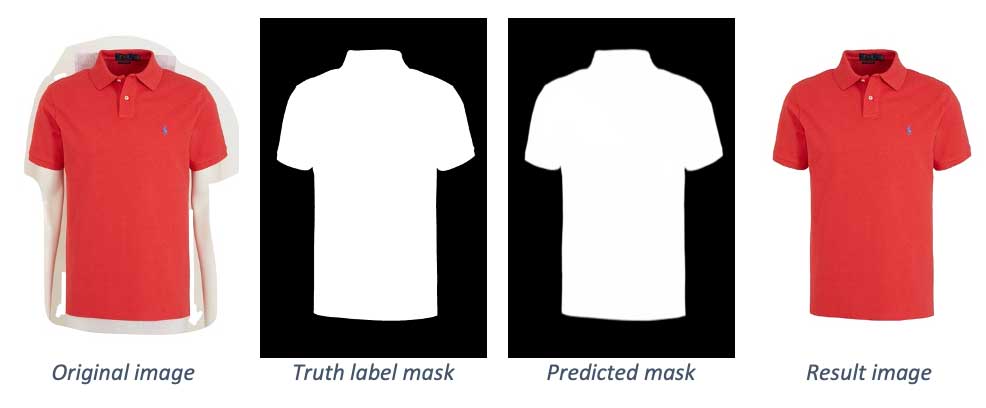
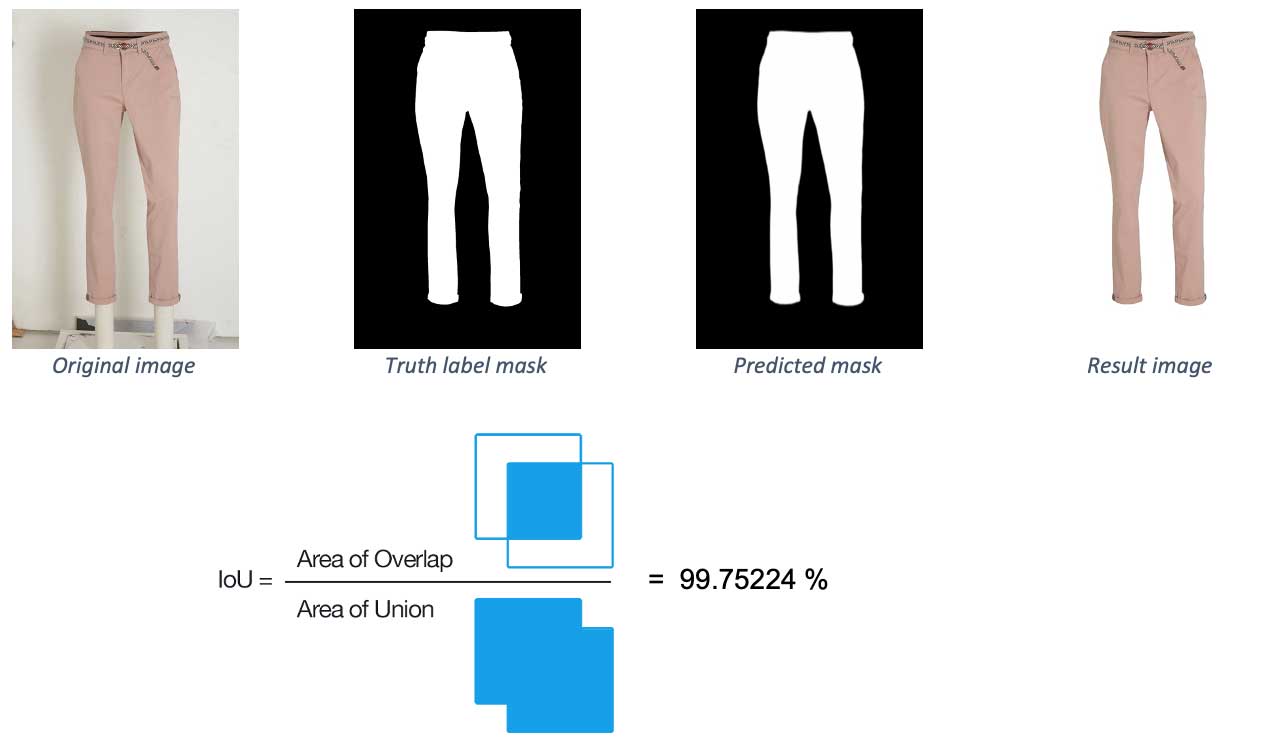
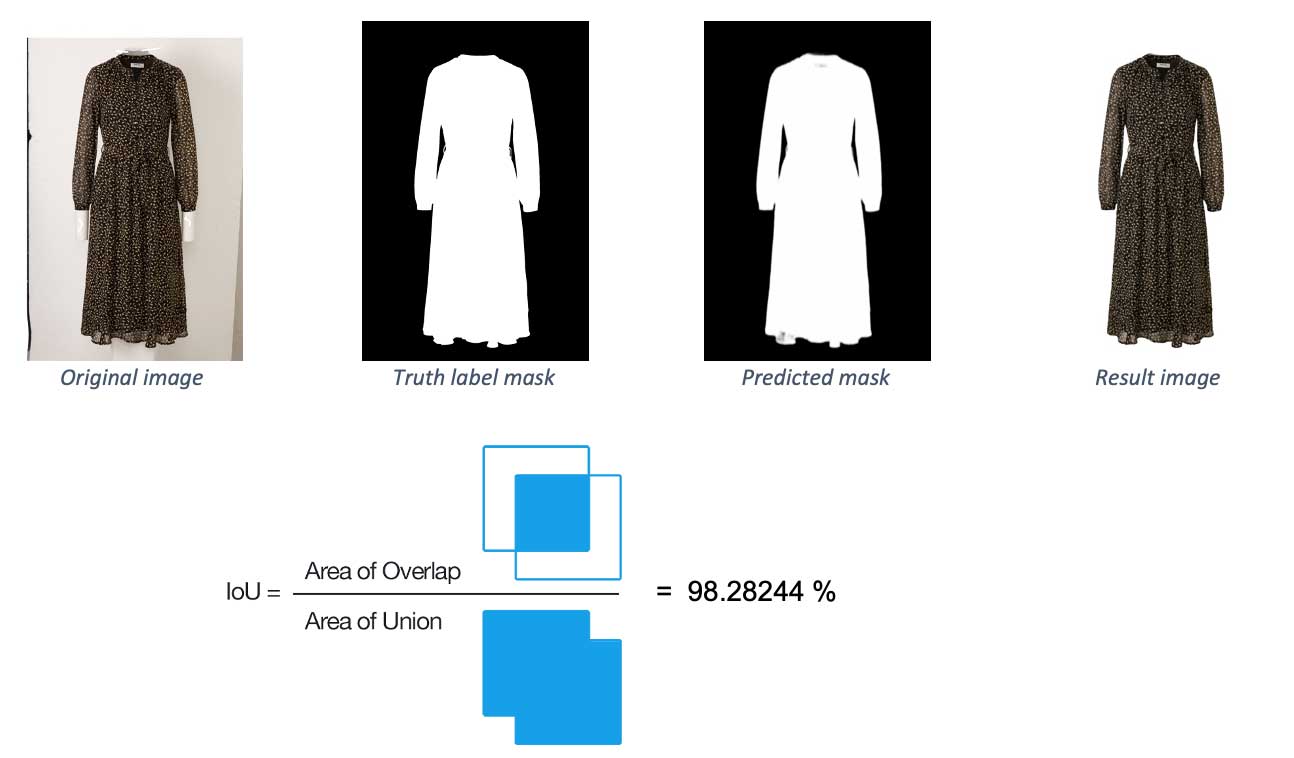
Below you can see some examples from the testing dataset, more specifically the original image and label (which in the case of the training dataset will represent the input for the network), followed by the predicted mask and the final image with the background removed.
Building a general step-by-step pipeline to process images is difficult unless you know precisely what to expect from the data to be processed. Unforeseen variance in data makes it difficult to anticipate which operations are needed to be performed. In our case, we experimented with some training trials to determine the exact areas of the images that needed cleaning or more analysis.
The dataset cleaning consisted of removing the mismatched pair images and resizing the images at the beginning of the process. This was done to improve the process’s effectiveness and match our network architecture’s input size.
Another step suitable for our case was to split our image data into 6 clusters of product types, namely:
- Long pants
- Shorts
- Short-sleeved tops/dresses
- Long-sleeved tops/dresses
- Beachwear/sportswear/accessories
- Light-colored products.
This splitting was needed because of the unbalanced number of product types existing in the data, making our model prone to perform worse for the product types underrepresented in the training data. A cluster consisting of light-colored products was created because a considerable amount of the images in our dataset had a light-colored background, and detecting products when background and product colors are similar proved to be difficult. Because these cases were in small amounts, the model didn’t have many examples for treating similar cases.
The clustering process was based primarily on the k-means algorithm, which was applied to the original images’ computed features. The result of this process was not fully accurate, so some manual work was also needed.
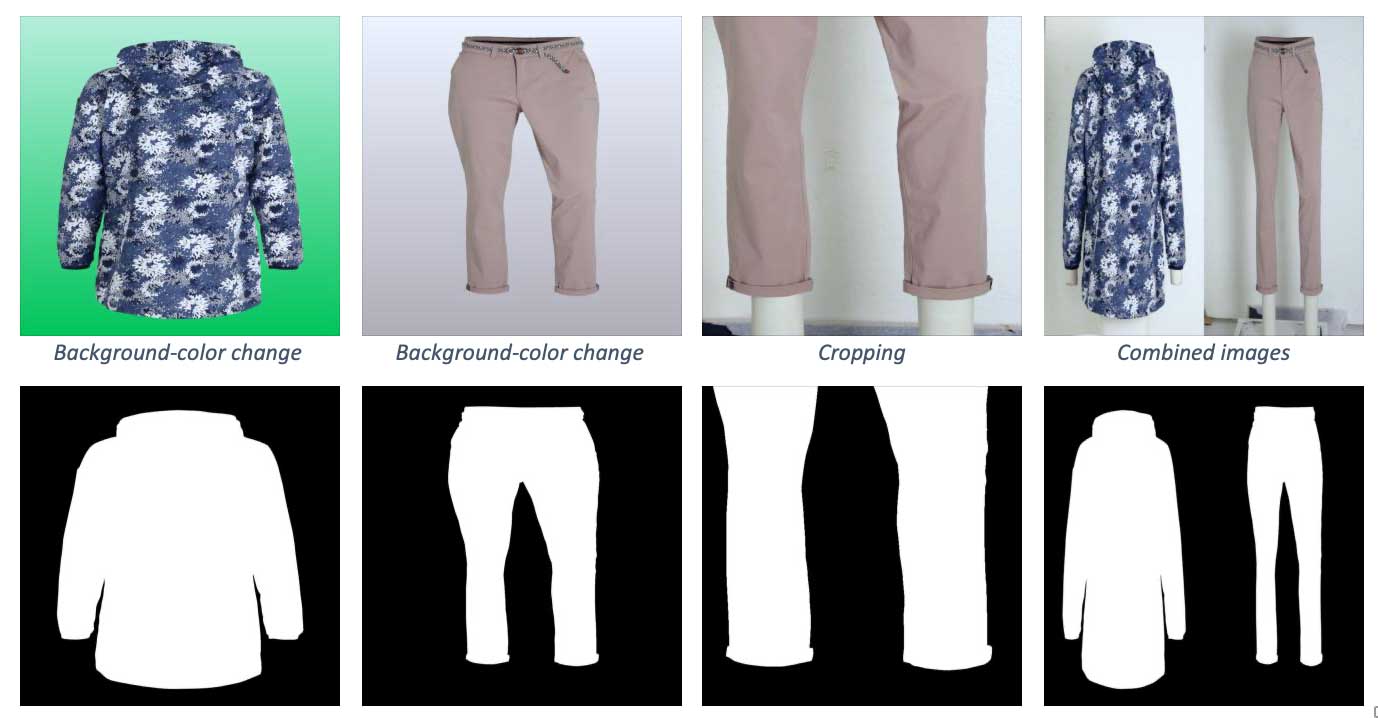
Even though this work is based on a large amount of data, this didn’t cover all the use cases this model would be used for. For this reason, the data needed some augmentation techniques from which the most important were:
- Cropping
- Background color change
- Combination of images
Below you can see how these transformations look on some of the images presented above.
One thing to keep in mind when working with images is that training data is difficult to obtain. The manual process of creating the training data takes time and a lot of work to ensure accuracy.
Model architecture for image processing
Separating the foreground from the background is considered to be a saliency detection problem. It consists of detecting the most obvious region in images and predicting the probability of a pixel belonging to either background or foreground.
The most recent state of the art in this area is the U2-Net paper (U2-Net: Going Deeper with Nested U-Structure for Salient Object Detection), which introduces a deep neural network architecture for salient object detection and feature extraction. This architecture has a two-level nested U network shape and can run with low memory and reduced computational cost.
Its main strength is detecting features by using deep layers of many scales in the architecture. In this way, it can understand the contextual information without any computational time added.
Our model is built on an architecture inspired by the paper mentioned above, and it showed significant improvements in the results compared to other convolutional neural network (CNN) architectures, such as Mask-RCNN. This is because Mask-RCNN’s backbone is also specific for image classification tasks, making the network more complicated in this particular use case.
Distributed model training and evaluation
Training with large amounts of data is a time-consuming process of trial and error. Our network was trained in a Databricks environment using workers with graphical processing units (GPUs). Horovod helped us set up a distributed training process using PyTorch.
During each epoch, distinct batches are trained on multiple workers, and the results are merged by averaging the parameters between workers. At each epoch, the dataset is split across the number of workers. Each worker then divides its data into the batch_size number that was set in the parameters for the training. This means the training is actually running on a larger batch size, which is batch_size multiplied by the number of workers.
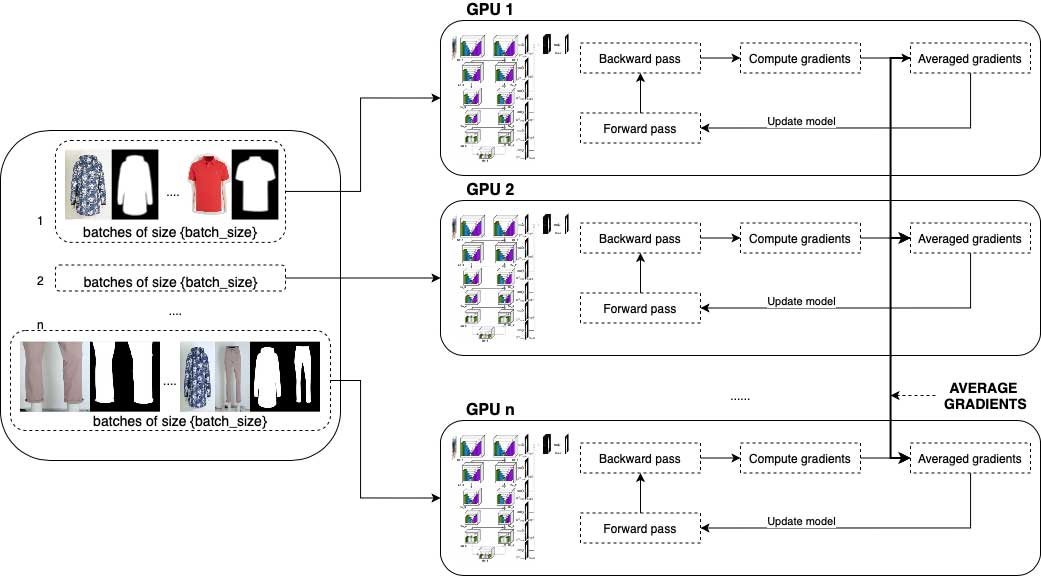
Horovod uses a metric that can average the workers’ parameters after each epoch to a root node. Then it redistributes the new values to all workers, and the training can continue with the following epochs. This is very easy to set up, especially in a PyTorch environment.
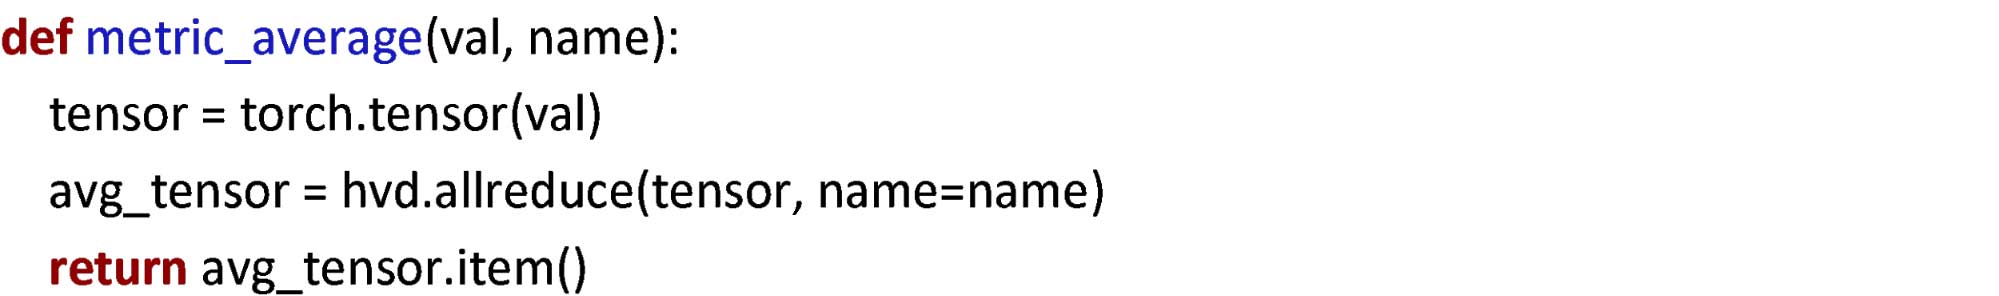
Say there is a need to add different or additional metrics during training or set up validation steps after each epoch. What then? Because the default implementation of Horovod functions cannot take into account the additional metrics, you have to explicitly set up how workers' parameters are to be merged. The solution is to use the same function that Horovod uses as an average metric. It was a bit hard to find this in the Horovod documentation, but it made things work.
Some of the training and evaluation characteristics used and worth mentioning are:
- Training parameters settings (Adam optimizer, dynamic learning rate, batch_size=10*nr_gpus, epochs=~30)
- Training and validation time: 9 hours using 20 workers of single GPU instances cluster
- Evaluation methods: Intersection over Union (IoU) metric
- TensorBoard metrics: losses, learning rate, IoU metric/epoch for validation dataset
Intersection over Union (IoU) is an evaluation metric used to check the predicted mask’s accuracy by comparing it to the actual truth label mask. Below you can see the values of this metric on two example images. The first has a value of almost 100%, meaning the predicted label is almost identical to the truth label. The second one shows some minor problems, which result in a lower score.
PyTorch model performance and evaluation metrics
Our best model average performance is 99.435%. In terms of the number of images achieving certain scores, you can look at them from two perspectives.
First, clustered by accuracy. Below are some numbers:
- Over 99.3% of images with 95% accuracy
- Over 98.7% of images with 97% accuracy
- Over 93.1% of images with 99% accuracy
Another way to check the model results is to see its performance on specific image type clusters. This way of looking at the numbers makes clear our model’s strengths and weaknesses. For example, when clustering by image type, the numbers are:
- Long pants: 99.428% accuracy
- Shorts: 99.617% accuracy
- Short-sleeved tops/dresses: 99.502% accuracy
- Long-sleeved tops/dresses: 99.588% accuracy
- Beachwear/sportswear/accessories: 98.815% accuracy
- Light-colored products: 98.868% accuracy
Lessons learned
As with any training or experimentation, you are bound to encounter some errors. Some of the errors we ran into during the development were related to either out of memory errors (OOM) or, in some cases, failures caused when workers’ nodes were detached. For the first case, we tried different values for the batch size until we found the largest size that didn’t raise any errors. For the second, the solution is always to check whether the cluster is set up to use only on-demand instances instead of spot instances. This is easily selected when creating a Databricks machine learning runtime cluster.
What’s Next
In summation, when using ML in such a dynamic environment as e-commerce fashion, where item styles are constantly changing, it is essential to make sure the models’ performance keeps up with these changes. The project aims to move towards building pipelines for retraining using the results that the current models are outputting in production.
For the quality check of the output images, an established threshold will determine whether an image will be transferred to an interface, where it can be corrected, or whether it can directly go to data storage for the retraining pipeline. Once we have accomplished this, we can move towards new challenges that can continuously improve the quality of the work and the customers’ delivered experience.
Interested to learn more? Register for the Data + AI Summit 2021 and attend the related session Automated Background Removal Using PyTorch.
Get the latest posts in your inbox
Subscribe to our blog and get the latest posts delivered to your inbox.