Top 5 Databricks Performance Tips
by Peter Stern
Intro
As solutions architects, we work closely with customers every day to help them get the best performance out of their jobs on Databricks –and we often end up giving the same advice. It's not uncommon to have a conversation with a customer and get double, triple, or even more performance with just a few tweaks. So what's the secret? How are we doing this? Here are the top 5 things we see that can make a huge impact on the performance customers get from Databricks.
Here's a TLDR:
- Use larger clusters. It may sound obvious, but this is the number one problem we see. It's actually not any more expensive to use a large cluster for a workload than it is to use a smaller one. It's just faster. If there's anything you should take away from this article, it's this. Read section 1. Really.
- Use Photon, Databricks' new, super-fast execution engine. Read section 2 to learn more. You won't regret it.
- Clean out your configurations. Configurations carried from one Apache Spark™ version to the next can cause massive problems. Clean up! Read section 3 to learn more.
- Use Delta Caching. There's a good chance you're not using caching correctly, if at all. See Section 4 to learn more.
- Be aware of lazy evaluation. If this doesn't mean anything to you and you're writing Spark code, jump to section 5.
- Bonus tip! Table design is super important. We'll go into this in a future blog, but for now, check out the guide on Delta Lake best practices.
1. Give your clusters horsepower!
This is the number one mistake customers make. Many customers create tiny clusters of two workers with four cores each, and it takes forever to do anything. The concern is always the same: they don't want to spend too much money on larger clusters. Here's the thing: it's actually not any more expensive to use a large cluster for a workload than it is to use a smaller one. It's just faster.
The key is that you're renting the cluster for the length of the workload. So, if you spin up that two worker cluster and it takes an hour, you're paying for those workers for the full hour. However, if you spin up a four worker cluster and it takes only half an hour, the cost is actually the same! And that trend continues as long as there's enough work for the cluster to do.
Here's a hypothetical scenario illustrating the point:
| Number of Workers | Cost Per Hour | Length of Workload (hours) | Cost of Workload |
|---|---|---|---|
| 1 | $1 | 2 | $2 |
| 2 | $2 | 1 | $2 |
| 4 | $4 | 0.5 | $2 |
| 8 | $8 | 0.25 | $2 |
Notice that the total cost of the workload stays the same while the real-world time it takes for the job to run drops significantly. So, bump up your Databricks cluster specs and speed up your workloads without spending any more money. It can't really get any simpler than that.
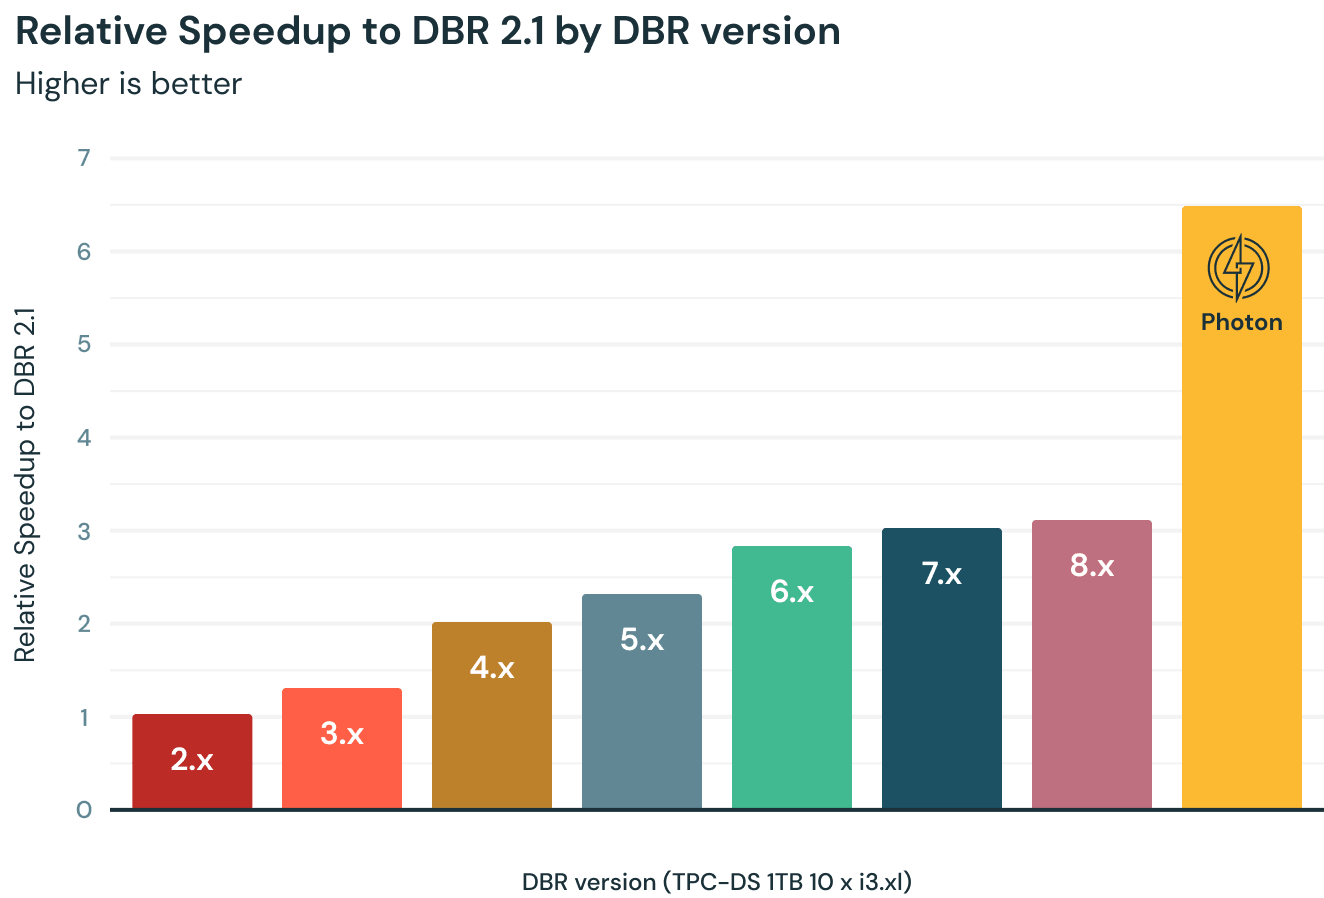
2. Use Photon
Our colleagues in engineering have rewritten the Spark execution engine in C++ and dubbed it Photon. The results are impressive!
Beyond the obvious improvements due to running the engine in native code, they've also made use of CPU-level performance features and better memory management. On top of this, they've rewritten the Parquet writer in C++. So this makes writing to Parquet and Delta (based on Parquet) super fast as well!
But let's also be clear about what Photon is speeding up. It improves computation speed for any built-in functions or operations, as well as writes to Parquet or Delta. So joins? Yep! Aggregations? Sure! ETL? Absolutely! That UDF (user-defined function) you wrote? Sorry, but it won't help there. The job that's spending most of its time reading from an ancient on-prem database? Won't help there either, unfortunately.
The good news is that it helps where it can. So even if part of your job can't be sped up, it will speed up the other parts. Also, most jobs are written with the native operations and spend a lot of time writing to Delta, and Photon helps a lot there. So give it a try. You may be amazed by the results!
3. Clean out old configurations
You know those Spark configurations you've been carrying along from version to version and no one knows what they do anymore? They may not be harmless. We've seen jobs go from running for hours down to minutes simply by cleaning out old configurations. There may have been a quirk in a particular version of Spark, a performance tweak that has not aged well, or something pulled off some blog somewhere that never really made sense. At the very least, it's worth revisiting your Spark configurations if you're in this situation. Often the default configurations are the best, and they're only getting better. Your configurations may be holding you back.
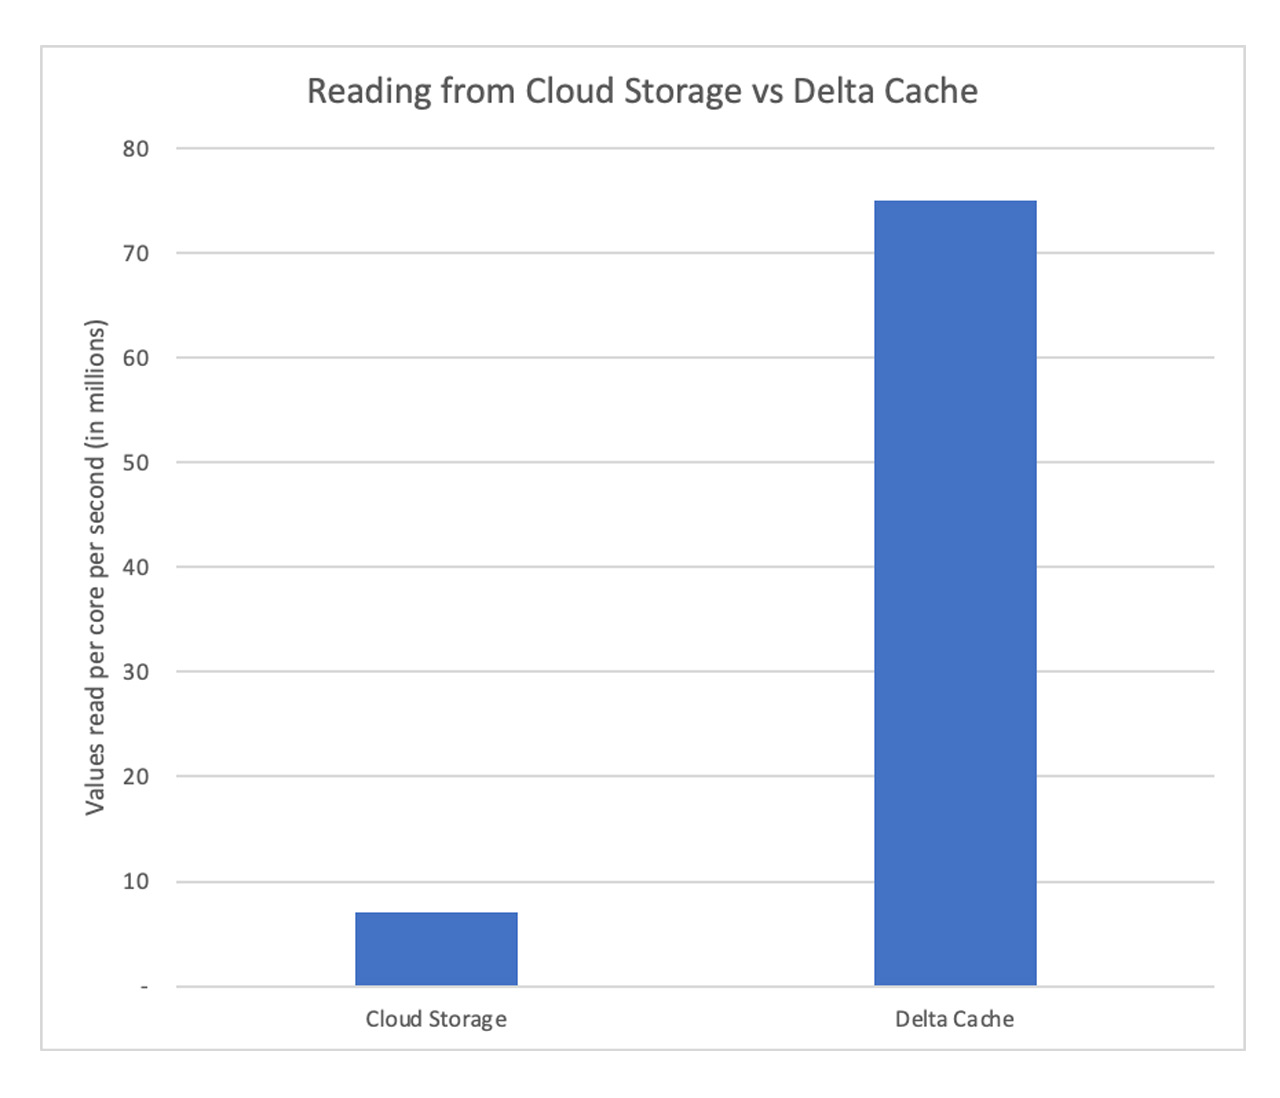
4. The Delta Cache is your friend
This may seem obvious, but you'd be surprised how many people are not using the Delta Cache, which loads data off of cloud storage (S3, ADLS) and keeps it on the workers' SSDs for faster access.
If you're using Databricks SQL Endpoints you're in luck. Those have caching on by default. In fact, we recommend using CACHE SELECT * FROM table to preload your "hot" tables when you're starting an endpoint. This will ensure blazing fast speeds for any queries on those tables.
If you're using regular clusters, be sure to use the i3 series on Amazon Web Services (AWS), L series or E series on Azure Databricks, or n2 in GCP. These will all have fast SSDs and caching enabled by default.
Of course, your mileage may vary. If you're doing BI, which involves reading the same tables over and over again, caching gives an amazing boost. However, if you're simply reading a table once and writing out the results as in some ETL jobs, you may not get much benefit. You know your jobs better than anyone. Go forth and conquer.
5. Be aware of lazy evaluation
If you're a data analyst or data scientist only using SQL or doing BI you can skip this section. However, if you're in data engineering and writing pipelines or doing processing using Databricks / Spark, read on.
When you're writing Spark code like select, groupBy, filter, etc, you're really building an execution plan. You'll notice the code returns almost immediately when you run these functions. That's because it's not actually doing any computation. So even if you have petabytes of data it will return in less than a second.
However, once you go to write your results out you'll notice it takes longer. This is due to lazy evaluation. It's not until you try to display or write results that your execution plan is actually run.
However, there is a catch here. Every time you try to display or write out results it runs the execution plan again. Let's look at the same block of code but extend it and do a few more operations.
The developer of this code may very well be thinking that they're just printing out results three times, but what they're really doing is kicking off the same processing three times. Oops. That's a lot of extra work. This is a very common mistake we run into. So why is there lazy evaluation, and what do we do about it?
In short, processing with lazy evaluation is way faster than without it. Databricks / Spark looks at the full execution plan and finds opportunities for optimization that can reduce processing time by orders of magnitude. So that's great, but how do we avoid the extra computation? The answer is pretty straightforward: save computed results you will reuse.
Let's look at the same block of code again, but this time let's avoid the recomputation:
This works especially well when Delta Caching is turned on. In short, you benefit greatly from lazy evaluation, but it's something a lot of customers trip over. So be aware of its existence and save results you reuse in order to avoid unnecessary computation.
Next blog: Design your tables well!
This is an incredibly important topic, but it needs its own blog. Stay tuned. In the meantime, check out this guide on Delta Lake best practices.
Get the latest posts in your inbox
Subscribe to our blog and get the latest posts delivered to your inbox.