Analyzing Okta Logs With Databricks Lakehouse Platform to Detect Unusual Activity
Learn how to connect Databricks to Okta to ingest System Logs, retain, and analyze for complete visibility using your Databricks Lakehouse Platform
Free Edition has replaced Community Edition, offering enhanced features at no cost. Start using Free Edition today.
With the recent social media reports of an Okta incident through a third party contractor, security teams ran to their logs and asked vendors like Databricks for detection and analytics advice. Prior to being notified by Okta that we were not among the potentially impacted customers, we used the Databricks Lakehouse for our own investigation. We would like to show how we performed that investigation and share both insights and technical details. We will also provide notebooks that you can import into your Databricks deployment or our community edition to ingest your Okta logs so that by the end of this blog, you can perform the same analysis for your company.
Background
Okta is a market-leading cloud-based identity platform used for Single Sign-on (SSO) authentication and authorization, multi-factor authentication, and user management services with their customers' enterprises or business applications.
In January 2022 hackers gained access to an endpoint (user system) owned and operated by a third-party organization providing support services to Okta customers. These actors were potentially able to perform actions as if they were the employee assigned to that endpoint. Like most organizations, Databricks immediately launched an investigation into the incident, analyzing several years of Okta data we have stored in our Lakehouse. We built our own queries, but we also found tremendous value in the posts and tweets from others in the industry.
Our favorite industry blog post was from Cloudflare. Two statements in particular resonated with our security team:
Even though logs are available in the Okta console, we also store them in our own systems. This adds an extra layer of security as we are able to store logs longer than what is available in the Okta console. That also ensures that a compromise in the Okta platform cannot alter evidence we have already collected and stored.
Thanks to this approach, they were able to “search the Okta System logs for any signs of compromise (password changes, hardware token changes, etc.). Cloudflare reads the system Okta logs every five minutes and stores these in our SIEM so that if we were to experience an incident such as this one, we can look back further than the 90 days provided in the Okta dashboard.”
Figure 1. Quote from industry post from Cloudflare
In the wake of the incident, many of our customers reached out to us asking if Databricks can help them ingest and analyze their Okta System Logs, and the answer is a resounding YES! The Databricks Lakehouse Platform lets you store, process and analyze your data at multi-petabyte scale, allowing for much longer retention and lookback periods and advanced threat detection with data science and machine learning. What’s more, you can even query them via your SIEM tool, providing a 360 view of your security events.
In this blog post, we will demonstrate how to integrate Okta System Logs with your Databricks Lakehouse Platform, and collect and monitor them. This integration allows your security teams far greater visibility into the authentication and authorization behaviors of your applications and end-users, and lets you look for specific events tied to the recent Okta compromise.
If your goal is to quickly get started, you can skip reading the rest of the blog and use these notebooks in your own Databricks deployment, referring to the comments in each section of the notebook if you get stuck.
Please read on for a technical explanation of the integration and the analysis provided in the notebooks.
About Okta System Logs
The Okta System Log records system events that are related to your organization in order to provide an audit trail that can be used to understand platform activity and diagnose problems. The Okta System Log API provides near real-time, read-only access to your organization's system log. These logs provide critical insights into user activity, categorized by Okta event type. Each event type represents a specific activity (e.g., login attempt, password reset, creating a new user). You can search on event types and correlate activity with other Okta log attributes such as the event outcome (e.g., SUCCESS or FAILURE), IP address, user name, browser type, and geographic location.
There are many methods to ingest Okta System Log events into other systems, but we are using the System Log API to retrieve the latest System Log events.
Lakehouse architecture for Okta System Logs
Databricks Lakehouse is an open architecture that combines the best elements of data lakes and data warehouses. We recommend the following lakehouse architecture for cybersecurity workloads, such as Okta System Log analysis:
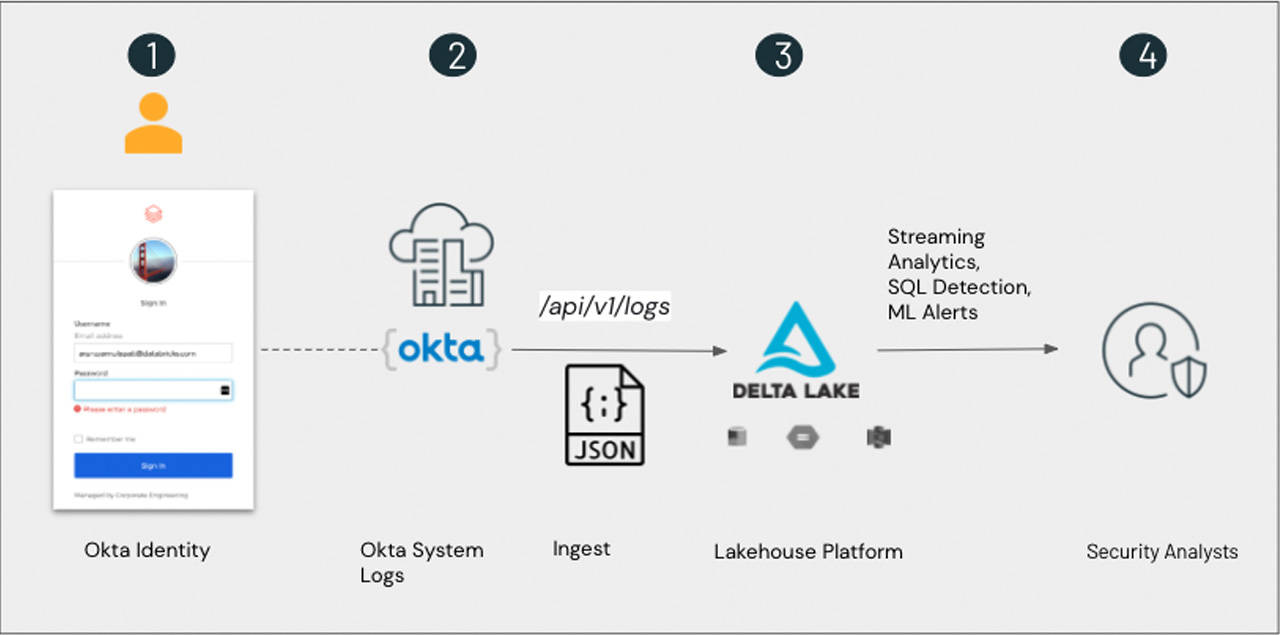
In the next sections, we’ll walk through how you can ingest Okta log attributes to monitor activity across your applications.
Ingesting Okta System Logs into Databricks Delta
If you are following along at work or home (or these days most often both) with this notebook, we will be using Delta Lake batch capability to ingest the data using Okta System Log API to a Delta table by fetching the list of ordered log events from your Okta organization's system log. We will be using the bounded requests type (bounded requests are for situations when you know the definite time frame of logs you want to retrieve).
For a request to be a bounded request, it must meet the following request parameter criteria:
Bounded requests to the /api/v1/logs API have the following semantics:
For performance, we are going to use an adaptive watermark approach: i.e query for the last 72 hours to find the latest ingest time; if we can't find something within that time frame, then we requery the whole table to find the latest ingest time. This is better than querying the whole table every time.
- Step 1: The Okta System Log records system events that are related to your organization in order to provide an audit trail that can be used to understand platform activity and to diagnose problems.
- Step 2: The Okta System Log API provides near real-time, read-only access to your organization's system log.
- Step 3: You can use the notebook provided to connect to Okta System Log API and ingest records into Databricks Delta automatically at short intervals (optionally, schedule it as a Databricks job).
- Step 4: At the end of this blog, and with the notebooks provided, you will be ready to use the data for analysis.
- since must be specified.
- until must be specified.
- The returned events are time filtered by their associated published field (unlike Polling Requests).
- The returned events are guaranteed to be in order according to the published field.
- They have a finite number of pages. That is, the last page doesn't contain a next link relation header.
- Not all events for the specified time range may be present — events may be delayed. Such delays are rare but possible.
Figure 3. Cmd 3 of “2.Okta_Ingest_Logs” notebook
We will construct an API request as below by using the Okta API Token, and break apart the records into individual JSON rows
Figure 4. Cmd 4 of “2.Okta_Ingest_Logs” notebook
Transform the JSON rows into a dataframe
Figure 5. Cmd 4 of “2.Okta_Ingest_Logs” notebook
Persist the records into delta table
Figure 6. Cmd 4 of “2.Okta_Ingest_Logs” notebook
As shown above the Okta data collection is less than 50 lines of code and you can run that code automatically at short intervals by scheduling it as a Databricks job.
Your Okta system logs are now in Databricks. Let’s do some analysis!
Analyzing Okta System Logs
For our analysis, we will be referring to the “System Log queries for attempted account takeover” knowledge content that the nice folks at Okta published along with their docs.
Okta Impersonation Session Search
Reportedly, it appears an attacker compromised the endpoint for a third-party support employee with elevated permissions (such as the ability to force a password reset on an Okta customer account). Customer security teams may want to start looking for a few events in the logs for any indications of compromise to their Okta tenant.
Let us start with administrator activity. This query searches for impersonation events reportedly used in the LAPSUS$ activity. User.session.impersonation are rare events, normally triggered when an Okta support person requests admin access for troubleshooting, so you probably won’t see many.
Figure 7. Cmd 4 of “3.Okta_Analytics” notebook
In the results, if you see a user.session.impersonation.initiate event (triggered when a support staff impersonates an admin) but no user.session.impersonation.grant event (triggered when an admin grants access to support), that is cause for a concern! We provided a detailed query in the notebooks that detects “impersonation initiations” that are missing a corresponding “impersonation grant” or “impersonation end”. You can review user.session.impersonation events and correlate that with legitimate opened Okta support tickets to determine if these are anomalous. See Okta API event types for documentation and Cloudflare’s investigation of the January 2022 Okta compromise for a real world scenario.
Okta Recent Employee who had Reset their Password or Modified their MFA
Now, let’s look for any employee account who had their password reset or modified their multi factor authentication (MFA) in any way since December 1. Event types within Okta that help with this search are: user.account.reset_password, user.mfa.factor.update, system.mfa.factor.deactivate, user.mfa.attempt_bypass, or user.mfa.factor.reset_all (you can look into Okta docs to capture more events to expand your analysis as needed). We’re looking for an “actor.alternateId” of [email protected] that appears when the Okta support organization initiates a password reset. Note that although we are also looking for the “Update Password” event below, Okta’s support representatives do not have the capability of updating passwords - they can only reset them.
Figure 8. Cmd 8 of “3.Okta_Analytics” notebook
If you see results from this query, you may have Okta user accounts which require further investigation - especially if they are privileged or sensitive users.
MFA Fatigue Attacks
Multi factor authentication (MFA) is among the most effective security controls at preventing account takeovers, but it isn’t infallible. It was reportedly abused during the Solarwinds compromise and by LAPSUS$. This technique is called an MFA fatigue attack or MFA prompt bombing. With it, an adversary uses previously stolen usernames and passwords to login into an account protected by push MFA and triggers many push notifications to the victim (typically to their phone) until they tire of the alerts and approve a request. Simple! How would we detect these attacks? We took inspiration from this blog post by James Brodsky at Okta to address just that.
Figure 9. Cmd 11 of “3.Okta_Analytics” notebook
Here is what the above query looks for: First, it reads in MFA push notification events and their matching success or failure events, per unique session ID and user. It then calculates the time elapsed during the login period (limited to 10 minutes), and calculates the number of push notifications sent, along with the number of push notifications responded to affirmatively and negatively. Then it makes simple decisions based on the combinations of results returned. If more than three pushes are seen, and a single successful notification is seen, then this could be something worth more investigation.
Recommendations
If you are an Okta customer, we recommend reaching out to your account team for further information and guidance.
We also suggest the following actions:
- Enable and strengthen MFA implementation for all user accounts.
- Ingest and store Okta logs in your Databricks Lakehouse.
- Investigate and respond:
- Continuously monitor rare support-initiated events, such as Okta impersonation sessions, using Databricks jobs.
- Monitor for suspicious password resets and MFA-related events.
Conclusion
In this blog post you learned how easy it is to ingest Okta system logs into your Databricks Lakehouse. You also saw a couple of analysis examples to hunt for signs of compromise within your Okta events. Stay tuned for more blog posts that build even more value on this use case by applying ML and using Databricks SQL.
We invite you to log in to your own Databricks account or in Databricks Community Edition and run these notebooks. Please refer to the docs for detailed instructions on importing the notebook to run.
We look forward to your questions and suggestions. You can reach us at: [email protected]. Also if you are curious about how Databricks approaches security, please review our Security & Trust Center.
Acknowledgments
Thank you to all of the staff across the industry, at Okta, and at Databricks, who have been working to keep everyone secure.
Get the latest posts in your inbox
Subscribe to our blog and get the latest posts delivered to your inbox.