Using Enhanced Security Monitoring to Detect & Alert for Suspicious Activity on Your Databricks Clusters
Databricks on AWS relies on custom machine images, AMIs, deployed as EC2 instances in the customer’s account. These EC2 instances provide the elastic compute for Databricks classic clusters. As part of our Enhanced Security Monitoring feature, we provide AMIs with advanced hardening and pre-installed security agents that customers can use for detection and alerting of suspicious activity. In this blog we cover some useful queries to detect suspicious activity based on some key Capsule8 alerts.
Using Databricks Workspace Audit Logs
First, customers need to have the Enhanced Security Monitoring (ESM) feature enabled. This can be done by contacting your Databricks representative. It’s also automatically part of our compliance security profile for HIPAA, PCI-DSS, and FedRAMP. Once ESM is enabled you should also configure your workspace audit log system tables to easily query them either via DBSQL or notebooks. It’s important to remember that ESM host logs are available only for classic compute.
Understanding Capsule8 Alerts
Databricks has enabled specific Capsule8 detections on ESM which are documented on our site. It’s important to note these events do not inherently signal that a compromise has occurred. Most of the events are informational and should be used to support an investigation should one of the higher-confidence alerts trigger.
For this example, we will focus on a subset of the overall alerts that tend to be higher-confidence, but customers should work with their security teams to prioritize which detections are most significant to their environment. For instance, an alert may trigger when a user legitimately installs a new certificate authority in the runtime container. This is a fairly normal practice for many organizations in order to ensure connectivity to internal endpoints using a private CA. However, if you know for certain that users have no reason to be modifying the certificate store, then that could be something you consider alerting on.
In this case, we are focusing primarily on events such as container escapes, kernel exploits, and suspicious changes to the host OS that could impact the security and stability of the host. Because of the nature of Databricks clusters, user code does not have access to the host OS, so alerts such as these could be good indicators of suspicious activity on the host or malicious users on the platform.
The 4 main categories of events we’ll be focusing on are:
* Container Security
Given user code runs in unprivileged containers, a container escape would certainly be a significant event that could compromise the security of a cluster. In particular, on Unity Catalog clusters shared by multiple users, a container escape could lead to a data leak or other exposure.
* Kernel Related Events
These types of kernel related events could point to something malicious on the host or as a follow-on from a container escape.
* Host Security Changes
Changes to host security configurations such as AppArmor, boot files, or changes to schedule tasks would be unusual and should be investigated.
* Other Suspicious Activity
Other events are related to suspicious shell and networking activity on the host we wouldn’t expect to see in normal usage.
Monitoring Capsule8 Alerts
We’ll show how to monitor for Capsule8 alerts using DBSQL Alerts, but customers can of course use any log monitoring tool. In this case, we apply detections as DBSQL Alerts directly on the audit log system tables. The alerts run on a recurring schedule and can be configured to send notifications via email, webhook, PagerDuty, Slack, or other destinations.
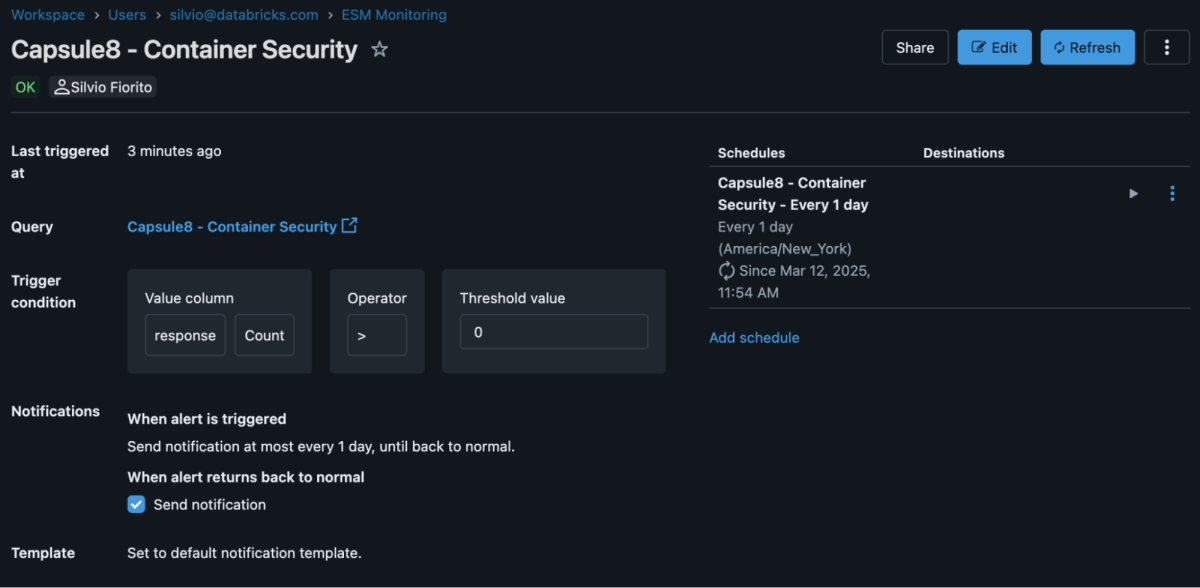
Container Security
Changes to Host Security Settings
Kernel Related Events
Suspicious Activity on the Host
To automate the deployment of the queries, alerts, and scheduled workflow, you can run the following code:
The lineage of the Capsule8 events can be used for finding the source of the event, such as whether it was executed by a user in a notebook or a process on the host. We can use the example of 'Root Certificate Store Modified', which can be triggered from legitimate changes made in the runtime container. This event, when triggered from a user command, would clearly show the lineage as originating from the runtime container. The Capsule8 events include the AWS instance id for the host that triggered the alert. We can use this instance id to correlate with other logs such as CloudTrail or VPC flow logs. In addition to infrastructure logs, verbose audit logs can also be used by analysts to review notebook commands as part of an investigation into any Capsule8 alerts or other incidents.
Conclusion
With Enhanced Security Monitoring, Databricks customers gain additional visibility into the security of the infrastructure supporting their deployment. With a few simple queries we can easily alert on and investigate any potentially suspicious activity.
To enable Enhanced Security Monitoring, please contact your Databricks representative.
Get the latest posts in your inbox
Subscribe to our blog and get the latest posts delivered to your inbox.