Monitoring Notebook Command Logs With Static Analysis Tools
Background
Code review and static analysis tools are standard practices in the Software Development Lifecycle (SDLC). Static analysis tools help developers find code quality issues, ensure adherence to coding standards, and identify possible security issues. In an interactive notebook environment where users run ad-hoc commands iteratively, there isn't a well defined pattern for applying these standard SDLC practices. However, as users might be working with highly sensitive data, we still want to monitor that proper security best practices are being applied just as we would for automated production pipelines.
Note that given the nature of the Databricks platform, not all common software security issues are relevant. Using OWASP Top 10 as a starting point, issues such as cross-site scripting or other injection attacks don't make sense since users are not running web applications in their notebooks.
Manual code review or "spot-checks" of notebook code is possible, but not scalable since there may be dozens to hundreds of users on the platform running thousands of commands per day. We need a way to automate these checks to find the most critical issues. The introduction of Databricks verbose notebook audit logs allows us to monitor commands run by users and apply the detections we want in a scalable, automated fashion. In this document, we share one example of using a Python static analysis tool to monitor for common security issues such as mishandling credentials and secrets. To be clear, automated static analysis tools help us scale these types of checks but are not a replacement for proper security controls such as data loss protections and access controls.
In this article, we will not discuss how to configure audit logs, as that is covered in our documentation (AWS, GCP, Azure). For AWS, we've also previously published a blog post with example code to do this.
Monitoring notebook command logs
The workspace audit log documentation includes details on enabling verbose audit logs and the additional events supplied for notebook commands. Once the events are included in your audit logs you can begin monitoring them and applying some detections. While we can certainly apply simple text-based comparisons using regular expressions or searching for specific keywords in the individual commands, this has several limitations. In particular, simple text searches will miss control and data flow. For example, if a user assigns a credential from a secret scope to a variable in one command, then later on writes that value to a file or logs it in another command, a simple text search will be unable to detect it.
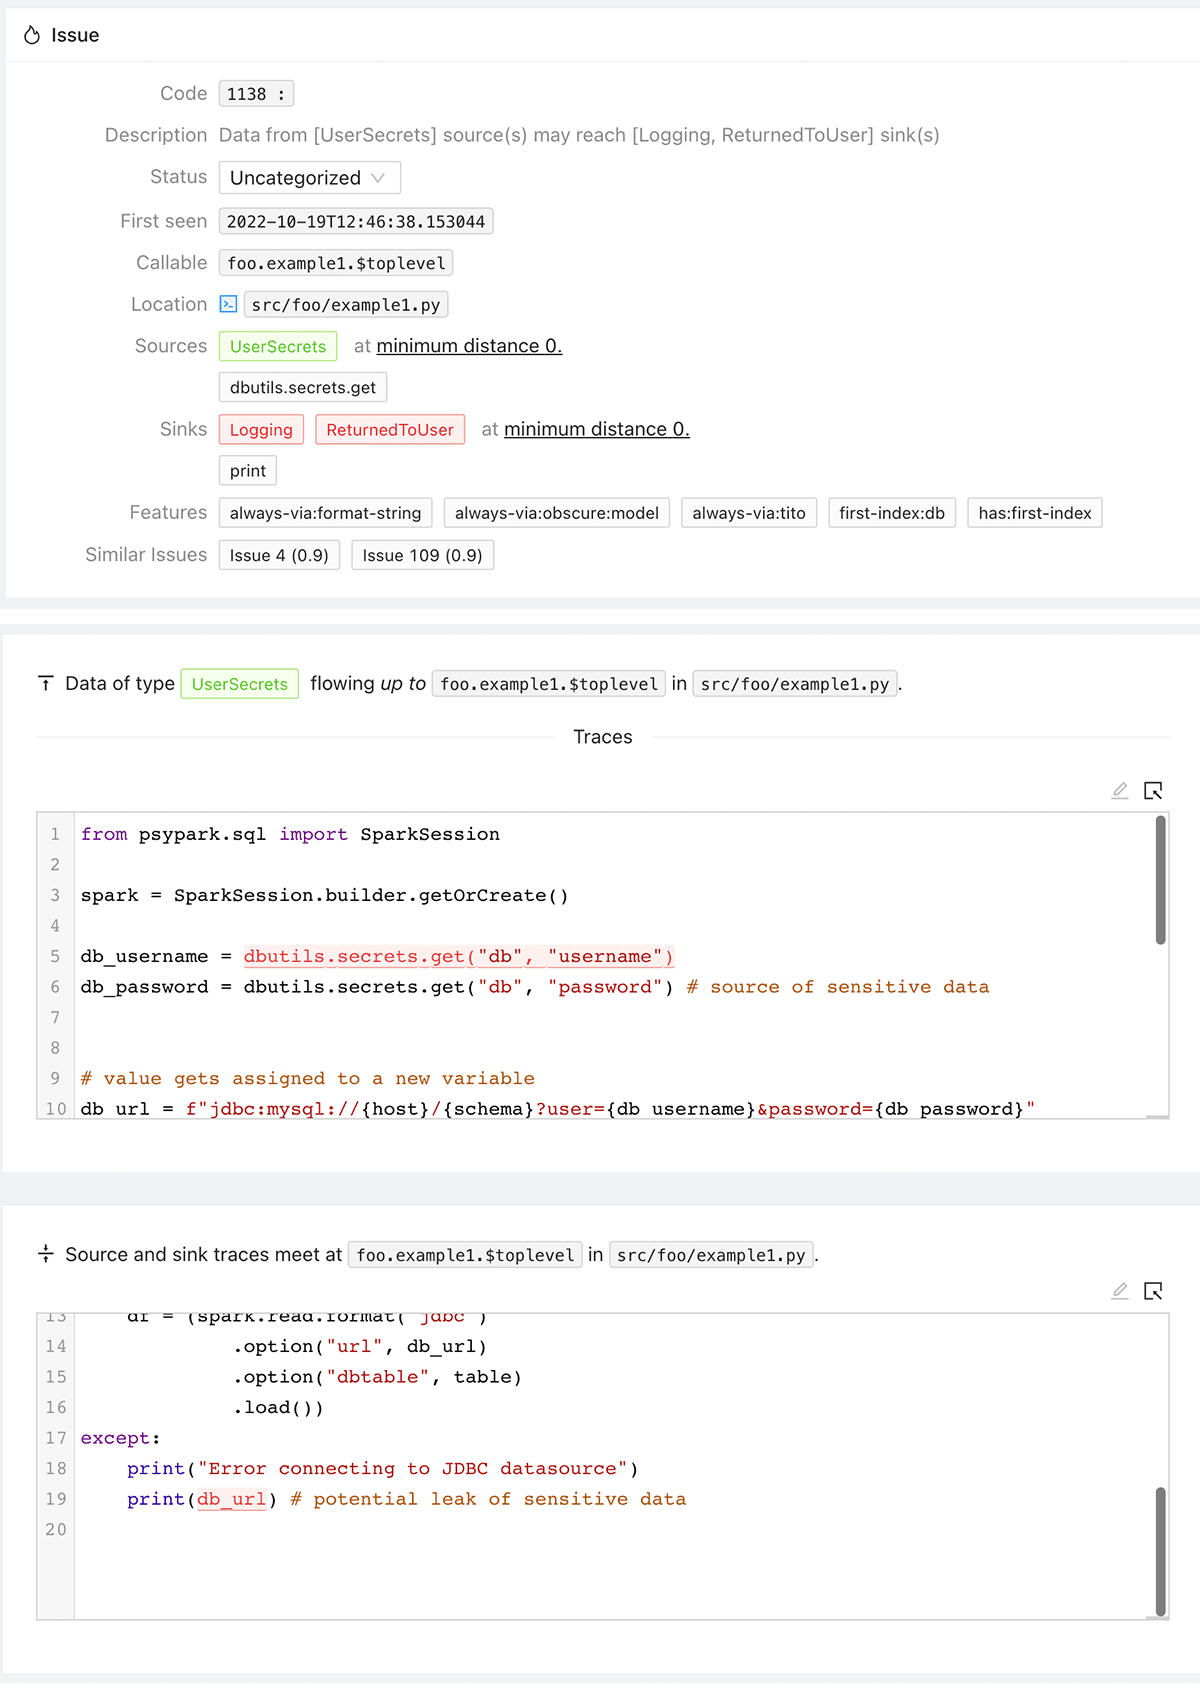
In the example below, the user reads JDBC credentials from Secret Scopes and attempts to load a DataFrame from the database. In the event of an error, the connection string with embedded credentials is written to output. This is a bad practice as those credentials will now leak into logs. A simple text search would not be able to reliably trace the password from the source to the "sink" which is printing to output.
However, a static analysis tool with control and data flow analysis can do this easily and reliably to alert us to the potential risk. An open source project called Pysa, a part of the Pyre project, provides Python static analysis with the ability to define custom rules for the types of issues we want to detect. Pyre is a very capable tool with lots of features, we will not go into all the details in this document. We recommend that you read the documentation and follow the tutorials for more information. You can also use other tools if you prefer, including other languages such as R or Scala. The process explained in this document should apply to other tools and languages.
Before running the static analysis we need to group the commands run in the notebook so whatever tool we're using can build a proper call graph. This is because we want to maintain the context of what commands were run and in what order so the code can be analyzed properly. We do this by ordering and sessionizing the commands run for each notebook. The audit logs give us the notebook_id, command_id, command_text, and a timestamp. With that we can order and group the commands executed within a session. We'll consider the start of a session when a notebook is first attached to a cluster until the cluster terminates or the notebook is detached. Once the commands are grouped together and ordered, we can pass the code to the static analysis tool.
Most tools expect the code to scan to be files on disk. We do this by taking the commands we sessionized then writing them to temporary files that are scanned by Pyre. For Pyre, we also need to configure certain items such as the rules we want to apply and describing the source and sink of sensitive data. For instance, Pyre does not know anything about Databricks secret scopes, so we describe the API as being a source of user credentials. This then allows the tool to track those credentials to any potential sinks that should be alerted on, such as a print or logging statement. We've provided a set of example scripts and configurations for Pyre and Pysa as a starting point, but you should define your own rules as needed.
Below, you can see an example of Pysa taint annotation rules we defined for Databricks utilities:
Some examples of the alerts we enabled are as follows:
Hardcoded Credentials
Users should not be using hardcoded, cleartext credentials in code. This includes AWS IAM credentials that are set in Spark properties or other libraries. We do this using a literal string comparison that identifies these values as credentials which get tracked to APIs that take authentication parameters. Using credentials in this manner can easily lead to leaks in source control, logs, or just from sharing access to notebooks with other unauthorized users. If you get alerted to this issue, the credentials should be revoked and the code updated to remove the hardcoded values.
Credential Leaks
If users have either hardcoded credentials or using secret scopes, they should not be logging or printing out these values as that could expose them to unauthorized users. Also, credentials should not be passed as parameters to notebook workflows as that will cause them to appear in logs or possibly be visible to unauthorized users. If this is detected then those credentials should be revoked and the code updated to remove the offending code. For notebook workflows, rather than passing secrets you can pass a scope name as a parameter to the child notebook.
Insecure Configuration
Databricks clusters normally have cluster-scoped credentials, such as Instance Profiles or Azure service principal secrets. With Unity Catalog, we actually do away with this notion in favor of scoped-down, temporary, per-user tokens. However, if users are setting credentials programmatically such as in the SparkSession configuration, global Hadoop configuration, or DBFS mounts, we may want to alert on that as it could lead to those credentials being shared across different users. We recommend cluster-scoped credentials or Unity Catalog instead of dynamically setting credentials at runtime.
Reviewing Scan Results
Once the scan is completed, a report will be generated with the results. In the case of Pysa this is a JSON file that can be parsed and formatted for review. In our example we provide an embedded report with links to the notebooks which may have issues to review. Pysa reports can also be viewed with the Static Analysis Post Processor (SAPP) tool that is part of the Pyre/Pysa project. To use SAPP with the output you will need to download the JSON output files from the cluster to your local machine where you can run SAPP. While the notebook command logs provide us a view of the code run at that point in time, the code or the notebook itself may have changed or been deleted.
We've provided a Databricks repo with code and example Pyre configurations you can start with. You should customize the rules and configuration based on your security requirements.
For more information about Databricks security, please visit our Security & Trust Center or contact security@databricks.com.
Get the latest posts in your inbox
Subscribe to our blog and get the latest posts delivered to your inbox.