Streaming in Production: Collected Best Practices, Part 2
by Angela Chu and Tristen Wentling
In our two-part blog series titled "Streaming in Production: Collected Best Practices," this is the second article. Here we discuss the "After Deployment" considerations for a Structured Streaming Pipeline. The majority of the suggestions in this post are relevant to both Structured Streaming Jobs and Delta Live Tables (our flagship and fully managed ETL product that supports both batch and streaming pipelines).
The previous issue "Before Deployment" is covered in Collected Best Practices, Part 1 - if you haven't read the post yet, we suggest doing so first.
We still recommend reading all of the sections from both posts before beginning work to productionalize a Structured Streaming job, and hope you will revisit these recommendations again as you promote your applications from dev to QA and eventually production.
After deployment
After the deployment of your streaming application, there are typically three main things you'll want to know:
- How is my application running?
- Are resources being used efficiently?
- How do I manage any problems that come up?
We'll start with an introduction to these topics, followed by a deeper dive later in this blog series.
Monitoring and Instrumentation (How is my application running?)
Streaming workloads should be pretty much hands-off once deployed to production. However, one thing that may sometimes come to mind is: "how is my application running?". Monitoring applications can take on different levels and forms depending on:
- the metrics collected for your application (batch duration/latency, throughput, …)
- where you want to monitor the application from
At the simplest level, there is a streaming dashboard (A Look at the New Structured Streaming UI) and built-in logging directly in the Spark UI that can be used in a variety of situations.
This is in addition to setting up failure alerts on jobs running streaming workloads.
If you want more fine-grained metrics or to create custom actions based on these metrics as part of your code base, then the StreamingQueryListener is better aligned with what you're looking for.
If you want the Spark metrics to be reported (including machine level traces for drivers or workers) you should use the platform's metrics sink.
Another point to consider is where you want to surface these metrics for observability. There is a Ganglia dashboard at the cluster level, integrated partner applications like Datadog for monitoring streaming workloads, or even more open source options you can build using tools like Prometheus and Grafana. Each has advantages and disadvantages to consider around cost, performance, and maintenance requirements.
Whether you have low volumes of streaming workloads where interactions in the UI are sufficient or have decided to invest in a more robust monitoring platform, you should know how to observe your production streaming workloads.. Further "Monitoring and Alerting" posts later in this series will contain a more thorough discussion. In particular, we'll see different measures on which to monitor streaming applications and then later take a deeper look at some of the tools you can leverage for observability.
Application Optimization (Are resources being used effectively? Think "cost")
The next concern we have after deploying to production is "is my application using resources effectively?". As developers, we understand (or quickly learn) the distinction between working code and well-written code. Improving the way your code runs is usually very satisfying, but what ultimately matters is the overall cost of running it. Cost considerations for Structured Streaming applications will be largely similar to those for other Spark applications. One notable difference is that failing to optimize for production workloads can be extremely costly, as these workloads are frequently "always-on" applications, and thus wasted expenditure can quickly compound. Because assistance with cost optimization is frequently requested, a separate post in this series will address it. The key points that we'll focus on will be efficiency of usage and sizing.
Getting the cluster sizing right is one of the most significant differences between efficiency and wastefulness in streaming applications. This can be particularly tricky because in some cases it's difficult to estimate the full load conditions of the application in production before it's actually there. In other cases, it may be difficult due to natural variations in volume handled throughout the day, week, or year. When first deploying, it can be beneficial to oversize slightly, incurring the extra expense to avoid inducing performance bottlenecks. Utilize the monitoring tools you chose to employ after the cluster has been running for a few weeks to ensure proper cluster utilization. For example, are CPU and memory levels being used at a high level during peak load or is the load generally small and the cluster may be downsized? Maintain regular monitoring of this and keep an eye out for changes in data volume over time; if either occurs, a cluster resize may be required to maintain cost-effective operation.
As a general guideline, you should avoid excessive shuffle operations, joins, or an excessive or extreme watermark threshold (don't exceed your needs), as each can increase the number of resources you need to run your application. A large watermark threshold will cause Structured Streaming to keep more data in the state store between batches, leading to an increase in memory requirements across the cluster. Also, pay attention to the type of VM configured - are you using memory-optimized for your memory-intense stream? Compute-optimized for your computationally-intensive stream? If not, look at the utilization levels for each and consider trying a machine type that could be a better fit. Newer families of servers from cloud providers with more optimal CPUs often lead to faster execution, meaning you might need fewer of them to meet your SLA.
Troubleshooting (How do I manage any problems that come up?)
The last question we ask ourselves after deployment is "how do I manage any problems that come up?". As with cost optimization, troubleshooting streaming applications in Spark often looks the same as other applications since most of the mechanics remain the same under the hood. For streaming applications, issues usually fall into two categories - failure scenarios and latency scenarios.
Failure Scenarios
Failure scenarios typically manifest with the stream stopping with an error, executors failing or a driver failure causing the whole cluster to fail. Common causes for this are:
- Too many streams running on the same cluster, causing the driver to be overwhelmed. On Databricks, this can be seen in Ganglia, where the driver node will show up as overloaded before the cluster fails.
- Too few workers in a cluster or a worker size with too small of a core to memory ratio, causing executors to fail with an Out Of Memory error. This can also be seen on Databricks in Ganglia before an executor fails, or in the Spark UI under the executors tab.
- Using a collect to send too much data to the driver, causing it to fail with an Out Of Memory error.
Latency Scenarios
For latency scenarios, your stream will not execute as fast as you want or expect. A latency issue can be intermittent or constant. Too many streams or too small of a cluster can be the cause of this as well. Some other common causes are:
- Data skew - when a few tasks end up with much more data than the rest of the tasks. With skewed data, these tasks take longer to execute than the others, often spilling to disk. Your stream can only run as fast as its slowest task.
- Executing a stateful query without defining a watermark or defining a very long one will cause your state to grow very large, slowing down your stream over time and potentially leading to failure.
- Poorly optimized sink. For example, performing a merge into an over-partitioned Delta table as part of your stream.
- Stable but high latency (batch execution time). Depending on the cause, adding more workers to increase the number of cores concurrently available for Spark tasks can help. Increasing the number of input partitions and/or decreasing the load per core through batch size settings can also reduce the latency.
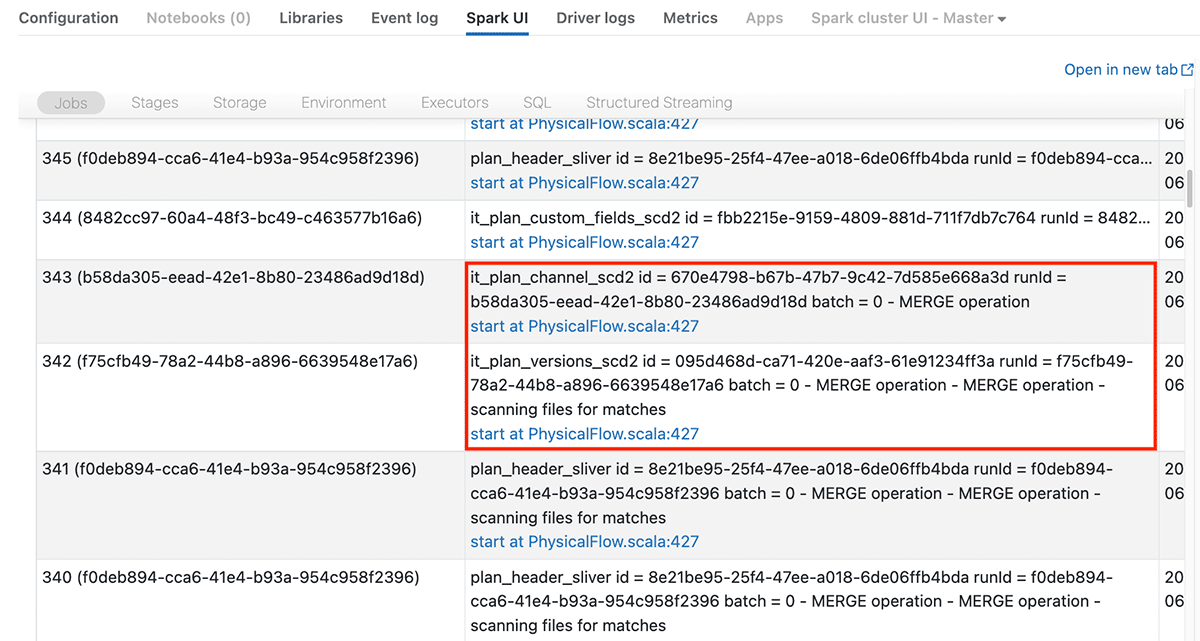
Just like troubleshooting a batch job, you'll use Ganglia to check cluster utilization and the Spark UI to find performance bottlenecks. There is a specific Structured Streaming tab in the Spark UI created to help monitor and troubleshoot streaming applications. On that tab each stream that is running will be listed, and you'll see either your stream name if you named your stream or <no name> if you didn't. You'll also see a stream ID that will be visible on the Jobs tab of the Spark UI so that you can tell which jobs are for a given stream.
You'll notice above we said which jobs are for a given stream. It's a common misconception that if you were to look at a streaming application in the Spark UI you would just see one job in the Jobs tab running continuously. Instead, depending on your code you will see one or more jobs that start and complete for each microbatch. Each job will have the stream ID from the Structured Streaming tab and a microbatch number in the description, so you'll be able to tell which jobs go with which stream. You can click into those jobs to find the longest running stages and tasks, check for disk spills, and search by Job ID in the SQL tab to find the slowest queries and check their explain plans.
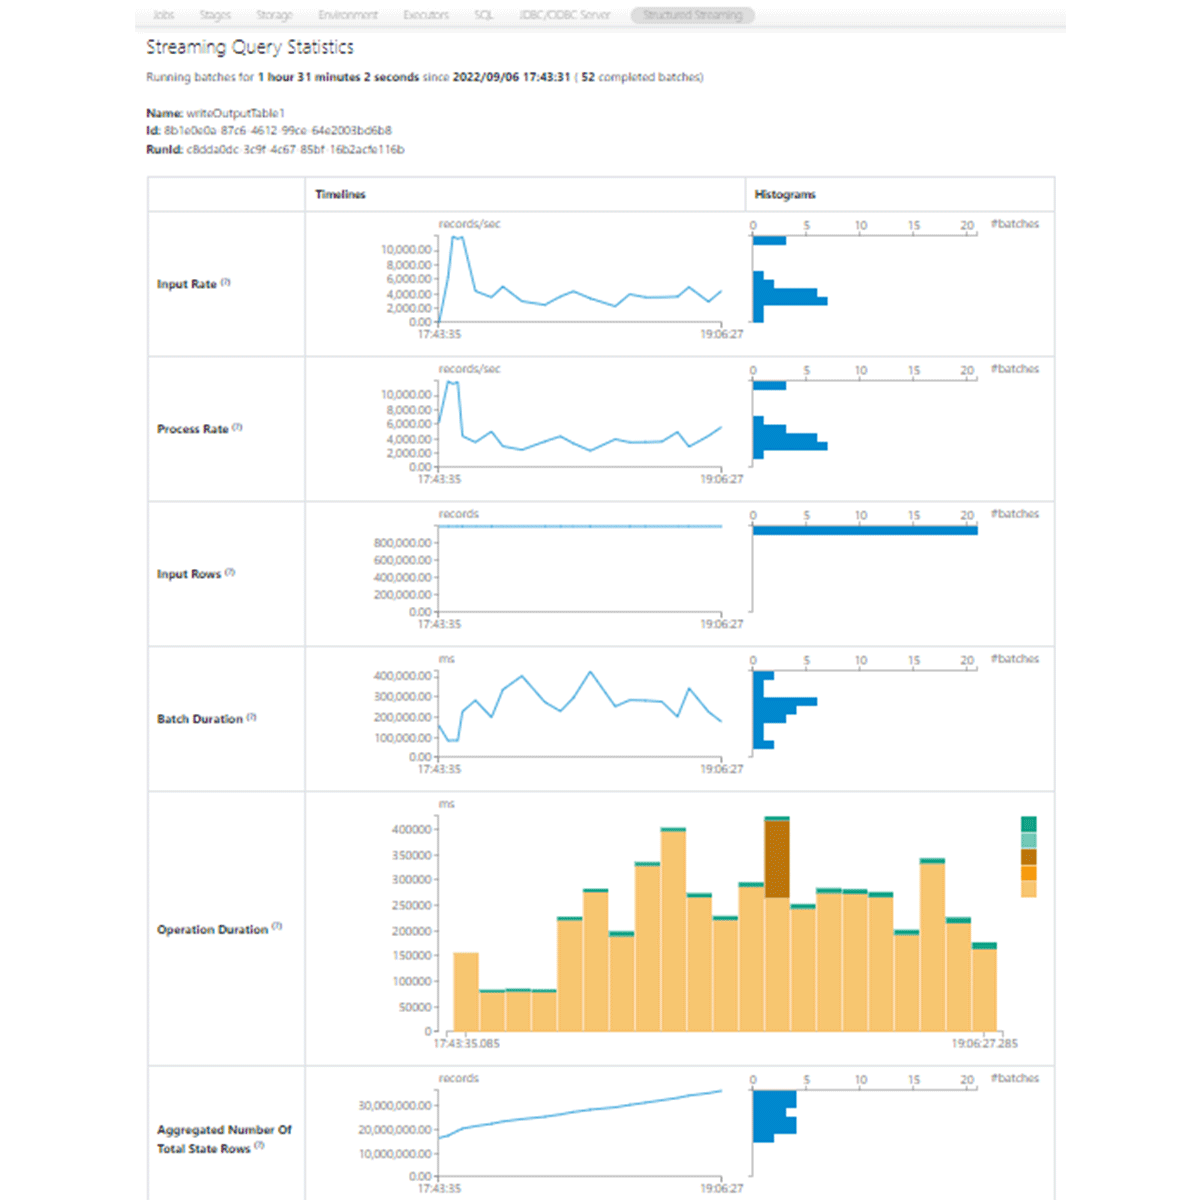
If you click on your stream in the Structured Streaming tab you'll see how much time the different streaming operations are taking for each microbatch, such as adding a batch, query planning and committing (see earlier screenshot of the Apache Spark Structured Streaming UI). You can also see how many rows are being processed as well as the size of your state store for a stateful stream. This can give insights into where potential latency issues are.
We will go more in-depth with troubleshooting later in this blog series, where we'll look at some of the causes and remedies for both failure scenarios and latency scenarios as we outlined above.
Conclusion
You may have noticed that many of the topics covered here are very similar to how other production Spark applications should be deployed. Whether your workloads are primarily streaming applications or batch processes, the majority of the same principles will apply. We focused more on things that become especially important when building out streaming applications, but as we're sure you've noticed by now the topics we discussed should be included in most production deployments.
Across the majority of industries in the world today information is needed faster than ever, but that won't be a problem for you. With Spark Structured Streaming you're set to make it happen at scale in production. Be on the lookout for more in-depth discussions on some of the topics we've covered in this blog, and in the meantime keep streaming!
Review Databricks' Structured Streaming in Production Documentation
Get the latest posts in your inbox
Subscribe to our blog and get the latest posts delivered to your inbox.