Building a Life Sciences Knowledge Graph with a Data Lake
This is a collaborative post from Databricks and wisecube.ai. We thank Vishnu Vettrivel, Founder, and Alex Thomas, Principal Data Scientist, for their contributions.
Pharmaceutical companies discover, develop, and commercialize groundbreaking drugs for some of the world's most serious diseases. A data-driven approach to R&D can increase the success rate for drug discovery as well as safer management of clinical trials. However, a key obstacle to this innovation is the inability to tap into all of the scientific information available faster than the pace of new data coming in.
R&D data often originates from millions of data points and thousands of sources. This includes high-throughput technologies such as genomics and proteomics, the growing use of electronic health records, and other digital sources of data. Availability of this data has driven a significant increase in published research in all areas of biomedical sciences. For pharmaceutical organizations, systematic analysis of these publications, also known as meta-analysis, plays a key role in evidence-based medicine that help accelerate R&D, optimize clinical trial design, and bring novel drugs to market faster.
Meta-analysis can result in a more precise estimate of the effect of treatment or risk factor for disease. It also provides a framework for comprehensive and quantitative review of a complex, and at times conflicting, body of research. In addition to meta-analysis, applying advanced analytics methods to a large body of literature can lead to novel knowledge discovery. For example, using predictive methods on an integrated knowledge-base can help identify informative genetic variants that could have been missed by the commonly used methods.
The stakes are high if pharmaceutical organizations fail to identify and integrate existing studies in their meta-analysis. That can lead to misleading conclusions, impeding R&D progress in a regulated research environment, delaying time-to-market. Reliance on legacy data platforms that don't scale and data silos are often contributing factors.
Organizations can extract meaningful insights that can result in novel drugs designed to help people live healthier lives by removing these barriers of scale. In this blog post we talk about few of these challenges in the context of Knowledge Discovery in biomedical research and discuss how a unified data and analytics approach can address these challenges.
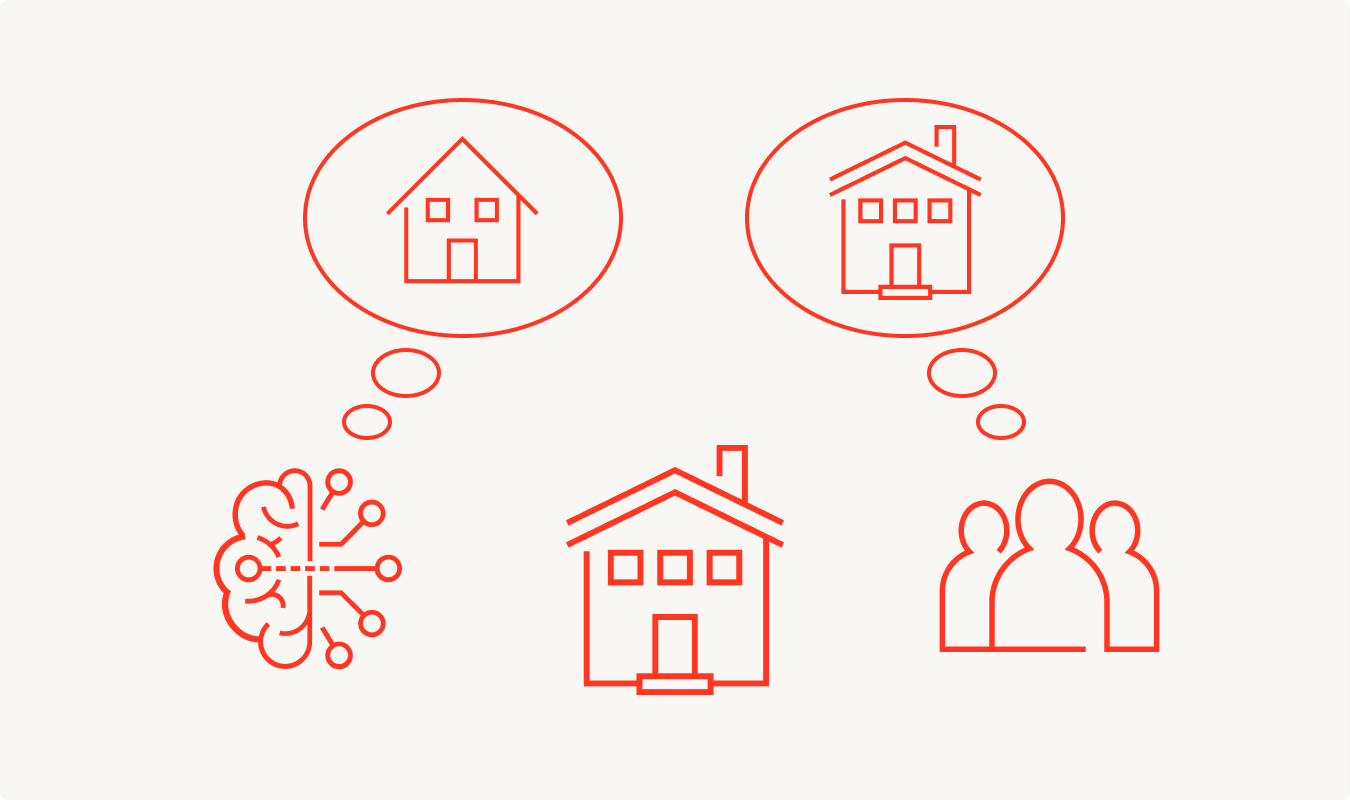
Challenge #1 (Connect): Creating semantic meaning from disjointed datasets
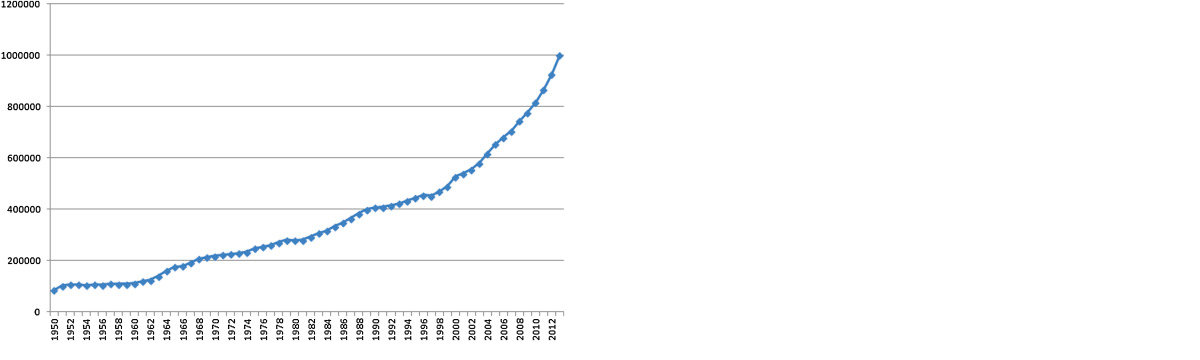
Biomedical research and clinical trials are perhaps some classical examples of the explosive growth in data volume in life sciences. During the period 2004–2013, more than 7.3 million journal articles were added to PubMed, a 48.9% increase from 2003
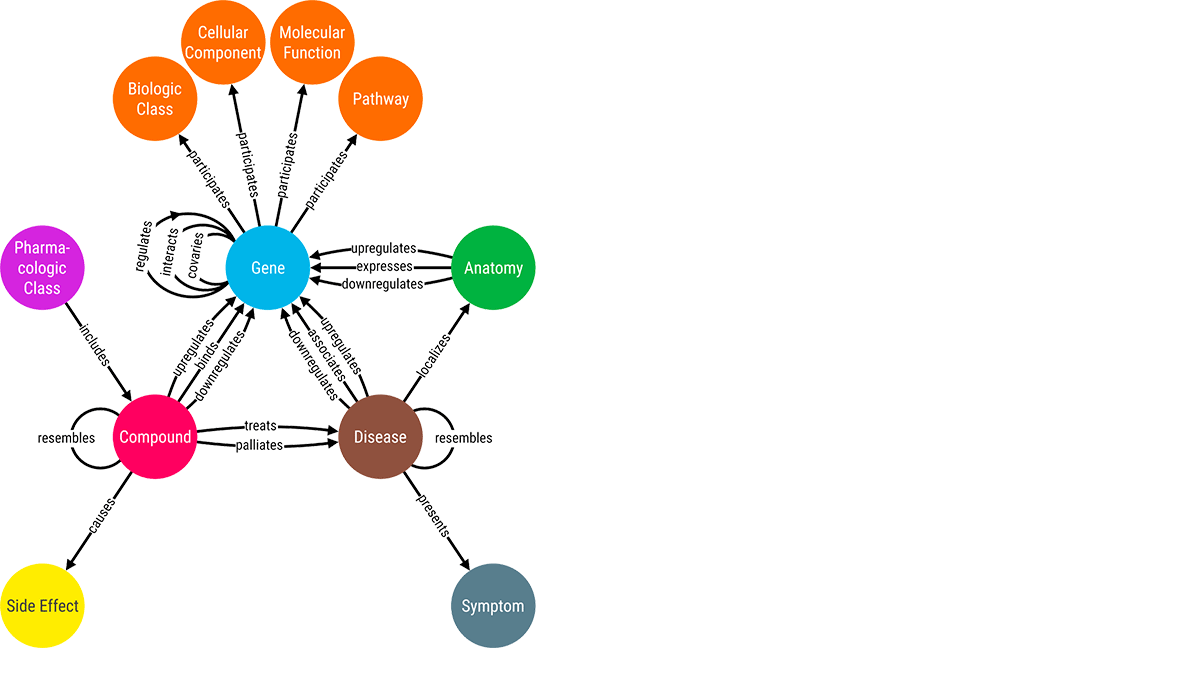
This is one of the main reasons Pubmed has adopted a controlled vocabulary like MeSH. In MEDLINE/PubMed, every journal article is indexed with about 10–15 subject headings, subheadings, and supplementary concept records, with some of them designated as major and marked with an asterisk, indicating the article's major topics.
At ClinicalTrials.gov, each trial has keywords that describe the trial. The ClinicalTrials.gov team assigns each trial two sets of MeSH terms. One set is for the conditions studied by the trial and the other is for the set of interventions used in the trial.
This allows researchers to speak a common language between different data sources with a shared understanding and semantics. Unfortunately, this semantic layer is often ignored in modern data lakes and is usually an afterthought.
Challenge #2 (Enrich): Augment and unlock hidden knowledge from the connected data.
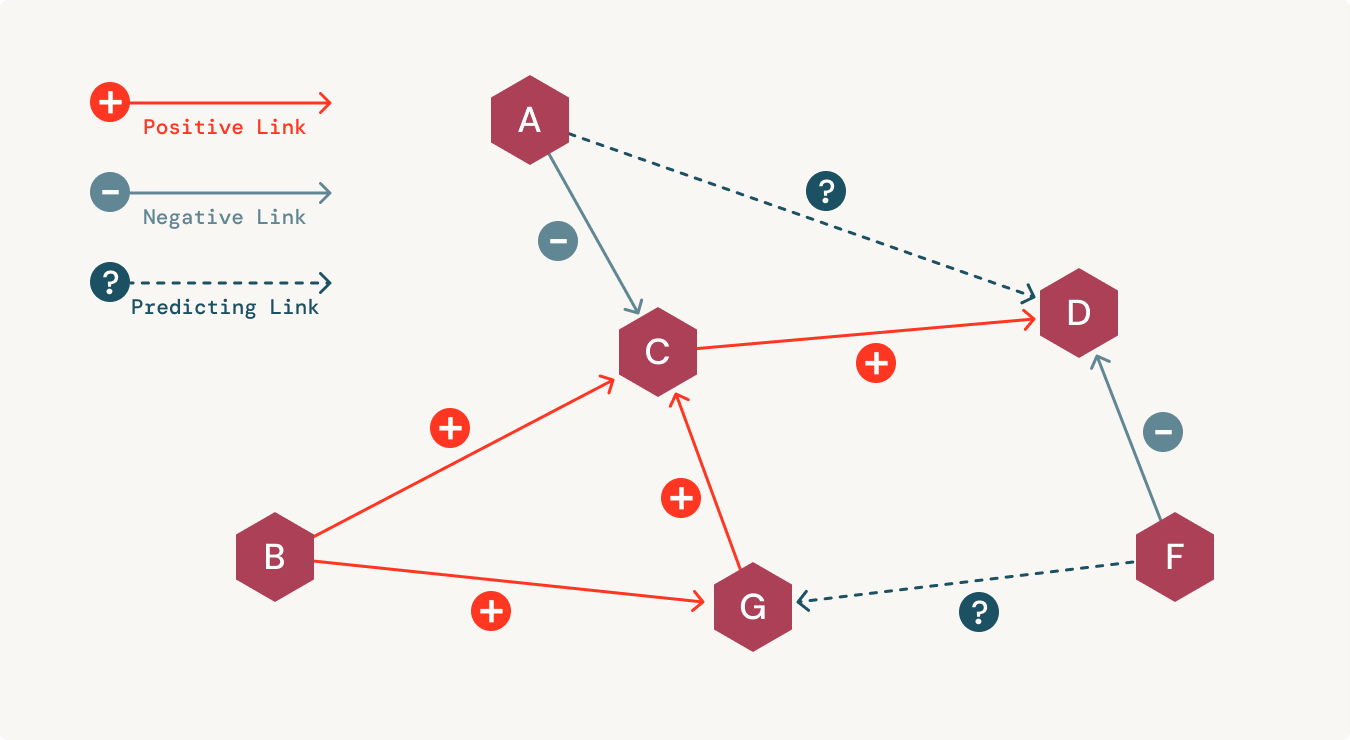
Integrating biomedical data in a connected manner helps in the quick retrieval of hidden insights. These semantic networks also help reduce errors and increase the chances of making a discovery in a cost-effective manner. For uncovering hidden correlations between medical data, analysts use different techniques like link prediction. By visually exploring these correlations between medical entities, scientists can make timely decisions on sensitive treatment options.
Additionally, organizations need to be able to model governance when bringing artificial intelligence (AI) and machine learning (ML) into a clinical setting. Unfortunately, most organizations have separate platforms for data science workflows that are disconnected from their data warehouse. This creates serious challenges when trying to build trust and reproducibility in AI-powered applications. This is where having an explainable and transparent representation of the data helps.
Challenge #3 (Discover): Access the connected graph to build insights and applications.
Once the data is centralized in a knowledge graph, we should be able to build powerful network analytics and predictive models directly on the graph.
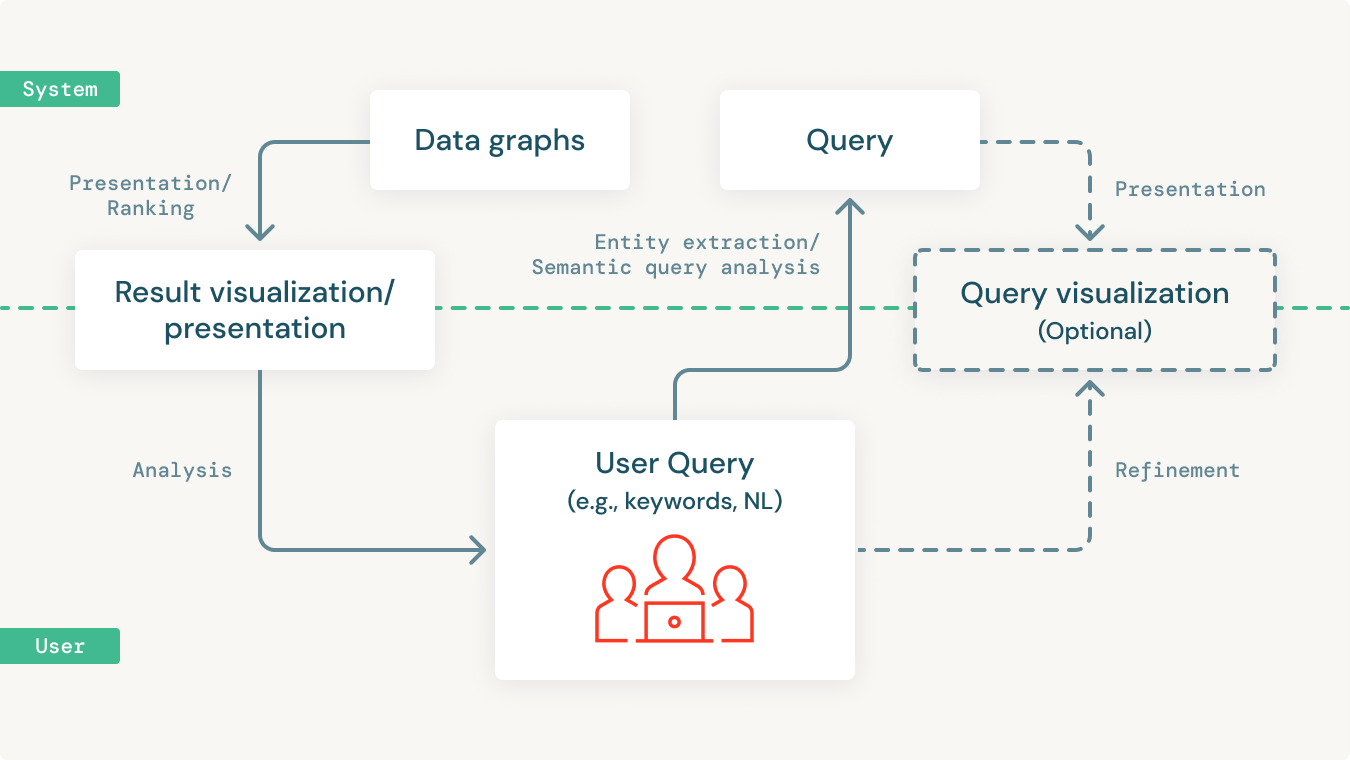
More importantly, we need to be able to make all of this data accessible to the majority of the people in the organization. The majority of people in any organization are not data practitioners. Which means they are not fluent in SQL or SPARQL or other data query languages. Given this, it's essential to provide querying and analytical capabilities using open standards like SPARQL. But more importantly, to allow these insights to be accessible by end-users who are not data-savvy in a simple and intuitive manner.
This is often an iterative process that involves users starting with a simple query and building on it to incrementally make it more complex to suit their more specific needs. Also, users might want to combine natural language keywords along with semantic entities to query the knowledge graph in powerful ways.
The querying tools need to support such complex, iterative query processes to be able to allow domain experts to incrementally query the knowledge graph to analyze and derive insights. Yet, many don't do this today.
Using Delta Lake to build a Knowledge Graph
In order to solve the challenges outlined above for healthcare and life sciences organizations, knowledge graphs can be an excellent solution to overcome them. However, there are various new obstacles to overcome to truly implement an enterprise-grade knowledge graph that handles ever-changing data and issues around data versioning, snapshots, reproducibility, and governance while still being scalable, flexible, and performant as your primary data lakehouse.
This is why we strongly believe the answer is not to build yet another siloed knowledge graph database, but instead to build on your data lake. Not only is this more cost-effective and less overhead for your data teams to build, maintain and manage, but also can be better for your end-users since it will avoid the typical problems with multiple data sources like data latency and sync issues.
Serving as the foundation is the Databricks Lakehouse platform, a modern data architecture that combines the best elements of a data warehouse with the low cost, flexibility, and scale of a cloud data lake. This simplified, scalable architecture enables healthcare organizations to bring together all their data—structured, semi-structured and unstructured—into a single, high-performance platform for traditional analytics and data science.
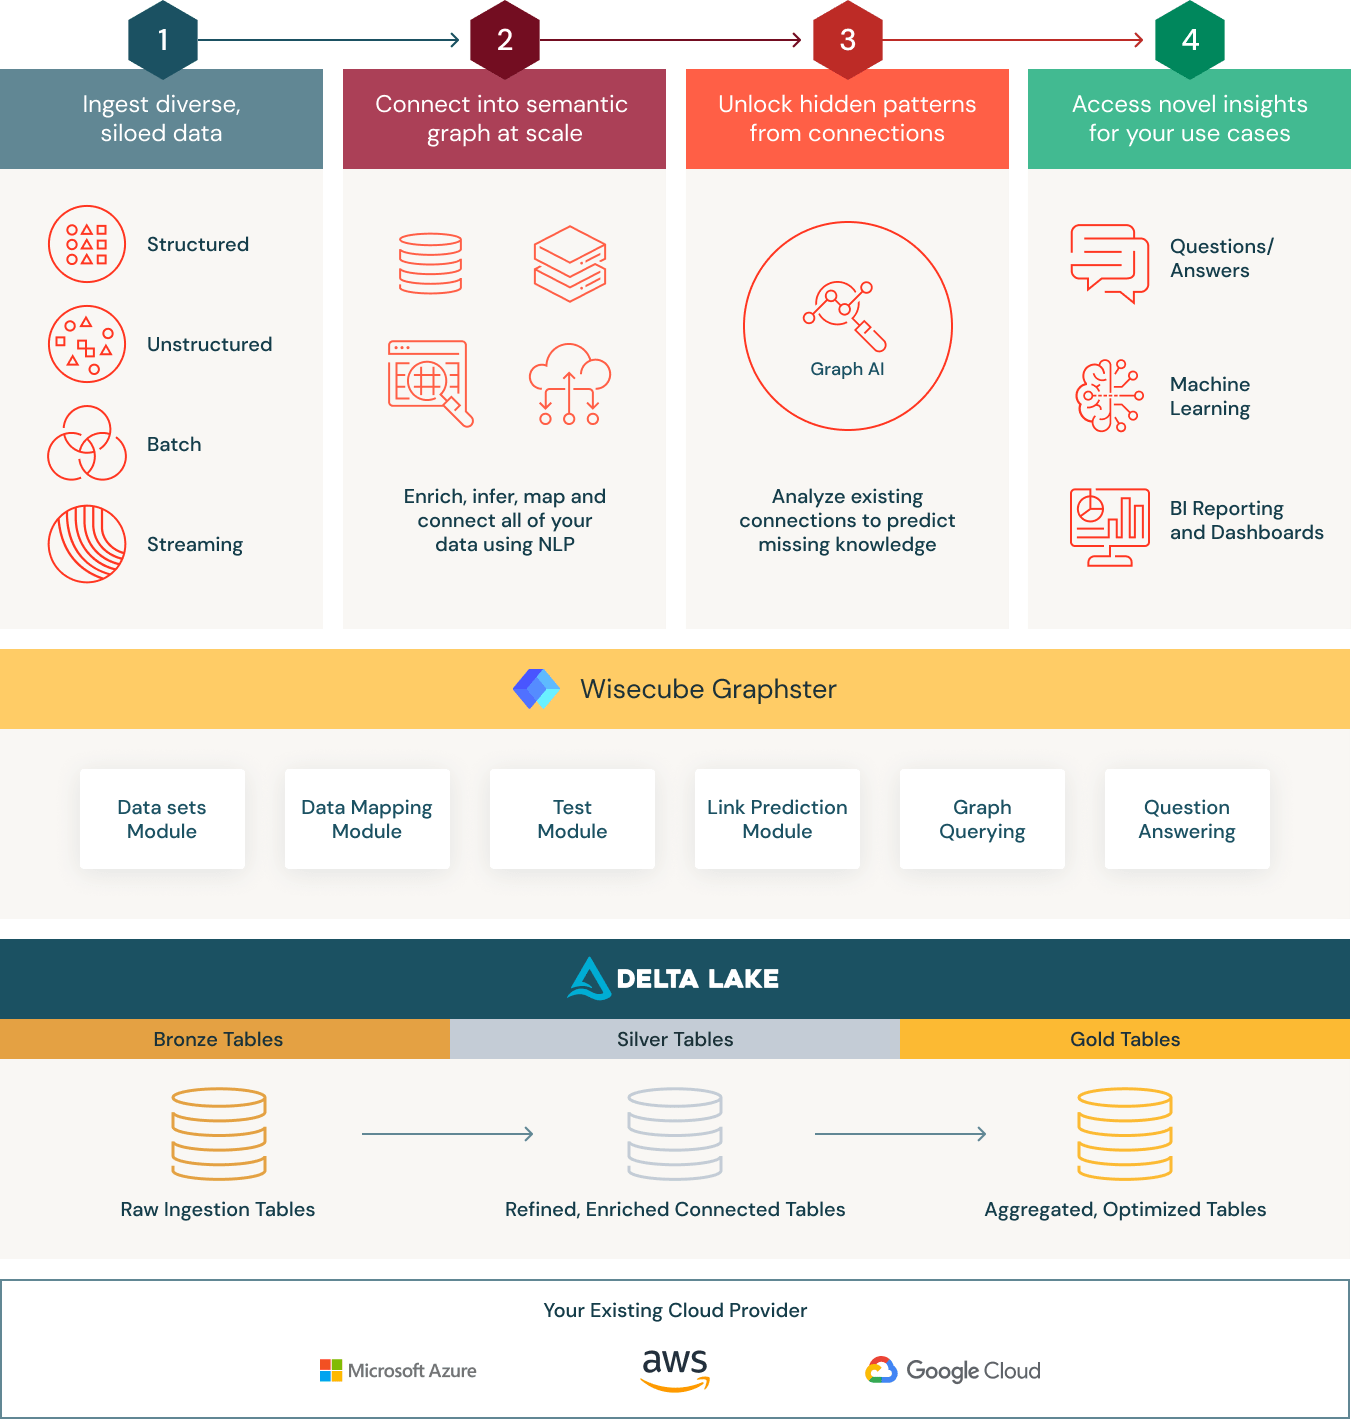
Specifically, Knowledge Graphs built on Delta Lake provide the following three main benefits for healthcare and life sciences organizations:
- Connect: Organize all your research and development data using a domain-specific yet flexible ontology. At the core of the Wisecube Knowledge Graph is Delta Lake, a data management layer that provides reliability and performance for your cloud data lake. Unlike a traditional data warehouse, Delta Lake supports all types of structured and unstructured data. To make ingesting data even easier, Wisecube has built connectors for R&D-specific data sets like clinical trials, MeSH, and others. Additionally, Wisecube provides built-in optimizations for graph querying and AI to significantly accelerate graph-based analytics. With these capabilities, teams can land all their raw data in a single place and then curate it to create a holistic view of all their biomedical data.
- Enrich: The Wisecube Knowledge Graph provides a unified architecture for structured and unstructured data. It also has modules that allow you to synthesize new insights through advanced network analytics like link prediction. Additionally, by running the knowledge graph entirely on Databricks, organizations can auto-scale based on workload.
- Discover: By marrying open standards like SPARQL with the capabilities of Databricks, organizations can support a wide range of highly impactful use cases, from drug discovery to chronic disease management programs. That makes Wisecube Knowledge Graph an ideal data store for managing healthcare and life sciences data.
Start building your Knowledge Graph for Healthcare and Life Sciences using Graphster and the Delta Lake
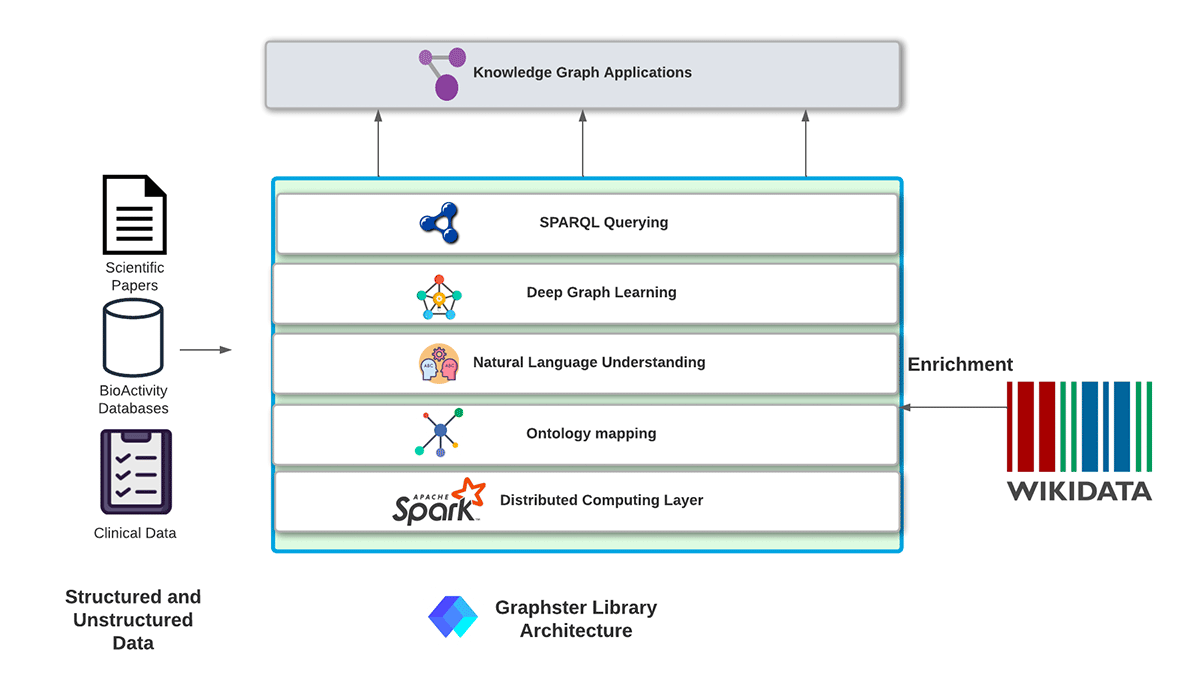
We are introducing a new Apache Spark-based open-source library: Graphster, purpose-built for scalable, end-to-end knowledge graph construction, analysis, and querying from unstructured and structured data. The graphster library takes a collection of documents, extracts mentions and relations to populate a raw knowledge graph, and then enriches the knowledge graph with facts from Wikidata. Once the knowledge graph is built, graphster can also help natively query the knowledge graph using SPARQL.
We are also pleased to make available Building a Knowledge Graph using Clinical Trials as a solution accelerator to help life sciences organizations get started building a knowledge graph for their specific needs. Our solution accelerator includes sample data, prebuilt code, and step-by-step instructions within a Databricks notebook. It shows you how to ingest clinical trial data, give it semantics by structuring the data using the MeSH ontology, and then analyze it at scale using SPARQL queries. To get started, check out the accelerator here.
Never miss a Databricks post
What's next?
Healthcare & Life Sciences
November 14, 2024/2 min read
Providence Health: Scaling ML/AI Projects with Databricks Mosaic AI

Product
November 27, 2024/6 min read