Claims Automation on Databricks Lakehouse
Smart claims increases efficiency by automating all aspects of claims processing from ingestion, analysis, and decision-making.
by Anindita Mahapatra and Marzi Rasooli
Introduction
According to the latest reports from global consultancy EY, the future of insurance will become increasingly data-driven, and analytics enabled. The recent focus on the cloud has improved access to advanced technological infrastructure, but most organizations still need help implementing and leveraging these capabilities. It's time to shift the focus on operationalizing services to realize value.
In today's economic circumstances, insurance companies face an ever-increasing number of challenges. Insurers are being forced to leverage data to their advantage and innovate at an accelerated pace. For personal P&C insurers, this means an increased focus on personalization and customer retention. Brand loyalty is at an all-time low, with customers continuously shopping for more competitive rates and better overall experiences, which increases the risk of churn. An increase in fraudulent claims further erodes profit margins. Insurers need to find additional ways to reduce costs and better manage risks.
Automating and optimizing the claims-handling process is one area that can significantly reduce costs through time saved and lesser reliance on human capital. Furthermore, effectively leveraging insights from data and advanced analytics can substantially reduce the overall exposure to risk.
The motivation behind the 'Smart Claims' solution accelerator is simple - improve the claims handling process to enable faster settlement, lower processing costs, and deliver quicker insights about potentially fraudulent claims; with the Lakehouse. Implementing the Lakehouse paradigm simplifies the current architectural landscape and sets the scene for future expansion across the organization. The accompanying assets can be found here.
Reference Architecture & Workflow
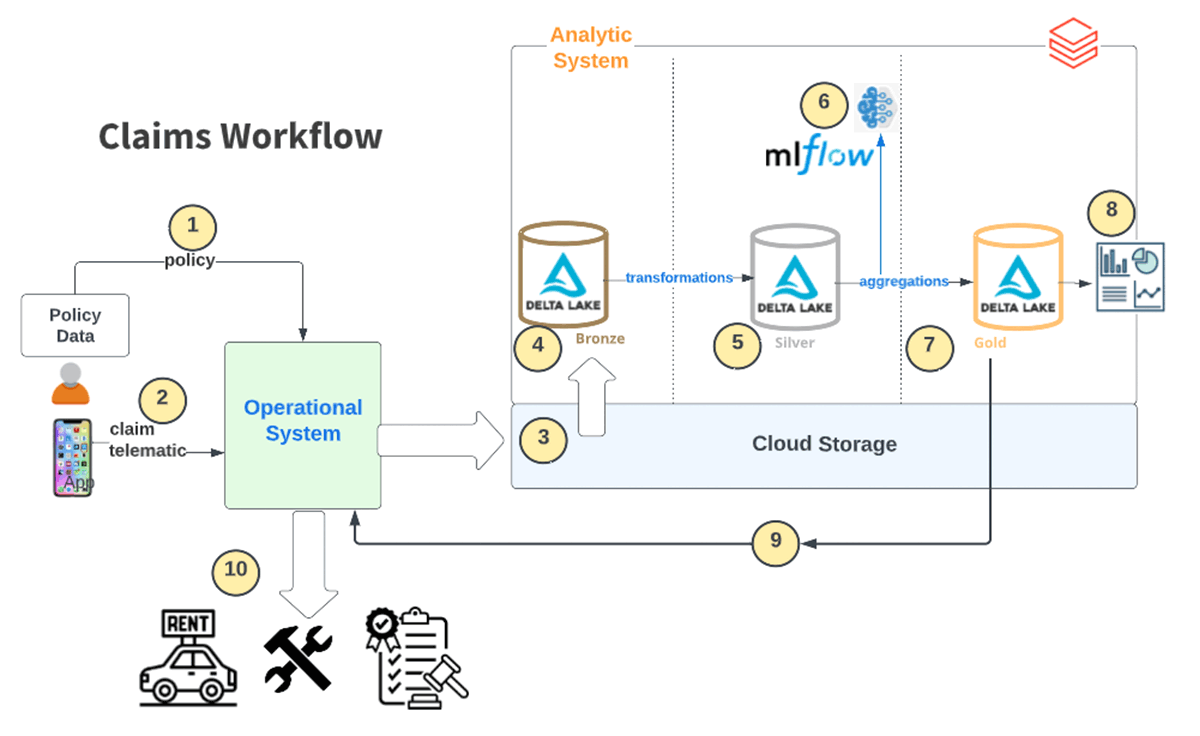
A typical claims workflow involves some level of orchestration between operational systems such as Guidewire and analytical systems like Databricks. The diagram below shows an example of such a workflow for an automotive insurer.
Automating and optimizing the claims handling process requires a deep understanding of customer interaction with operational systems and the various sources of information available for analysis.
In this example, we assume that customers primarily interact through a mobile application, and from there, they can submit claims and monitor the status of existing cases. This touch point offers vital information about customer behavior. Another important source of information is IoT devices installed in customer vehicles. Telematics data can be streamed to the operational and analytical systems, providing valuable insights into customer-driving behavior and patterns. Other external data sources may include weather and road conditions data that supplement the traditional data categories such as vehicle characteristics (make, model, year), driver characteristics and exposure/coverage (limits, deductibles)
Access to additional data sources can become increasingly important, especially in the absence of data from traditional sources such as credit bureaus. Credit scores from bureaus usually form the basis for risk modeling, assessing the exposure for drivers, which ultimately impacts their premiums. On the other hand, data from mobile applications and IoT devices provide a more personalized view of customer behavior, which could be used to create a more accurate indicator of the risk associated with a given party. This alternative, behavioral-based approach to risk modeling and pricing is essential for delivering a hyper-personalized customer experience.
The Lakehouse powered by Databricks is the only platform that combines all the required features and services to support a future-proof claims-handling process. From streaming to machine learning and reporting, Databricks offers the best platform to build an end-to-end solution for the insurance industry of tomorrow.
The following steps capture the overall flow:
- Policy data is ingested.
- Telematics data is continuously ingested from IoT sensors. A claimant submits claims data via a mobile app.
- All the operational data is ingested into cloud storage.
- This is incrementally loaded as 'Raw data' into Delta Bronze tables
- The data is wrangled and refined via various data transformations
- Data is scored using the trained model
- The predictions are loaded to a gold table
- The Claims Dashboard is refreshed for visualization
- The resulting insights are fed back to the operational system. This provides the feedback loop of pulling data from Guidewire and passing 'Next Best Action' back to Guidewire in real time to know which claims should be prioritized.
- The Claims Decisioning workflows use these generated insights to route the case appropriately. (Eg. approve repair expenses, rental reimbursement, or alert authorities)
How the Lakehouse Paradigm aids Smart Claims
The Databricks Lakehouse architecture enables all data personas (data engineers, data scientists, analytic engineers, and BI analysts) to work collaboratively on a single platform. Supporting all big-data workloads and paradigms (e.g., batch processing, streaming, DataOps, ML, MLOps, and BI) in a single, collaborative platform greatly simplifies the overall architecture, improves stability, and reduces cost significantly.
Databricks Delta Live Tables (DLT) pipelines offer a simple, declarative framework to develop and implement workloads quickly. It also provides native support for data quality management with granular constraints to guarantee the integrity of outputs.
ML and AI workloads can easily be created and managed with MLFlow for reproducibility and auditability. MLFlow simplifies the entire model lifecycle, from experimenting through model deployment, serving, and archiving. ML can be run on all types of data including unstructured data beyond text (images, audio, video, etc). In this solution, we will use computer vision capabilities to assess damage to the vehicle.
Finally, Databricks SQL provides a fast and efficient engine to query curated and aggregated data. These insights can then be packaged and served through interactive Dashboards within minutes.
Unity Catalog provides a multi-cloud, centralized governance solution for all data and AI assets including files, tables, machine learning models and dashboards with built-in search, discovery, automated workload lineage.
The diagram below shows a reference architecture for the Lakehouse in the context of typical insurance use cases:
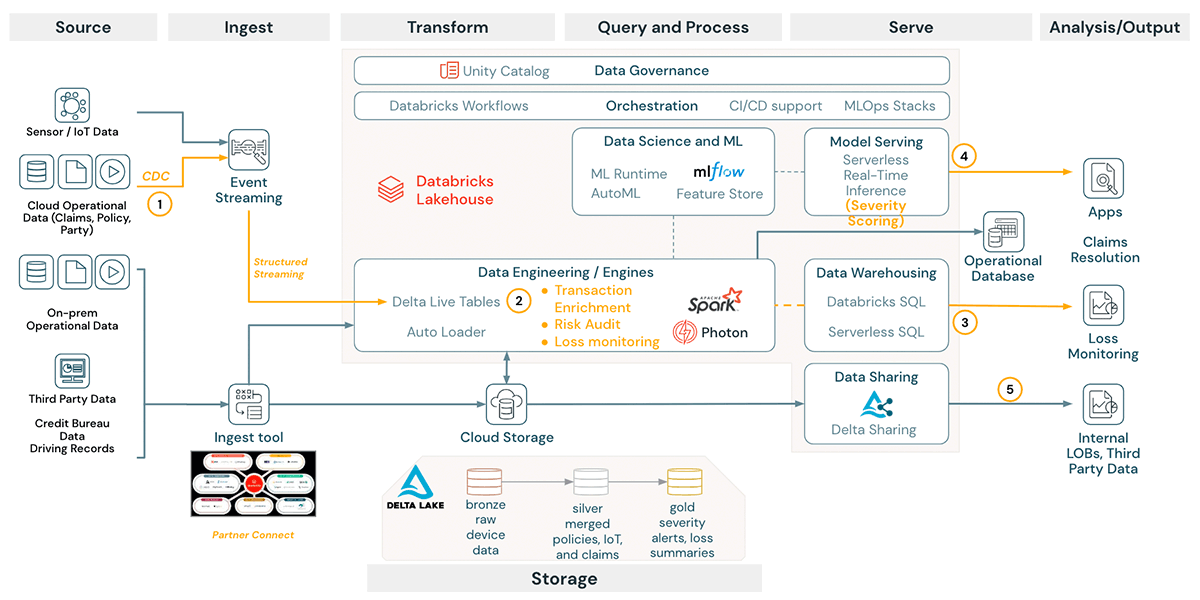
Data Ingestion using DLT and Muti-task Workflows
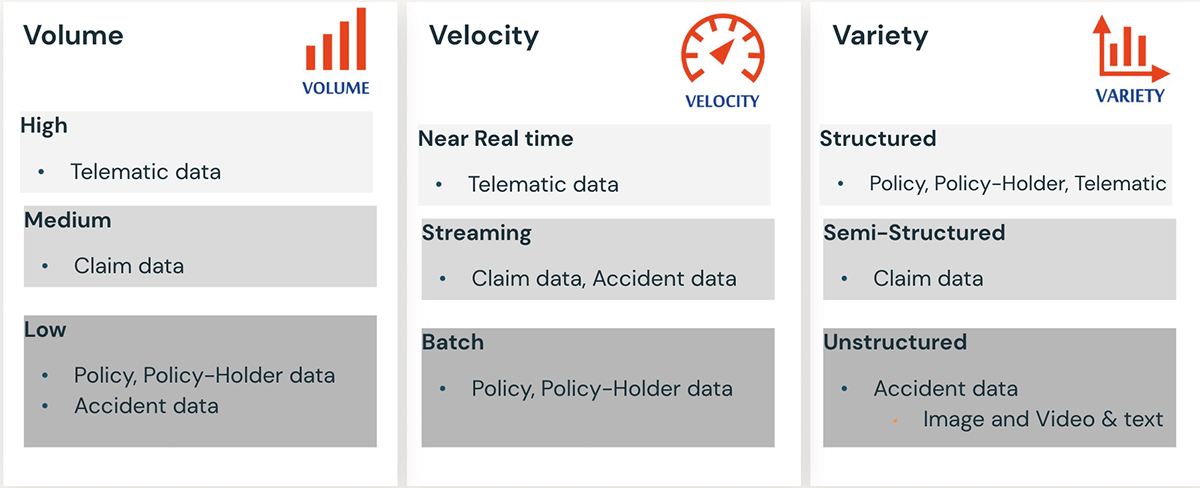
Automating the claims-handling process starts with optimizing the ingestion and data engineering workflow. The figure below offers a summary of the typical data sources encountered including structured, semi-structured and unstructured. Some sources are slower-moving, while others update more rapidly. Additionally, some sources might be additive, requiring appending, while others offer incremental updates and must be treated as slow-changing dimensions.
DLT can simplify and operationalize the data processing pipeline. The framework offers support for Auto Loader to facilitate ingestion from streaming sources, efficient auto-scaling to handle sudden changes in data volumes, and resiliency via a restart of task failure.
Databricks Workflows can accommodate multiple tasks and workloads (e.g., notebooks, DLT, ML, SQL). Workflows support repair-and-run and compute sharing across tasks - enabling robust, scalable, cost-effective workloads. Additionally, Workflow can easily be automated through schedules or programmatic invoking via REST APIs.
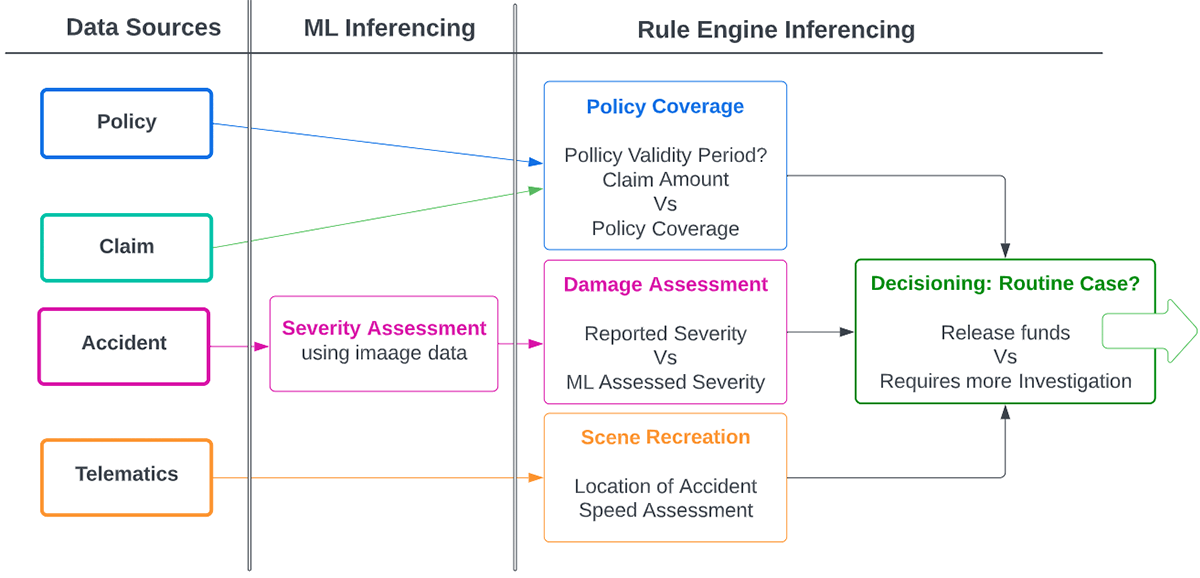
Insight Generation using ML & Dynamic Rules Engine
Leveraging ML is essential to uncovering previously unknown patterns, highlighting new insights, and flagging suspicious activity. However, combining ML and traditional rules-based approaches can be even more powerful.
Within the claims-handling process, ML can be used for several use cases. One example would be using computer vision and ML for assessing and scoring images submitted with vehicle insurance claims. Models can be trained to focus on the validity and severity of damages. Here, MLFlow can be crucial in simplifying the model training and serving process with its end-to-end MLOps capabilities. MLFlow offers a serverless model serving through REST APIs. Trained models can be operationalized and put into production with the click of a button.
On the other hand, rules engines offer flexible ways of defining known operational characteristics and statistical checks, which can be automated and applied without requiring human interaction. Flags are raised whenever data does not comply with preset expectations and are sent for human review and investigation. Incorporating such an approach with ML-based workflows offers additional oversight and significantly reduces the time claims investigators require to dissect and review flagged cases.
Insight visualization using Dashboards
In this example, we created two dashboards to capture critical business insights. The dashboards include the following:
- A Loss Summary dashboard for a high-level view of the overall business operations; and
- A Claims Investigation dashboard with a granular view of claims details to understand the specifics of a given case.
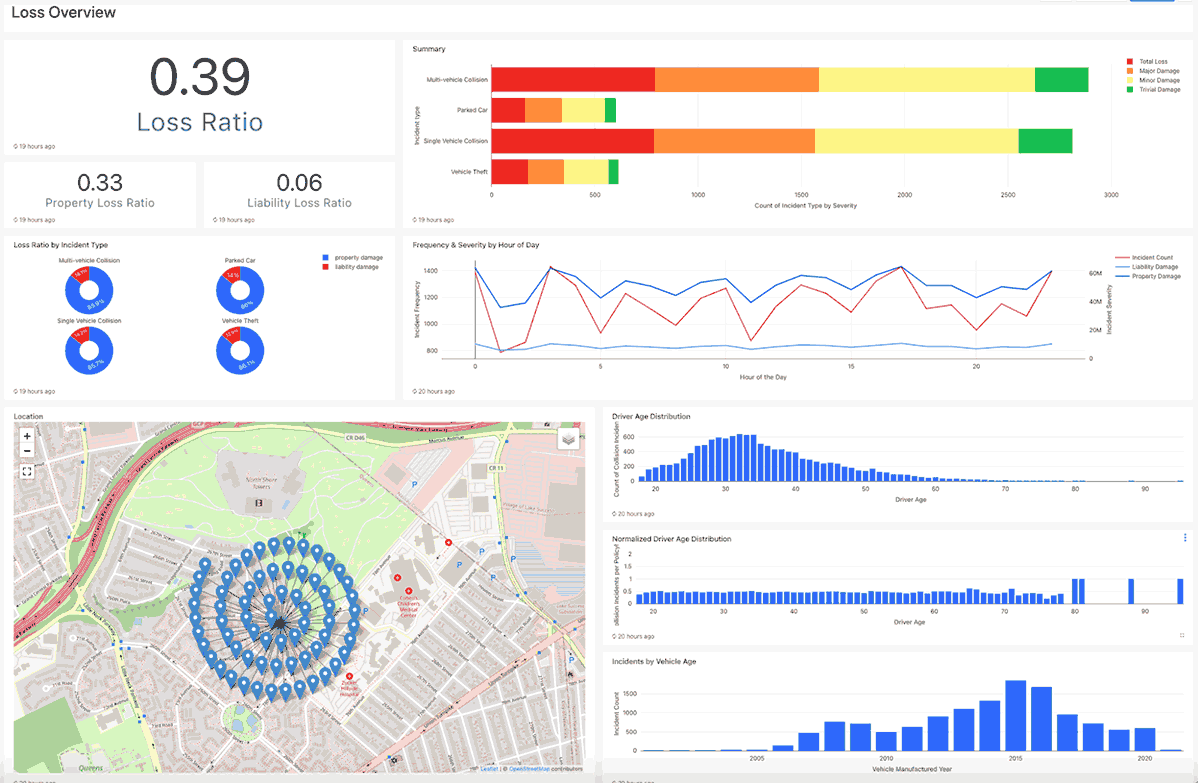
Analyzing recent trends can further aid in reviewing similar cases such as :
- Loss Ratio is computed by insurance claims paid plus adjustment expenses divided by total earned premiums. E.g. typical average Loss Ratio (all coverages combined, Bodily Injury, and Physical Damage) for personal auto should be around 65%
- Summary visualization captures count of incident type by damage severity
- Trend lines over various features/dimensions
- Geographic distribution of policies
The Claims Investigation dashboard facilitates faster investigation by providing all relevant information around a claim allowing the human investigator to drill down to a specific claim to see details such as Images of the damaged vehicle, Claim, Policy & Driver details, Telematic data draws the path taken by the vehicle, Reported data is contrasted with assessed data insights.
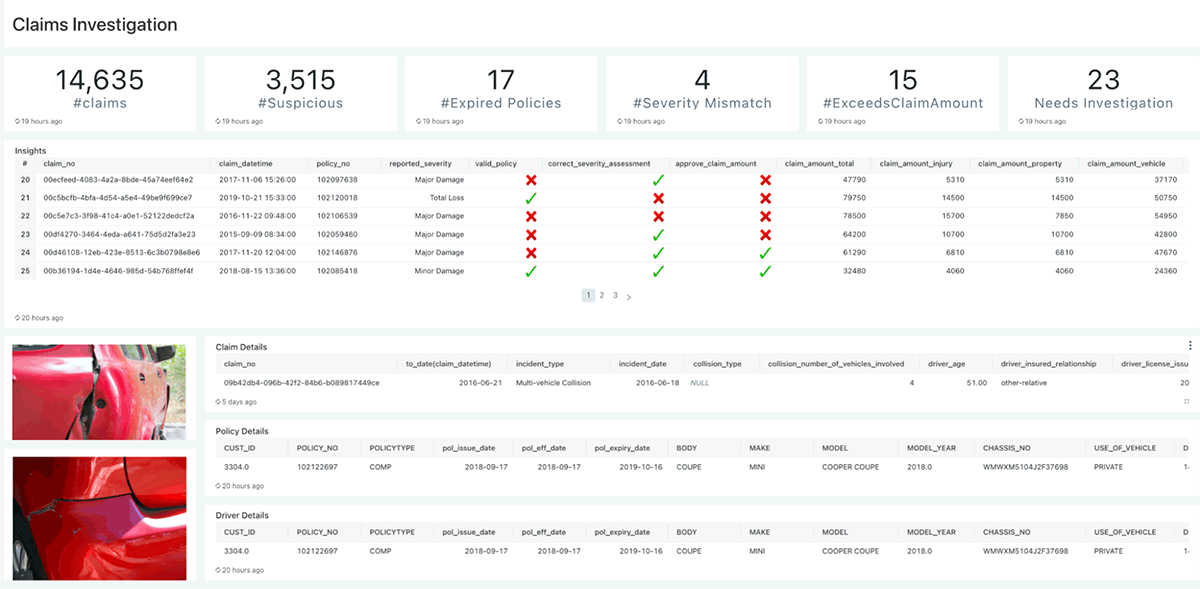
Provides recent claims that are auto-scored in the pipeline using ML inferencing and rule engine
- A green tick is used to denote auto-assessment matches claims description
- A red cross indicates a mismatch that warrants further manual investigation
Summary
Innovation and personalization are essential for insurance firms to differentiate themselves from the competition. This Databricks Lakehouse provides a platform for insurers to enable and accelerate innovation with an open, secure, extensible architecture that easily integrates with third-party tools and services. This solution accelerator demonstrates how the paradigm can be applied to claims handling. Further, the Databricks ecosystem offers a range of capabilities to enable data teams and business stakeholders to collaborate and generate and share insights that support business decisions and drives tangible value to the bottom line.
The technical assets, including pipeline configurations, models, and sample data used in this example, can be accessed here or directly on Git.
Get the latest posts in your inbox
Subscribe to our blog and get the latest posts delivered to your inbox.