Announcing the Security Analysis Tool (SAT)
Monitor the security health of your Databricks workspaces
At Databricks, we know that data is one of the most valuable assets to organizations and that protecting it is a top priority. That's why we built security into every layer of the Databricks Lakehouse Platform. But we recognize that customers can struggle to assess whether their deployment is well-architected, what areas are well-fortified and which need attention. Even if you're confident when you deploy the platform, security teams may not re-assess and configuration drift could inadvertently lead to data and intellectual property breaches. A chain is as strong as its weakest link, leading our customers to ask:
- How do I know if I am following Databricks security best practices?
- How can I easily monitor the security health of all of my account workspaces over time?
We are excited to announce the Security Analysis Tool (SAT)! SAT helps our customers answer these questions and harden their Databricks deployments by reviewing current deployments against our security best practices. It uses a checklist that prioritizes observed deviations by severity and provides links to resources that will help you resolve outstanding issues. SAT can be run as a routine scan for all workspaces in your environment to help establish continuous adherence to best practices, and health reports can be scheduled to provide continual confidence in the security of your sensitive datasets.
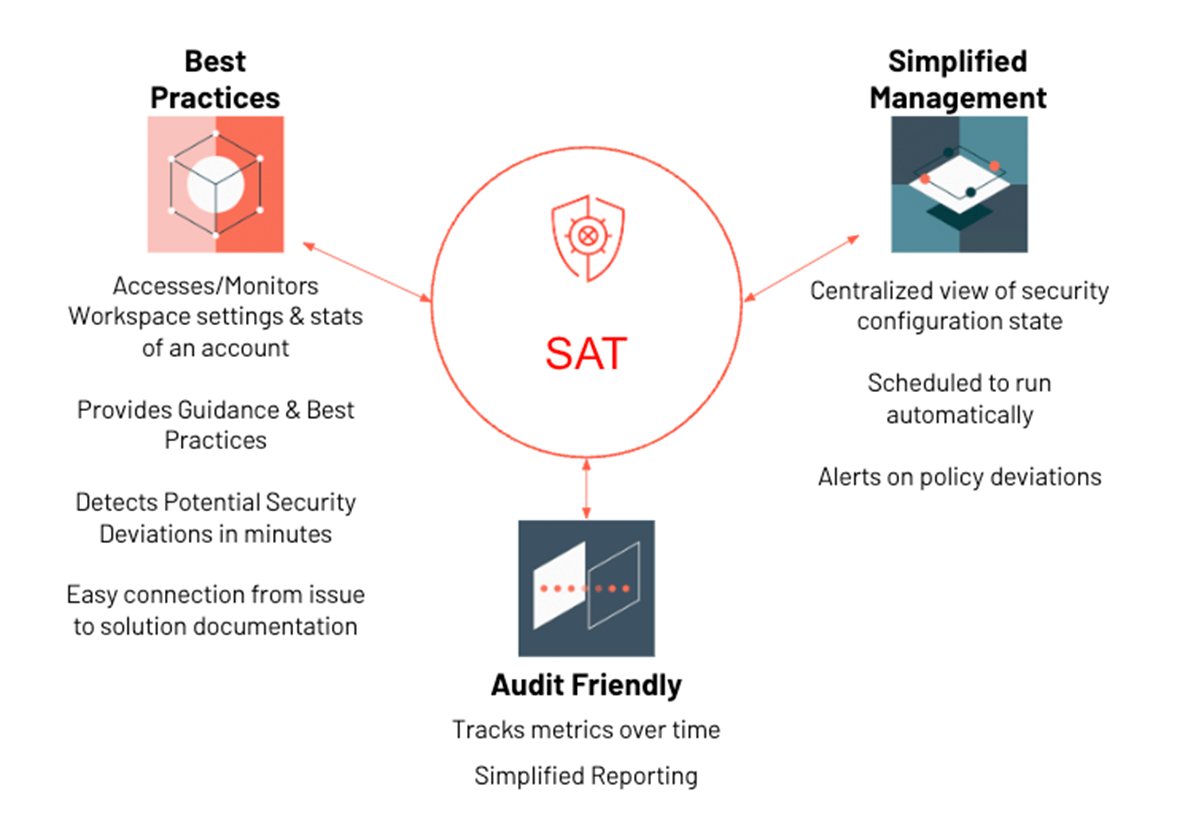
SAT runs in the customer's account as an automated workflow that collects deployment details via Databricks REST APIs. Scan results are persisted in Delta tables to analyze security health trends over time. SAT contains a dashboard that displays findings grouped into five security categories: Network Security, Identity & Access, Data Protection, Governance and Informational. Security teams can set up alerts that will notify them when SAT detects insecure configurations and policy deviations. It also provides additional details on individual checks that fail so that an admin can quickly pinpoint and remediate the issue. Forewarned is Forearmed!
Components of SAT
SAT comprises of the following assets:
- A configurable security checklist
- A set of notebooks and libraries that collect details using REST APIs and the logic for determining conformance
- A parameterized SQL dashboard and associated queries and alerts to display the check results
- A flexible workflow with auditable daily scans, organized by date
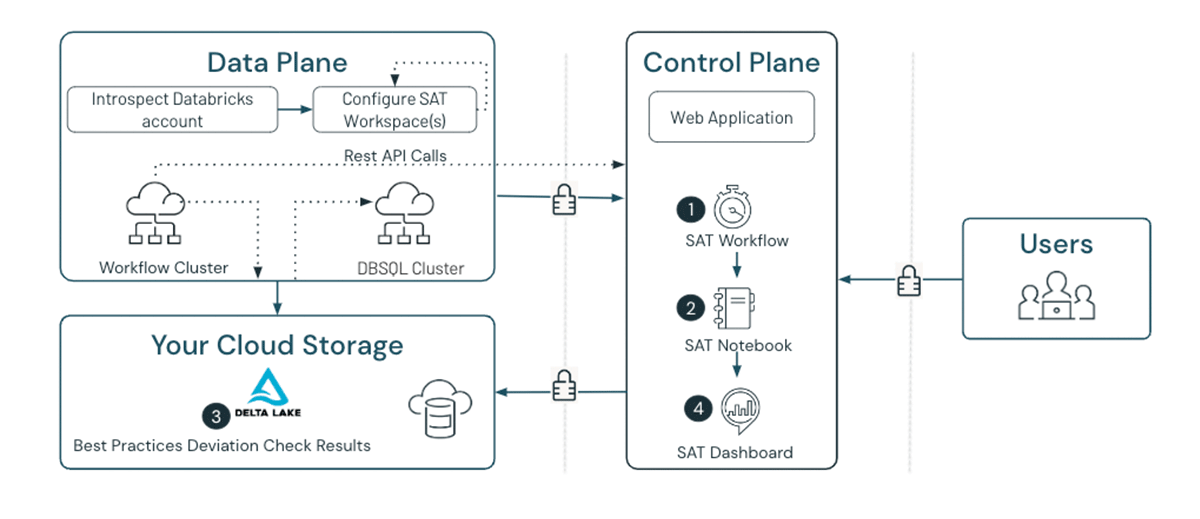
As shown above (Figure 2), the SAT components run in the customer workspace as denoted by the numbers in the diagram. Each component performs the following functions:
- SAT Workflow: The scheduled or manually executed SAT workflow job starts the scan.
- SAT Notebook: The SAT Security Analysis notebook executes the security scan by running a series of best practice checks on enrolled workspaces.
- SAT Results: The SAT Security Analysis notebook saves validation results into a Delta table for trending and historical reference.
- SAT Dashboard: The prebuilt SAT dashboard displays the latest scan results pulled from the Delta table. Administrators, security analysts, and auditors can now assess their Databricks security posture from the comfort of a single screen.
SAT deployment details
SAT setup and usage can be broken into three phases, as shown in the diagram below (Figure 3).
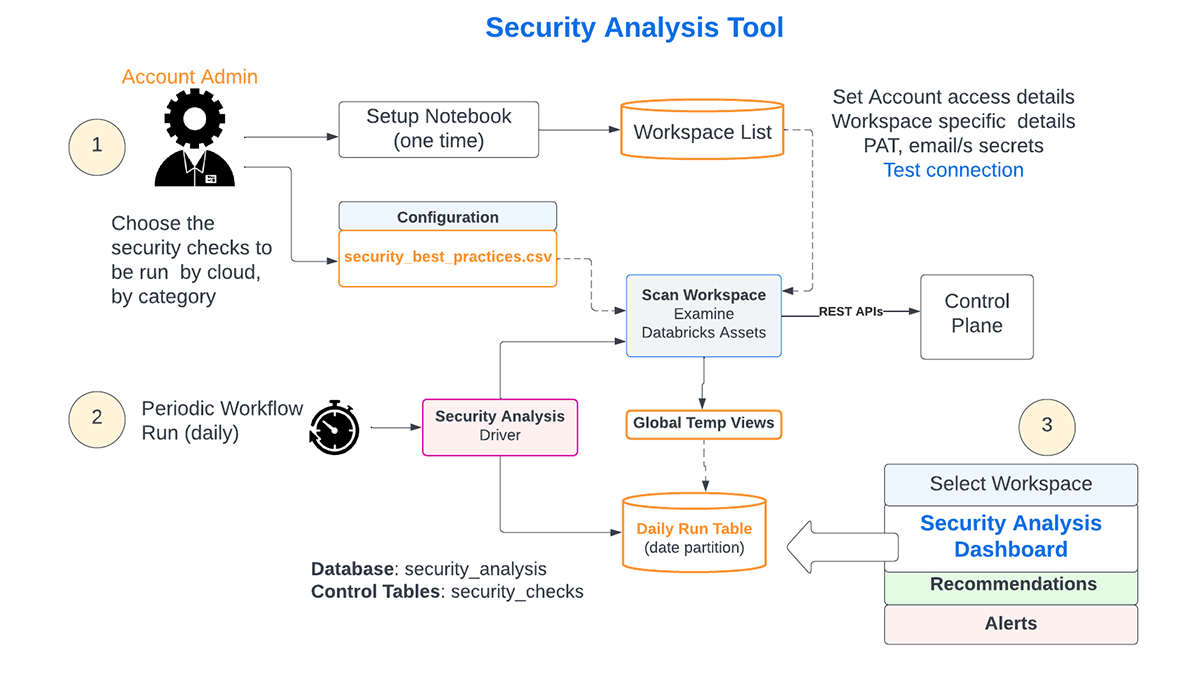
- Deployment and Configuration
SAT Setup requires admin privileges and involves the following activities:- In a chosen workspace, the admin uses a series of notebooks for the initial one-time setup as documented here.
- All checks in the list are enabled by default, but an admin can turn off any that aren't necessary
- The admin will provide PAT tokens for each workspace in the Databricks account, and the connections will be verified. Only configured workspaces are included in the daily checks.
- The workflow is configured to run at a scheduled interval (typically daily)
- Daily Assessment of all the configured environments
- The scheduled workflow will run every day. The day's checks in each of the configured workspaces will be persisted in a Delta table, enabling trending and historical reference.
- Consumption of Insights
- Admins, security analysts, and auditors can view the results by workspace on a Databricks SQL dashboard
Detailed instructions to install the Security Analysis Tool can be found here.
SAT insights
The SAT Dashboard displays (Figure 4) security scan results for each workspace, sorted by severity.
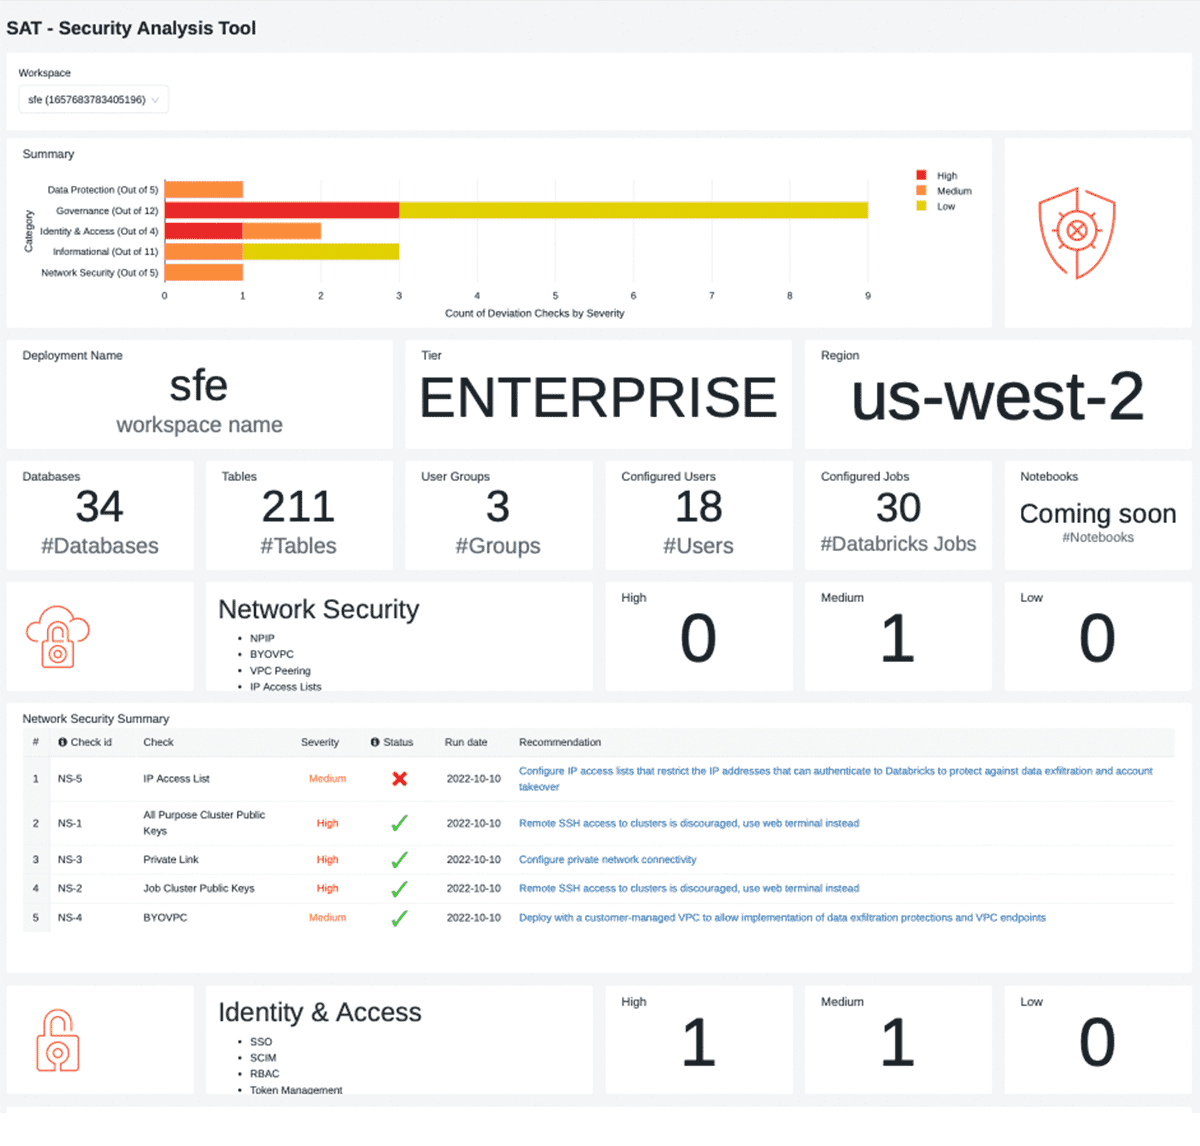
The dashboard is broken into five sections and each pillar is laid out in a consistent format.
- Workspace Security Summary
- The high-level summary calls out findings by category, categorized by severity.
- Workspace Stats
- This section provides usage statistics around the number of users, groups, databases, tables, and service details like tier and region.
- Individual Security Category Details
- A section for each security category that contains:
- Security section summary details, such as counts of deviations from recommended best practices
- A table with security finding details for the security category, sorted by severity. The table describes each security violation and provides links to documentation that help to fix the finding.
- A section for each security category that contains:
- Informational Section
- These are less prescriptive in nature but provide data points that can be scrutinized by data personas to verify thresholds are set correctly for their organization.
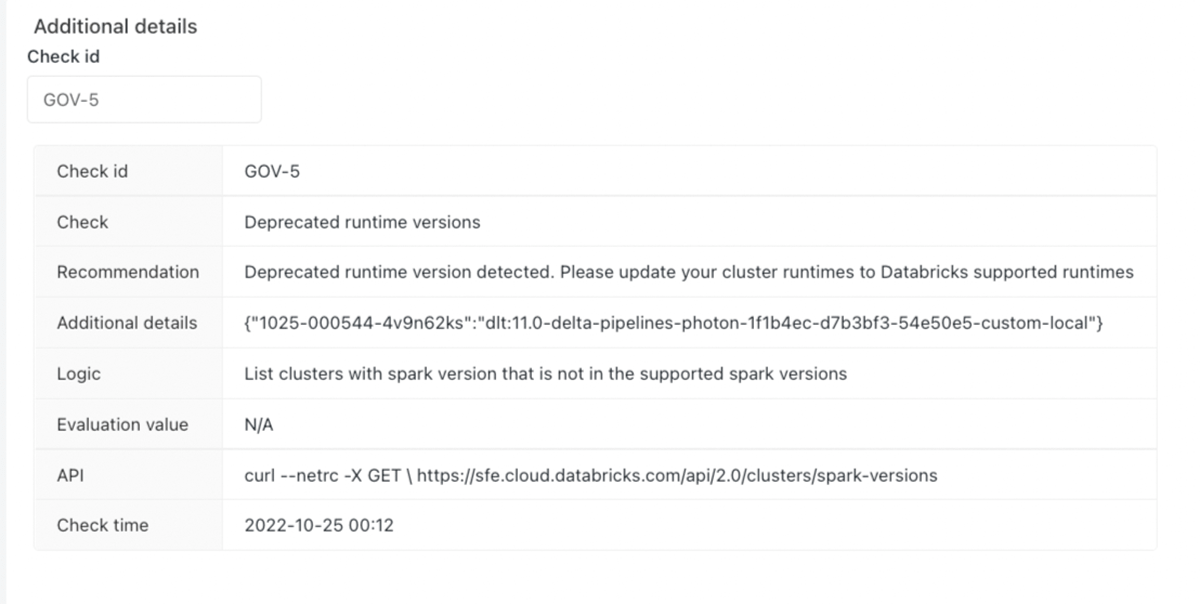
- Additional Finding Details
- This section provides additional details that help to pinpoint the source of a security deviation, including the logic used to detect them. For example, the 'cluster policy not used' will provide a list of the cluster workloads where the policy is not applied, avoiding a needle-in-a-haystack situation.
How to use SAT for risk mitigation
Security Analysis Tool (SAT) analyzes 37 best practices, with more on the way, and presents the insights in a dashboard. What do you do with these insights? We will use two examples to illustrate how a typical user would make use of the insights.
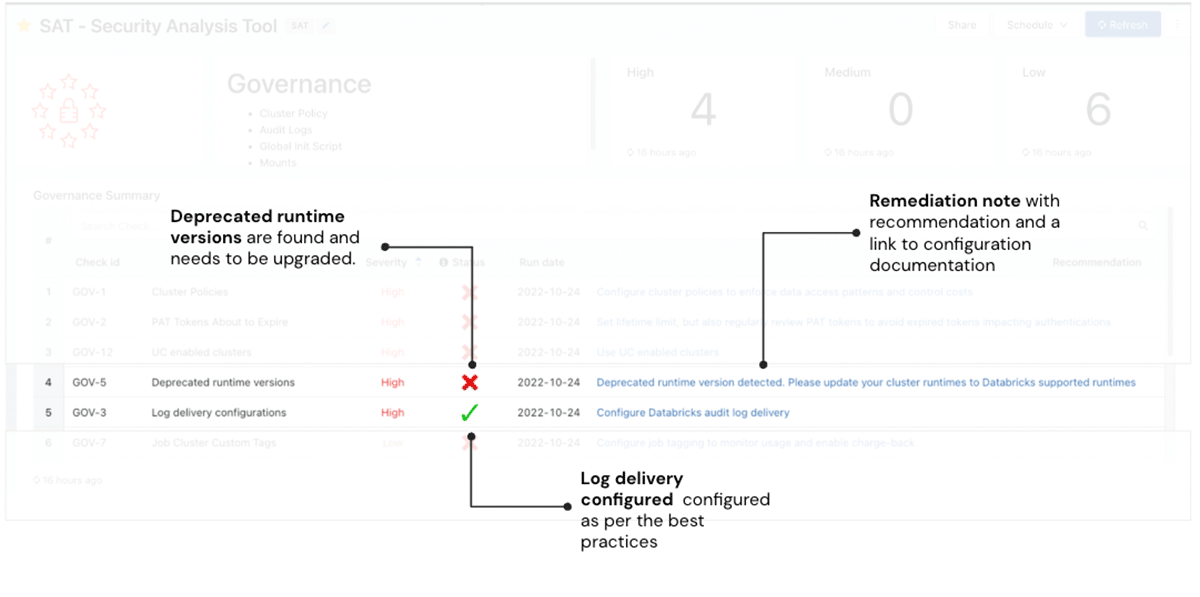
In the first example, the SAT scan highlights one finding that surfaces a potential risk - the red check mark in Figure 5. The Deprecated runtime versions check is red indicating that there are runtimes that are deprecated. Workloads on unsupported runtime versions may continue to run, but they receive no Databricks support or fixes. The "check id" associated with the finding can be used in the "Additional Details" section to query for more detailed information on what configuration setting or control failed a specific best practice rule. For example, the image below showcases additional details on the "Deprecated runtime versions" risk for administrators to investigate. The Remediation column in the screenshot describes the risk and remediation actions needed with links to the documentation of the Databricks runtime versions that are currently supported. The user should take the recommended remediation action in a timely manner commensurate with the severity of the finding.
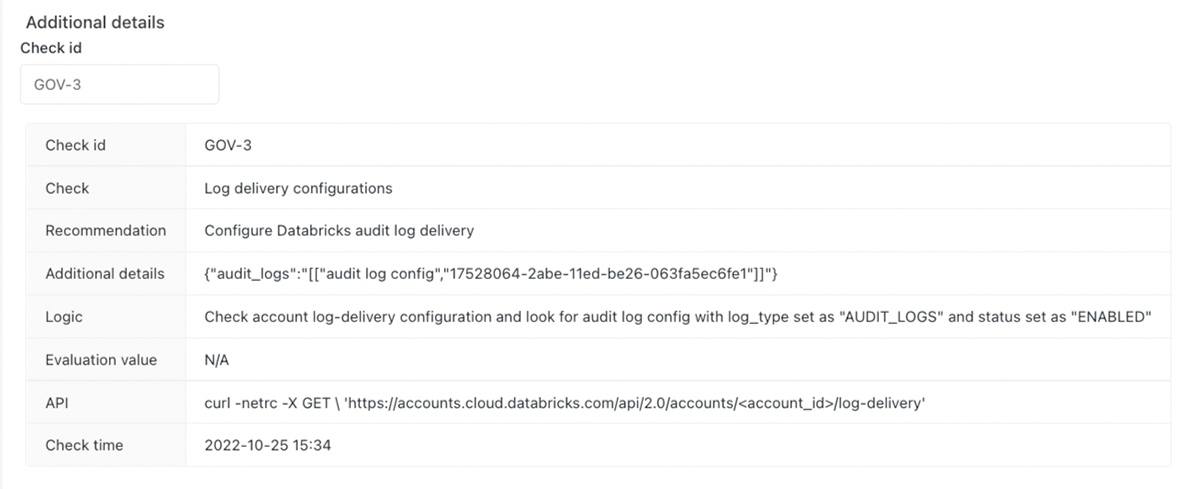
In the second example, we highlight one finding that meets Databricks' best practices - the green check mark in Figure 5. The Log delivery check is green, confirming that the workspace follows Databricks security best practices. Again, the "check id" ("GOV-3") can be used in the "Additional details" section to get detailed information. No further action is required, but we recommend the user to run these checks regularly to view Databricks account workspace security and ensure continuous improvement comprehensively.
Conclusion
This blog post introduced you to the Security Analysis Tool for the Databricks Lakehouse Platform. You also saw how easy it is to set up SAT in a few steps and observe the security health of your Databricks account workspaces over time. We also showed you detection examples so that you can harden your Databricks deployment. We invite you to set up SAT in your Databricks deployments or ask for help from your Databricks account team. Stay tuned for more blog posts and video content on Databricks Security!
If you are curious about how Databricks approaches security, please review our Security & Trust Center. We encourage you to review Databricks Security Best Practices documents. If you have questions or suggestions about SAT, please feel free to reach us at sat@databricks.com.
Get the latest posts in your inbox
Subscribe to our blog and get the latest posts delivered to your inbox.