Ballard Power Systems RDU (Remote Diagnostics Unit) Visualization Platform for Interactive At-Scale Industrial IoT Streaming Analytics
by Caitlin Gordon and Andreas Putz
This article represents a collaborative effort between Plotly, Ballard Power Systems, and Databricks.
Fleets of buses worldwide run on hydrogen fuel cells made by Ballard Power Systems. To lead in the zero-emission energy space, Ballard has combined the power of Databricks and Plotly Dash to build an RDU (Remote Diagnostics Unit) Visualization Platform capable of processing more than 50 terabytes of data and delivering actionable information globally to subject matter experts, fleet managers and C-level business leaders.
Challenge
Facing increasingly growing amounts of data, Ballard’s analytics team encountered performance and scalability constraints with legacy architecture components with classical data warehouses and BI reporting, which reduced data viewing and analytics capacity to a single week. Furthermore, the required reports took weeks to curate and deliver, hampering long-term trend analysis and contemporary strategic decisions.
Addressing these challenges via standard data warehousing and BI solutions was not viable due to the complexity, scale and granularity of Ballard’s streaming data collection, pipeline, and analytics requirements. Ballard required a solution to do real-time processing of complex semi-structured data, perform ML training and inference, and visualize these changes in a live data application. Including incoming data not being ordered in time - and quite significantly so - as required for stream-based processing, along with significant lags in data arrival and missing chunks of data.
The requirement was for a solution that addressed all these complexities, all while being accessible to a diverse set of internal and external stakeholders globally, including:
- Ballard C-level business leadership requires a non-technical user interface to facilitate complex analysis over more extended periods. Executives need to spot long-term and more significant trends in the field, which requires an immense amount of data combined with highly complex analytics that data warehouses cannot provide in a cost-effective manner.
- Ballard subject matter experts (SMEs) and Customer technicians who require daily access to raw data (~150 parameters) for individual units at sub-second frequencies to deliver detailed system diagnostics and to build machine dynamic learning models that inform uptime and predictive maintenance strategies and activities.
- Customer fleet managers must review data aggregated from all of their fuel cell modules (of which there are thousands in operation currently) to answer critical operational questions such as: What is the hydrogen consumption per kilowatt-hour generated? Is a particular module operating under stress and degrading? How does performance vary between city vs. highway driving?
- Bus Integrators must integrate fuel cell modules into the overall powertrain of the bus. This future state requires data sharing with outside customers, so data governance is critical. Unity Catalog, Delta Sharing and Plotly Dash Enterprise SSO capabilities are also on the roadmap to deliver data to our external customers.
RDU Visualization Platform

We have a complex, growing data pipeline with currently over 40 billion data points from our expanding customer base of fuel cell modules. We specifically chose the combination of Databricks and Plotly Dash because we required a platform capable of delivering sophisticated, interactive, at-scale streaming analytics globally - at both a technical and business level - to a wide range of internal and external stakeholders in a timely manner. —Andreas Putz, Analytics Team Lead, Ballard Power Systems
Ballard’s analytics team developed the RDU Visualization Platform by integrating Databricks and Plotly Dash in an Azure cloud environment to deliver interactive analytics products for multiple stakeholders, including the following examples:
- SME Diagnostics App - With minimal curation and via dynamic resampling, engineers can select and filter down into 40 billion raw data points on a daily basis, both for manual system diagnostics and to develop predictive machine learning models.
Dynamic resampling achieved via the Plotly Resampler enables views to be rendered directly in the browser, even when querying vast time ranges.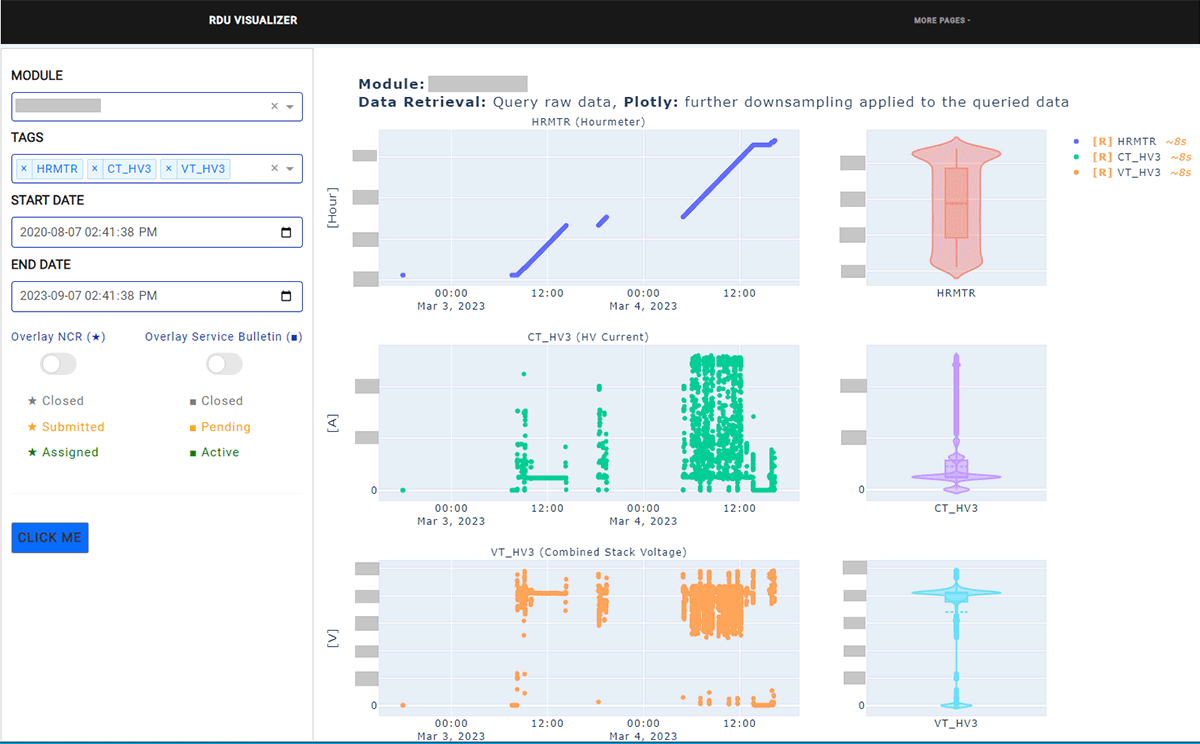
Figure 2 - RDU Visualization Platform SME Diagnostics App - Quality Council Performance App - This app dramatically lowers barriers to executive-level reporting by providing at-a-glance system-wide operational KPIs with the option for further exploratory data analysis to inform business decisions.
Results
- From weeks of lead time to real-time reporting - Ballard’s Executive Quality Council now views up to three years of data in real-time weekly, directly in the browser — previously an impossible scope and cadence. This enables quantifiable long-term visibility into downtime and impact on Ballard warranty commitments. This unmatched capability is powered by the combinations of Databricks’ unified real-time/batch processing engine using Photon, Structured Streaming, and Delta Live Tables. Since these engines can be highly scalable to ANY data type, all it takes to get a real-time dashboard is a simple plug into a Plotly Dash App. To deliver this kind of performance on a cloud data warehouse and dashboarding tool alone would be prohibitive in cost and abysmal performance.
- Massively increased visibility for internal operations teams - With the ability to facilitate exploration of up to 150 attributes from each of thousands of modules incoming at sub-second intervals, SMEs can visually explore raw data at second intervals for any individual fuel cell in circulation. This dynamic analytical workflow separates a simple report from an actual data application that drives strategic data products that customers use daily. Dash’s highly customizable and scaleable pythonic framework can offer the capability of any full-stack web application, except that it can be created at 10x the development speed, leverage the depth and breadth of the python analytics ecosystem, and support highly advanced data workflows.
- Enhanced decisions for external customers - Ballard’s customers benefit from the insight that a reliable, granular level of analysis provides at the individual module/vehicle level. Customers can evaluate their CO2 savings compared to a conventional fleet, monitor hydrogen fuel efficiency, and analyze bus availability. Currently, this is a static bi-weekly report, but an online continuously refreshed report based on Databricks Unity Catalog, Delta Sharing and Plotly Enterprise is in development.
The RDU Visualization Platform continues to evolve, and Ballard welcomes sharing best practices with others advancing similar objectives with these technologies. Planned enhancements to the Ballard system include adding spatial analytics, point-in-time formal reporting, further structured streaming optimizations, and other ML development initiatives.

About Ballard
Ballard Power Systems’ (NASDAQ: BLDP; TSX: BLDP) vision is to deliver fuel cell power for a sustainable planet. Ballard zero-emission PEM fuel cells are enabling the electrification of mobility, including buses, commercial trucks, trains, marine vessels, and stationary power. To learn more about Ballard, please visit www.ballard.com.

About Plotly
Plotly is a software company whose mission is to enable every company, around the world, to build data apps. Our product, Dash Enterprise, is a platform of best-in-class development tools to quickly and easily visualize data in Python from virtually any data source. With customers across the Fortune 500, Plotly is a category-defining leader in enabling data-driven decisions from advanced analytics, machine learning, and artificial intelligence. For more information, visit www.plotly.com.
About Databricks
Databricks is the Data and AI company. More than 10,000 organizations worldwide — including Comcast, Condé Nast, and over 50% of the Fortune 500 — rely on the Databricks Lakehouse Platform to unify their data, analytics and AI. Databricks is headquartered in San Francisco, with offices around the globe. Founded by the original creators of Apache Spark™, Delta Lake and MLflow, Databricks is on a mission to help data teams solve the world’s toughest problems. To learn more, follow Databricks on Twitter, LinkedIn and Facebook.
Contact us to learn more.
Get the latest posts in your inbox
Subscribe to our blog and get the latest posts delivered to your inbox.