Harnessing Machine Learning for Anomaly Detection in the Building Products Industry with Databricks
by Joy Garnett, Avinash Sooriyarachchi and Sathish Gangichetty
Introduction
Anomaly detection is widely applied across various industries, playing a significant role in the enterprise sector. This blog focuses on its application in manufacturing, where it yields considerable business benefits. We will explore a case study centered on monitoring the health of a simulated process subsystem. The blog will delve into dimension reduction methods like Principal Component Analysis (PCA) and examine the real-world impact of implementing such systems in a production environment. By analyzing a real-life example, we will demonstrate how this approach can be scaled up to extract valuable insights from extensive sensor data, utilizing Databricks as a tool.
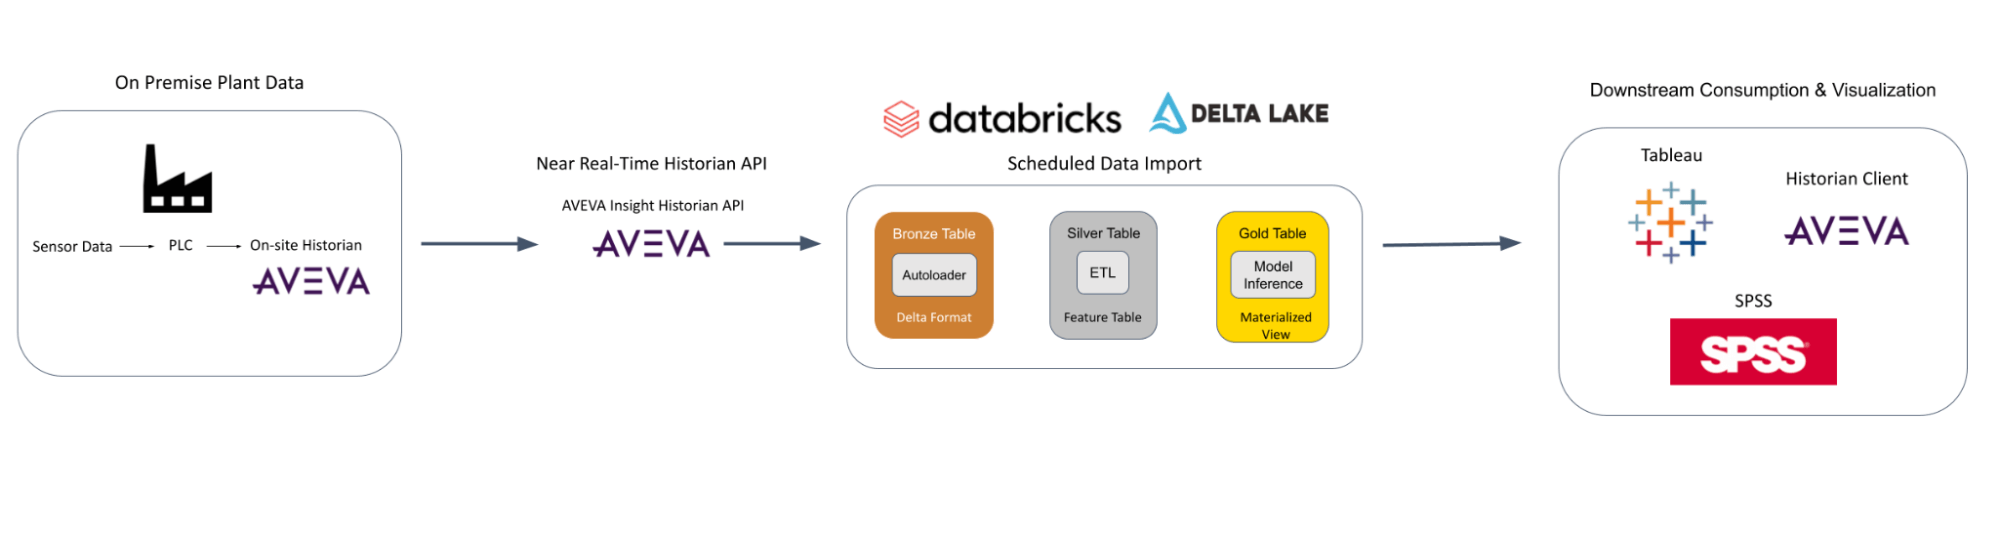
LP Building Solutions (LP) is a wood-based product manufacturing company with an over 50-year track record of shaping the building industry. With operations in North and South America, LP manufactures building product solutions with moisture, fire, and termite resistance. At LP, petabytes of historical process data have been collected for years along with environmental, health, and safety (EHS) data. Large amounts of these historical data have been stored and maintained in a variety of systems such as on-premise SQL servers, data historian databases, statistical process control software, and enterprise asset management solutions. Every millisecond, sensor data is collected throughout the production processes for all of their mills from handling raw materials to packaging finished products. By building active analytical solutions across a variety of data, the data team has the ability to inform decision-makers throughout the company on operational processes, conduct predictive maintenance, and gain insights to make informed data-driven decisions.
One of the biggest data-driven use cases at LP was monitoring process anomalies with time-series data from thousands of sensors. With Apache Spark on Databricks, large amounts of data can be ingested and prepared at scale to assist mill decision-makers in improving quality and process metrics. To prepare these data for mill data analytics, data science, and advanced predictive analytics, it is necessary for companies like LP to process sensor information faster and more reliably than on-premises data warehousing solutions alone
Architecture
ML Modeling a Simulated Process
As an example, let's consider a scenario where small anomalies upstream in a process for a specialty product expand into larger anomalies in multiple systems downstream. Let’s further assume that these larger anomalies in the downstream systems affect product quality, and cause a key performance attribute to fall below acceptable limits. Using prior knowledge about the process from mill-level experts, along with changes in the ambient environment and previous product runs of this product, it's possible to predict the nature of the anomaly, where it occurred, and how it can affect downstream production.
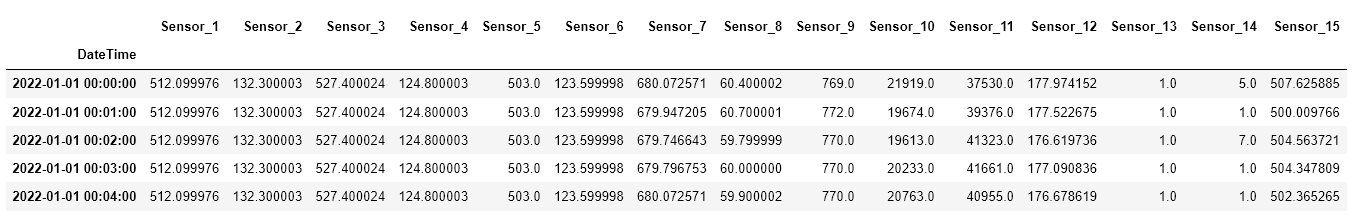
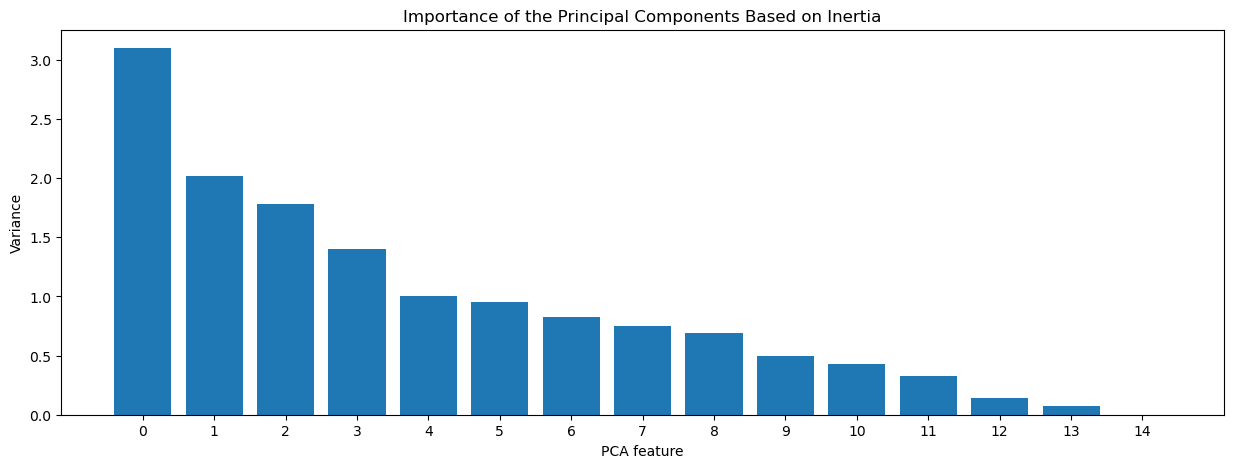
First, a dimensionality reduction approach of the time-series sensor data would allow for identification of equipment relationships that may have been missed by operators. The dimensionality reduction serves as a guide for validating relationships between pieces of equipment that may be intuitive to operators who are exposed to this equipment every day. The primary goal here is to reduce the number of correlated time series overhead into relatively independent and relevant time-based relationships instead. Ideally, this should start with process data with as much diversity in acceptable product SKUs and operational windows as possible. These factors will allow for a workable tolerance.
Plotting
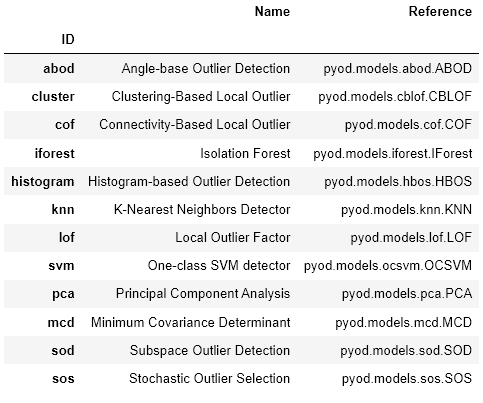
Next, these time-based relationships can be fed into an anomaly detection model to identify abnormal behaviors. By detecting anomalies in these relationships, changes in relationship patterns can be attributed to process breakdown, downtime, or general wear and tear of manufacturing equipment. This combined approach will use a combination of dimensionality reduction and anomaly detection techniques to identify system- and process-level failures. Instead of relying on anomaly detection methods on every sensor individually, it can be even more powerful to use a combined approach to identify holistic sub-system failures. There are many pre-built packages that can be combined to identify relationships and then identify anomalies within those relationships. One such example of a pre-built package that can handle this is pycaret.
Models should be run at regular intervals to identify potentially serious process disruptions before the product is completed or leads to more serious downstream interruptions. If possible, all anomalies should be investigated by either a quality manager, site reliability engineer, maintenance manager, or environmental manager depending on the nature and location of the anomaly.
While AI and data availability are the key to delivering modern manufacturing capability, insights and process simulations mean nothing if the plant floor operators cannot act upon them. Moving from data collection from sensors to data-driven insights, trends, and alerts often requires the skill set of cleaning, munging, modeling, and visualizing in real- or near real-time timescales. This would allow plant decision-makers to respond to unexpected process upsets at the moment before product quality is affected.
CI/CD and MLOps for Manufacturing Data Science
Eventually, any anomaly detection model trained on these data will become less accurate over time. To address this, a data drift monitoring system can continue to run as a check against intentional system changes versus unintentional changes. Additionally, intentional disruptions that contribute to changes in process response will occur that the model will not have seen before. These disruptions can include replaced pieces of equipment, new product SKUs, major equipment repair, or changes in raw material. With these two points in mind, data drift monitors should be implemented to identify intentional disruptions from unintentional disruptions by checking in with plant-level experts on the process. Upon verification, the results can be incorporated into the previous dataset for retraining of the model.
Model development and management benefit greatly from robust cloud compute and deployment resources. MLOps, as a practice, offers an organized approach to managing data pipelines, addressing data shifts, and facilitating model development through DevOps best practices. Currently, at LP, the Databricks platform is used for MLOps capabilities for both real-time and near real-time anomaly predictions in conjunction with Azure Cloud-native capabilities and other internal tooling. This integrated approach has allowed the data science team to streamline the model development processes, which has led to more efficient production timelines. This approach allows the team to concentrate on more strategic tasks, ensuring the ongoing relevance and effectiveness of their models.
Summary
The Databricks platform has enabled us to utilize petabytes of time series data in a manageable way. We used Databricks to do the following:
- Streamline the data ingestion process from various sources and efficiently store the data using Delta Lake.
- Quickly transform and manipulate data for use in ML in an efficient and distributed manner.
- Track ML models and automated data pipelines for CI/CD MLOps deployment.
These have helped our organization make efficient data-driven decisions that increase success and productivity for LP and our customers.
To learn more about MLOps, please refer to the big book of MLOps and for a deeper dive into the technical intricacies of anomaly detection using Databricks, please read the linked blog.
Get the latest posts in your inbox
Subscribe to our blog and get the latest posts delivered to your inbox.