MLflow System Tables: Analyze Data Across All Your Experiments
Build dashboards, set up SQL alerts, and understand your MLflow data at scale
by Raymond Zhou, Ian Ackerman, Liudan Xiao, Harutaka Kawamura and Dhruv Kumar
- Introducing MLflow metadata in system tables (public preview): perform large-scale queries across all your experiments
- Analyze experiment tracking data across workspaces with familiar DBSQL and lakehouse tools, without the need for bespoke solutions
- Create AI/BI dashboards with rich visualizations to monitor the health and performance of your MLflow experiments in real time
ML teams are under pressure to move faster, but fragmented experiment data makes that impossible. When experiment tracking is scattered across workspaces and APIs, even simple questions become hard to answer: Which models are improving? Where are we wasting GPU cycles? How many runs failed this week?
Without unified visibility, ML leaders can’t see performance trends or spot regressions early. The result: slower iteration, higher costs, and models that take longer to reach production.
That’s why we developed MLflow System Tables.
Users can query MLflow experiment run tracking data from the system.mlflow.* tables within Unity Catalog, enabling large-scale queries for experiment data across all workspaces within a region.
Why MLflow system tables?
Previously, MLflow data only lived within workspace-scoped APIs. To analyze MLflow data at scale, users would need to iterate through workspaces and experiments with many round trip queries to the MLflow API. With system tables, all of your experiment metadata across workspaces can be queried in Unity Catalog. Now you can:
- Analyze MLflow data across all experiments with Databricks SQL and lakehouse tools
- Build AI/BI dashboards to quickly analyze experiment and model performance at a glance
- Set up custom SQL alerts to proactively monitor the health of your experiments
Instead of spending time developing custom solutions to wrangle your data, you can focus on the important part: building better models.
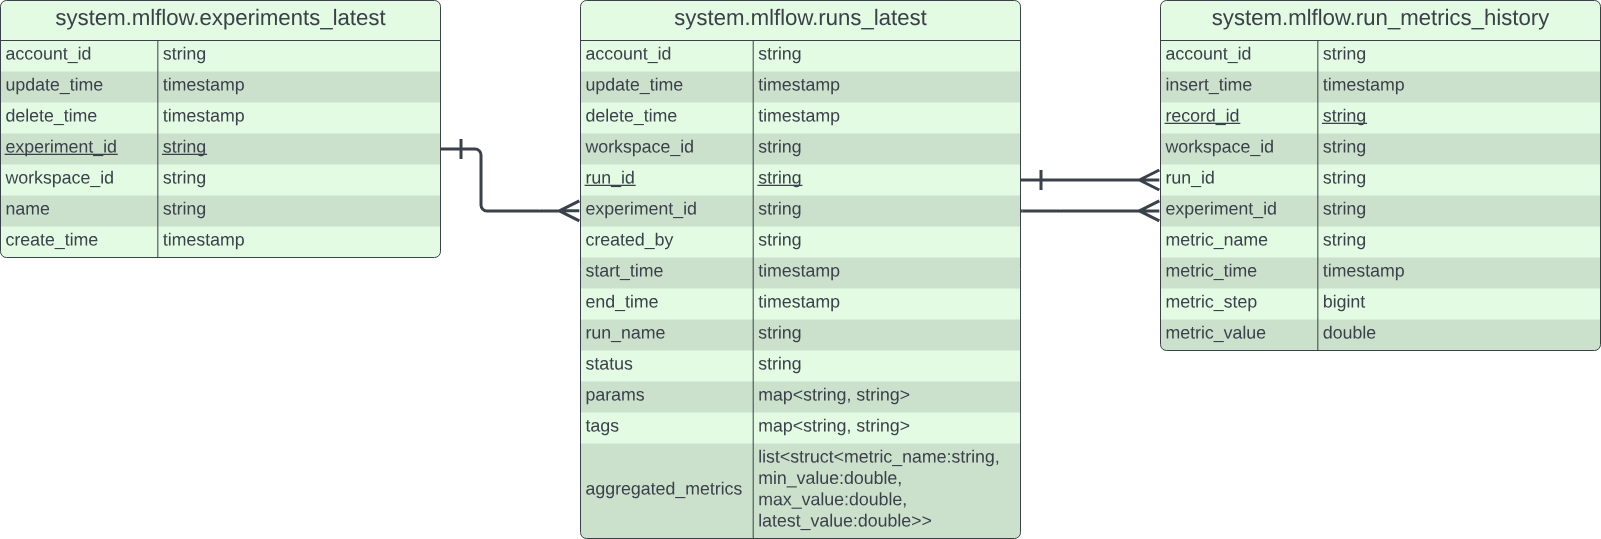
MLflow system tables reflect the data already available from the MLflow UI, presenting them in a structured, queryable form:
- experiments_latest: View experiment metadata such as names, creation times, and soft-deletion times
- runs_latest: Explore run lifecycle info, along with parameters, tags, and aggregated metrics (min, max, latest)
- run_metrics_history: Access the full metric time series for each run, enabling detailed plots based on timestamp or step
Applying MLflow system tables in practice
ML teams often struggle to understand whether experiments are running successfully across multiple workspaces. Tracking success rates or failure trends means manually checking individual MLflow experiments — a slow, error-prone process that hides instability patterns until it’s too late. Using the runs_latest table, teams can now monitor success ratios across all experiments and set SQL-based alerts to detect when reliability drops below a defined threshold (for example, 90%). This turns manual checks into automated oversight.
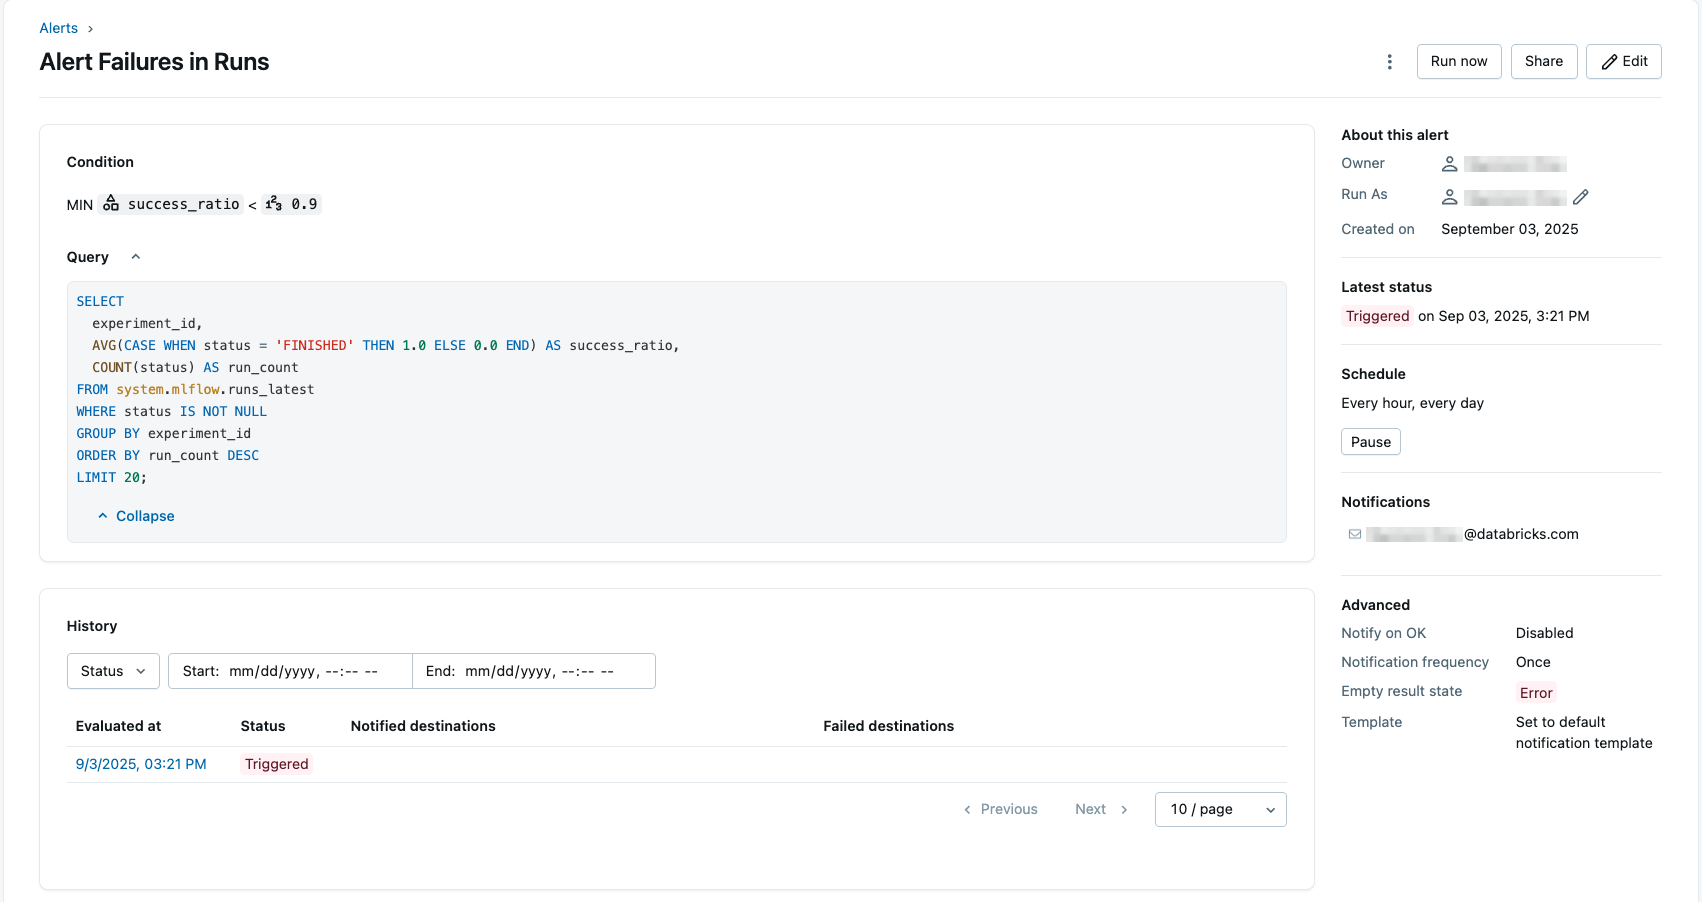
Teams can catch failed runs and unstable pipelines hours earlier, saving valuable engineering time and reducing wasted training compute. Reliability metrics can even feed into unified ML observability dashboards that track model performance alongside data quality and infrastructure KPIs.
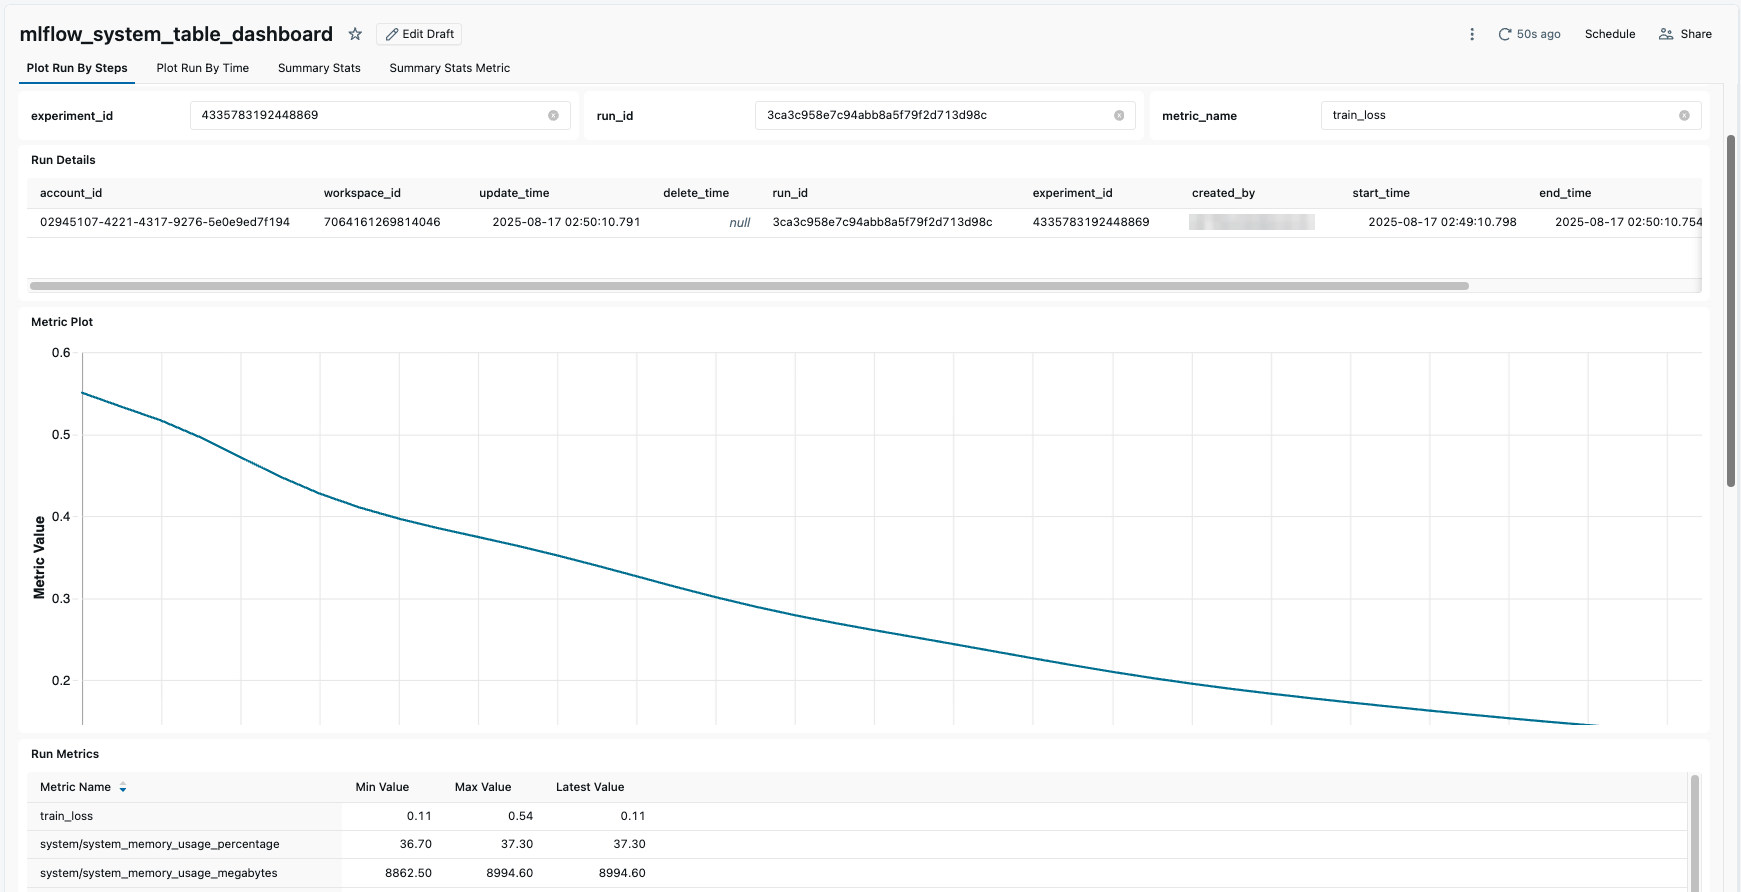
To kickstart monitoring, we have a starter dashboard to visualize experiment and run details which you can import into your workspace, then tailor to your needs. The dashboard includes tabs to view:
- Run details containing a plot of metrics by timestamp or step
- Experiment overview summarizing the performance of all runs it contains
- Metric summary showing aggregate stats from all runs and experiments
It is also often challenging to understand metrics such as resource utilization and model performance across many experiments, as the data is scattered. System metrics like GPU utilization and model evaluation metrics live within separate runs, making it difficult to understand where resources are wasted or models are underperforming.
By combining the runs_latest and run_metrics_history tables, you can track key metrics across workspaces. The example below computes, per experiment, detailed metrics information from all runs, enabling high-level monitoring of system metrics like GPU utilization along with model metrics.
With this unified view, data scientists can detect anomalies, evaluate training performance, or even join evaluation metrics with online served model data in inference tables for deeper insights. Teams gain visibility into whether compute resources are being used effectively and can catch unusual model behavior earlier, leading to tighter feedback loops, more efficient use of infrastructure, and high-quality models in production.
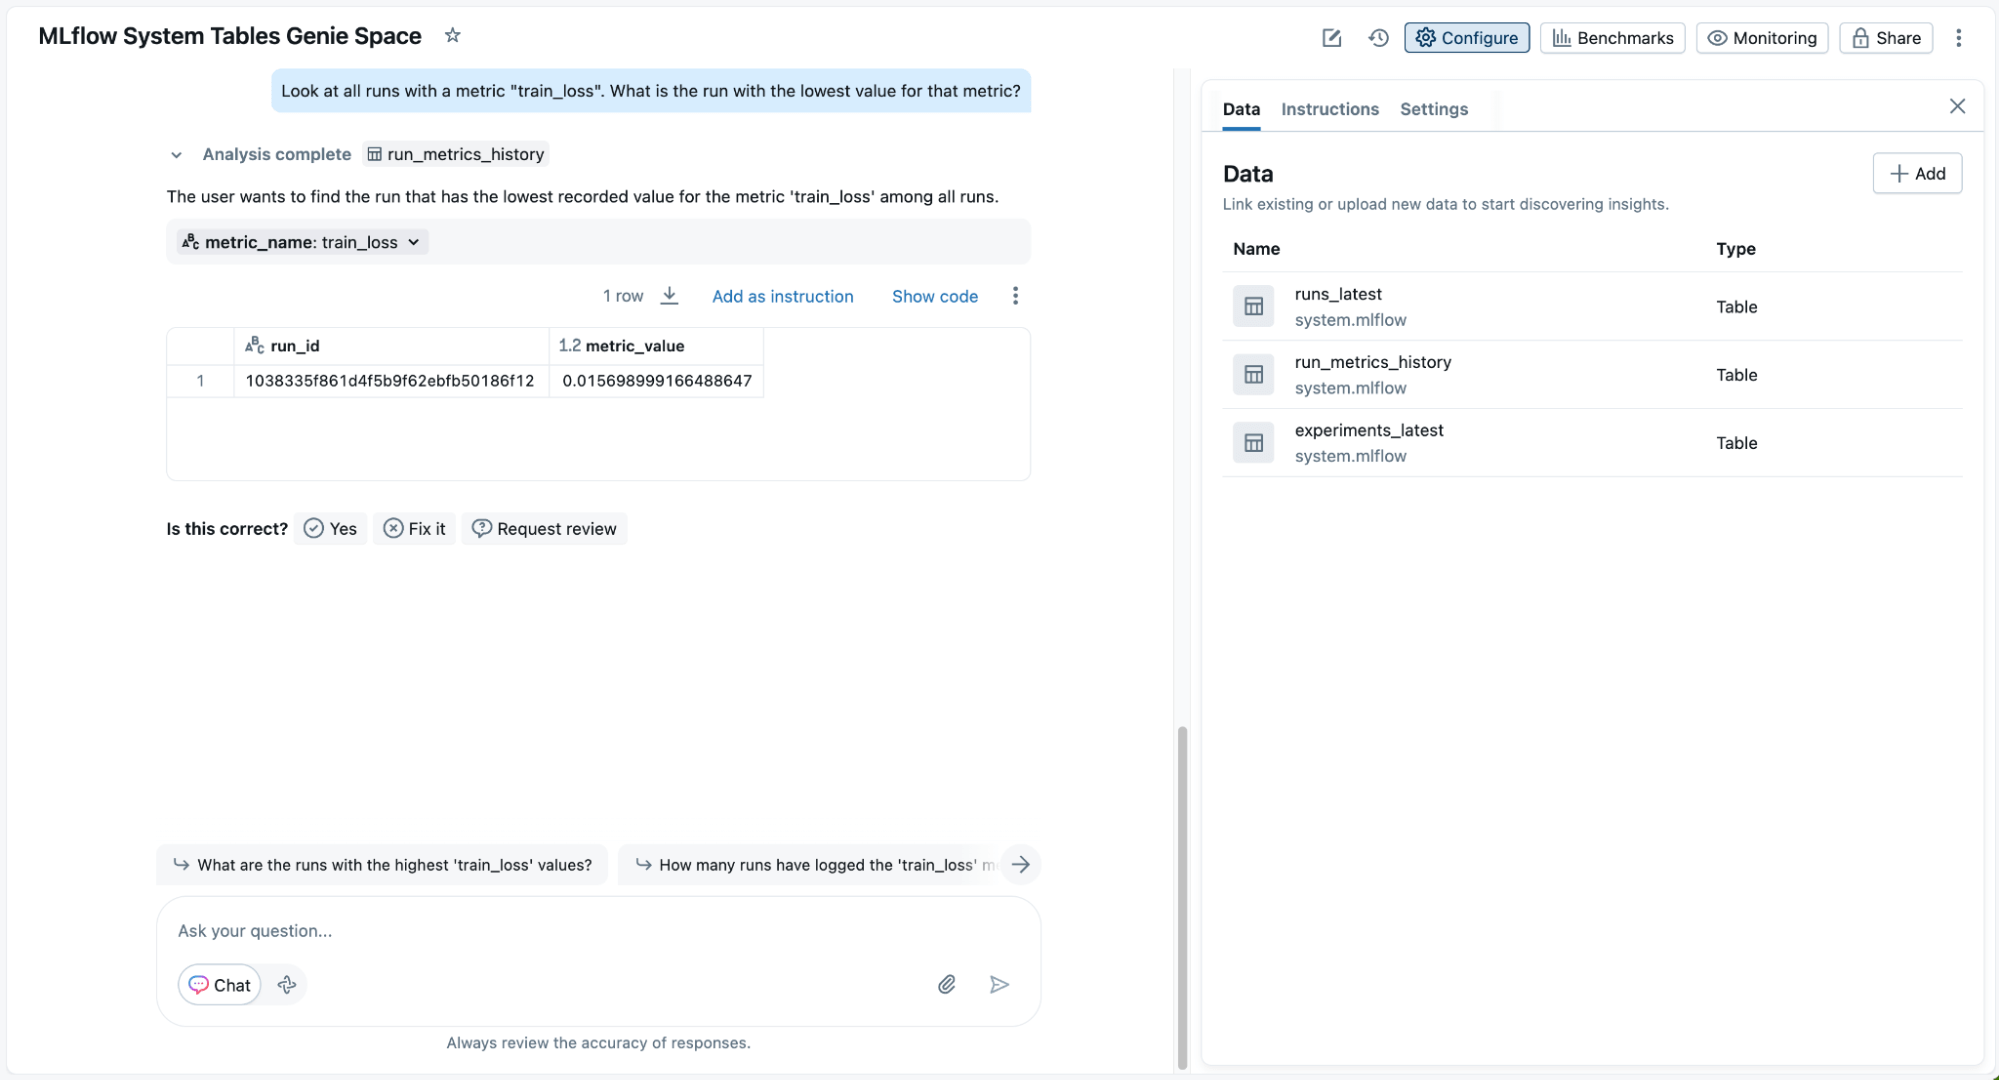
Finally, while SQL queries are powerful, they’re not always straightforward for everyone who can benefit from understanding ML data. With an AI/BI Genie space, you can add the MLflow system tables as data and start getting insights on your model performance. Notably, Genie translates natural-language questions into equivalent SQL queries for quick exploration and generates relevant visualizations, making it easy for all users. You can prompt it further with follow up questions for deeper analysis.
Getting started with MLflow system tables
With all the lakehouse tooling available on top of system tables, it’s easier than ever before to extract insights from your experiment run tracking data. The MLflow System Tables Public Preview is available in all regions and contains data starting from Sept. 2nd. To begin, your account admin needs to use UC tooling such as group privileges or row-level permissions on a dynamic view to grant you read access to the table. (For more details, please see the official docs.) Afterwards, here are 2 easy ways to get started:
- Query MLflow data directly, by navigating to Catalog in the workspace sidebar to see which data is available and opening the SQL Editor to start running queries
- Import our starter dashboard into your workspace to view run details and metrics across experiments, then customize to your needs
We highly recommend exploring everything system tables unlocks for your MLflow data and look forward to your feedback!
Get the latest posts in your inbox
Subscribe to our blog and get the latest posts delivered to your inbox.