New debugging features for Databricks Notebooks with Variable Explorer
by Jaipreet Singh, Weston Hutchins, Cong Lu, Ryan Wan and Jove Yuan
Today, we are excited to announce the general availability of the Variable Explorer for Python in the Databricks Notebook. The Variable Explorer allows Databricks users to view at-a-glance all the variables defined in their notebooks, inspect and explore DataFrames in one click, and interactively debug Python code with pdb.
View the variables of your notebook
The Variable Explorer displays all variables available in the notebook session. The name, type, and value are surfaced for all simple variable types.
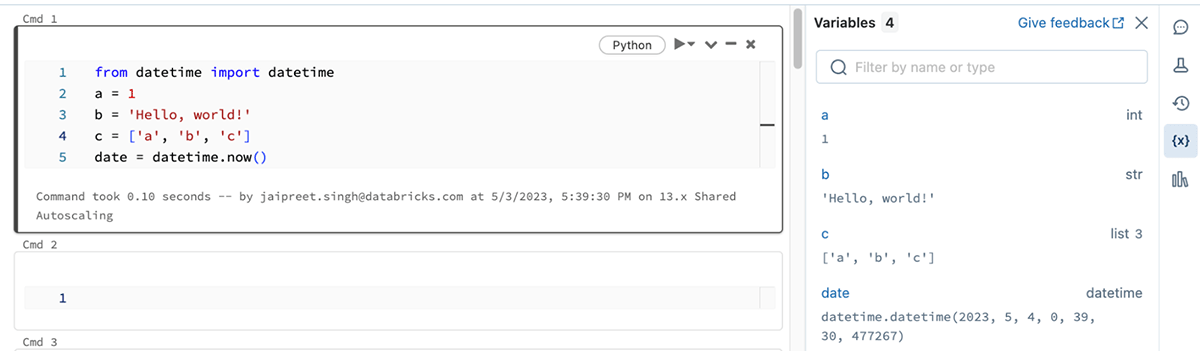
The Variable Explorer also surfaces additional metadata for Spark and Pandas DataFrames. The shape and column names are available at-a-glance, and full view of the schema is available on hover
Inspect DataFrames
The Variable Explorer provides a convenient one-click action to inspect all variables, including DataFrames. You can click on any DataFrame to explore it in a new notebook cell, allowing you to easily visualize or profile it.
Step through debug your code with pdb
The Variable Explorer also allows you to step-through debug Python code leveraging the support for pdb in the Databricks Notebook.
You can set breakpoints with breakpoint() or pdb.set_trace(). When you run the cell, the execution will pause at the breakpoint and the Variable Explorer will automatically update with the state of the notebook at that breakpoint.
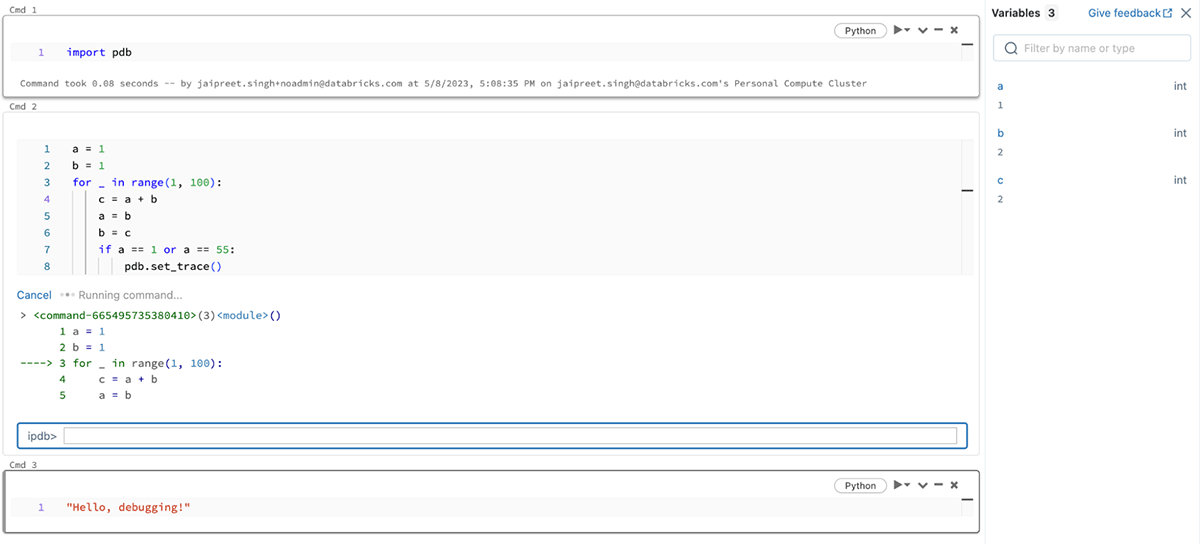
You can then step through your code with pdb's debugger controls like continue and the Variable Explorer will be automatically updated as the notebook's state changes.
Try it today
Variable Explorer is enabled by default for Databricks Runtime 12.1 and above. Simply open a Python notebook and start using it today. Learn more in our developer documentation.
Get the latest posts in your inbox
Subscribe to our blog and get the latest posts delivered to your inbox.