Pipeline Flow Monitoring
Advancing Predictive Maintenance for Gas Pipelines
by Reishin Toolsi, Jason Viel, Amar Sethi and Brett Aulbaugh
- Unplanned maintenance on gas pipelines due to flow pressure anomalies can result in significant costs, including lost production, emergency repairs, and environmental liabilities. Here's a breakdown of key cost factors and estimates: Unplanned downtime: A 1% downtime rate (3.65 days) costs over $5 million yearly, while severe cases average $38 million annually for offshore operators
- Databricks offers a Lakehouse Decision model solution, which implements a modern lakehouse architecture for your gas pipeline network, integrating real-time analytics, historical data, and AI-driven insights to enable smarter, faster decisions.
- The Databricks Data Intelligence Platform revolutionizes oilfield operations by unifying data, offering AI-driven tools like natural language visualizations and intelligent search, and ensuring robust governance, resulting in tangible benefits such as rapid issue resolution, enhanced cross-team collaboration that contributes to predictive maintenance, to significantly reduce downtime.
Revolutionizing Predictive Maintenance for Gas Pipelines
A major gas pipeline rupture is every midstream company's worst nightmare, a catastrophic event with far-reaching consequences. Millions of cubic feet of gas are lost in an instant, triggering a scramble among energy crews to contain the damage. The environmental toll is staggering: methane, a potent greenhouse gas, floods the atmosphere, while soil and water contamination devastate local ecosystems. The financial fallout is equally severe, with repair costs and regulatory fines soaring into the millions.
In today’s high-stakes energy landscape, the pressure on midstream companies to maintain pipeline integrity has never been greater. Downtime costs millions, regulatory scrutiny intensifies, and public trust hangs by a thread. Traditional scheduled maintenance simply cannot keep pace with the risks of aging infrastructure and escalating environmental concerns. Proactive measures and advanced technologies are no longer optional; they are critical to preventing these devastating scenarios and keeping a Social License To Operate.
Databricks' Pipeline Flow Monitor as an analytic solution built on Databricks, transforms how gas pipeline operators approach maintenance by leveraging real-time data analytics and machine learning to predict and prevent failures before they occur. This innovative approach not only reduces costly downtime but also enhances safety, environmental protection, and operational efficiency.
The High Cost of Pipeline Failures
The industry is shifting towards proactive, data-driven approaches to mitigate these risks. In the intricate world of gas pipeline networks, where thousands of components operate ceaselessly, the specter of failure looms large. The impact of such failures extends far beyond mere operational hiccups, potentially triggering a cascade of financial, environmental, and safety consequences.
The Cost of Downtime: A Multi-Million Dollar Dilemma
For midstream operators, pipeline failures translate directly into substantial financial losses. Industry estimates suggest that:
- A mere 1% downtime rate (equivalent to 3.65 days per year) can result in over $5 million in annual losses.
- In severe cases, unplanned downtime may cause offshore operators to suffer average yearly losses of up to $38 million.
These figures underscore the critical need for effective maintenance strategies and highlight the inadequacies of current practices.
Beyond Financial Implications: Safety and Environmental Concerns
Pipeline failures don't just hit the bottom line; they also pose significant risks to:
- Environmental integrity: Gas leaks can cause ecological damage and contribute to greenhouse gas emissions.
- Public safety: Failures in populated areas can lead to evacuations and potential hazards.
- Regulatory compliance: Incidents may result in fines and increased scrutiny from regulatory bodies.
The Value of Predictive Maintenance for Gas Pipeline Operators
Predictive maintenance is transforming pipeline infrastructure management by using advanced sensors and analytics to anticipate equipment failures before they occur. Continuous monitoring of pressure, flow rates, and structural integrity helps detect subtle anomalies that precede major issues, improving both reliability and safety.
Key benefits include:
- Reduced downtime through proactive detection and response, minimizing costly unplanned outages.
- Lower maintenance costs by optimizing schedules and resource allocation with data-driven insights.
- Extended equipment lifespan as early interventions prevent small issues from escalating into major failures.
- Enhanced efficiency through streamlined operations and improved energy utilization.
- Improved safety and compliance by reducing the risk of incidents and ensuring adherence to regulatory standards.
By leveraging data and machine learning, predictive maintenance shifts pipeline operations from a reactive model to a proactive, intelligence-driven approach—redefining asset management as a strategic advantage.
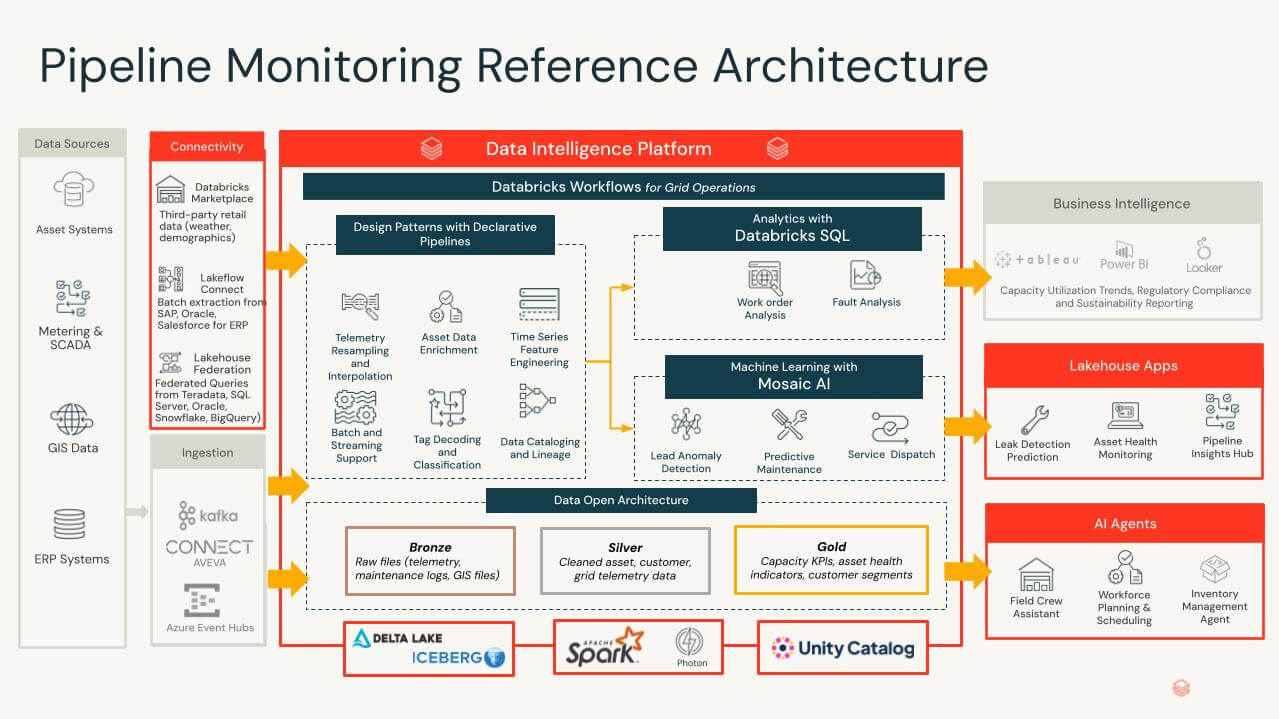
Introducing Pipeline Flow Monitor
Built on the Databricks Data Intelligence Platform, Pipeline Flow Monitor transforms raw sensor data into actionable maintenance insights. Leveraging Databricks' Lakeflow Declarative Pipelines for data ingestion and transformation, this solution uses Databricks Apps to deliver real-time insights. By analyzing flow rates, pressure, and temperature, it detects potential failures weeks in advance. The system excels in real-time anomaly detection and can identify leaks as small as 0.01% of throughput using mass balance systems. This proactive approach optimizes operations, reduces costs, and ensures pipeline safety and efficiency.
Getting Started with Pipeline Flow Monitor
Implementing predictive maintenance for your gas pipeline network is straightforward with Databricks. The solution can be deployed in weeks rather than months, with a clear ROI typically visible within the first quarter of operation. This solution is ideal for midstream gas companies operating extensive pipeline networks and looking to improve operational efficiency and reduce risks. In addition this solution can easily integrate and complements your existing SCADA data providers. We have partnerships with AVEVA that better handle your PI data and a recent partnerships with SAP, allows you to get insights from your ERP data.
The end-to-end predictive process includes:
Data Ingestion
The data ingestion process begins by collecting raw sensor data from various sources across the pipeline network and storing it in the Bronze Layer, which acts as the landing zone for unprocessed data. This layer captures high-frequency sensor outputs, such as flow rates, pressure, and temperature, in their original form to ensure traceability and preserve historical records. The raw data is ingested in real-time or batches, depending on the source, and stored in a schema-on-read format to accommodate diverse data structures. Detailed metric descriptions ingested into the Delta lake can be seen below:
| Metric Name | Description | Unit of Measurement | Importance | Data Type |
|---|---|---|---|---|
| Flow Rate | Volume of gas passing through the pipeline | CFM (cubic feet per minute) or m³/s | Primary metric for throughput analysis | Continuous numeric |
| Pressure | Force exerted by gas on pipeline walls | psi (pounds per square inch) or kPa | Critical for detecting anomalies | Continuous numeric |
| Temperature | Temperature of gas in the pipeline | °F (Fahrenheit) or °C (Celsius) | Important for flow dynamics and safety | Continuous numeric |
| Gas Composition | Chemical makeup of gas (e.g., methane content) | Percentage (%) | Crucial for quality control | Categorical/numeric |
| Vibration Data | Mechanical vibrations in equipment | mm/s or Hz | Indicator of mechanical wear and tear | Time-series numeric |
| Equipment Metadata | Information about equipment and infrastructure | N/A | Provides context for analysis | Categorical |
| Geospatial Data | Location and altitude information | Coordinates, elevation (m or ft) | Useful for mapping and environmental factors | Spatial numeric |
Data Processing
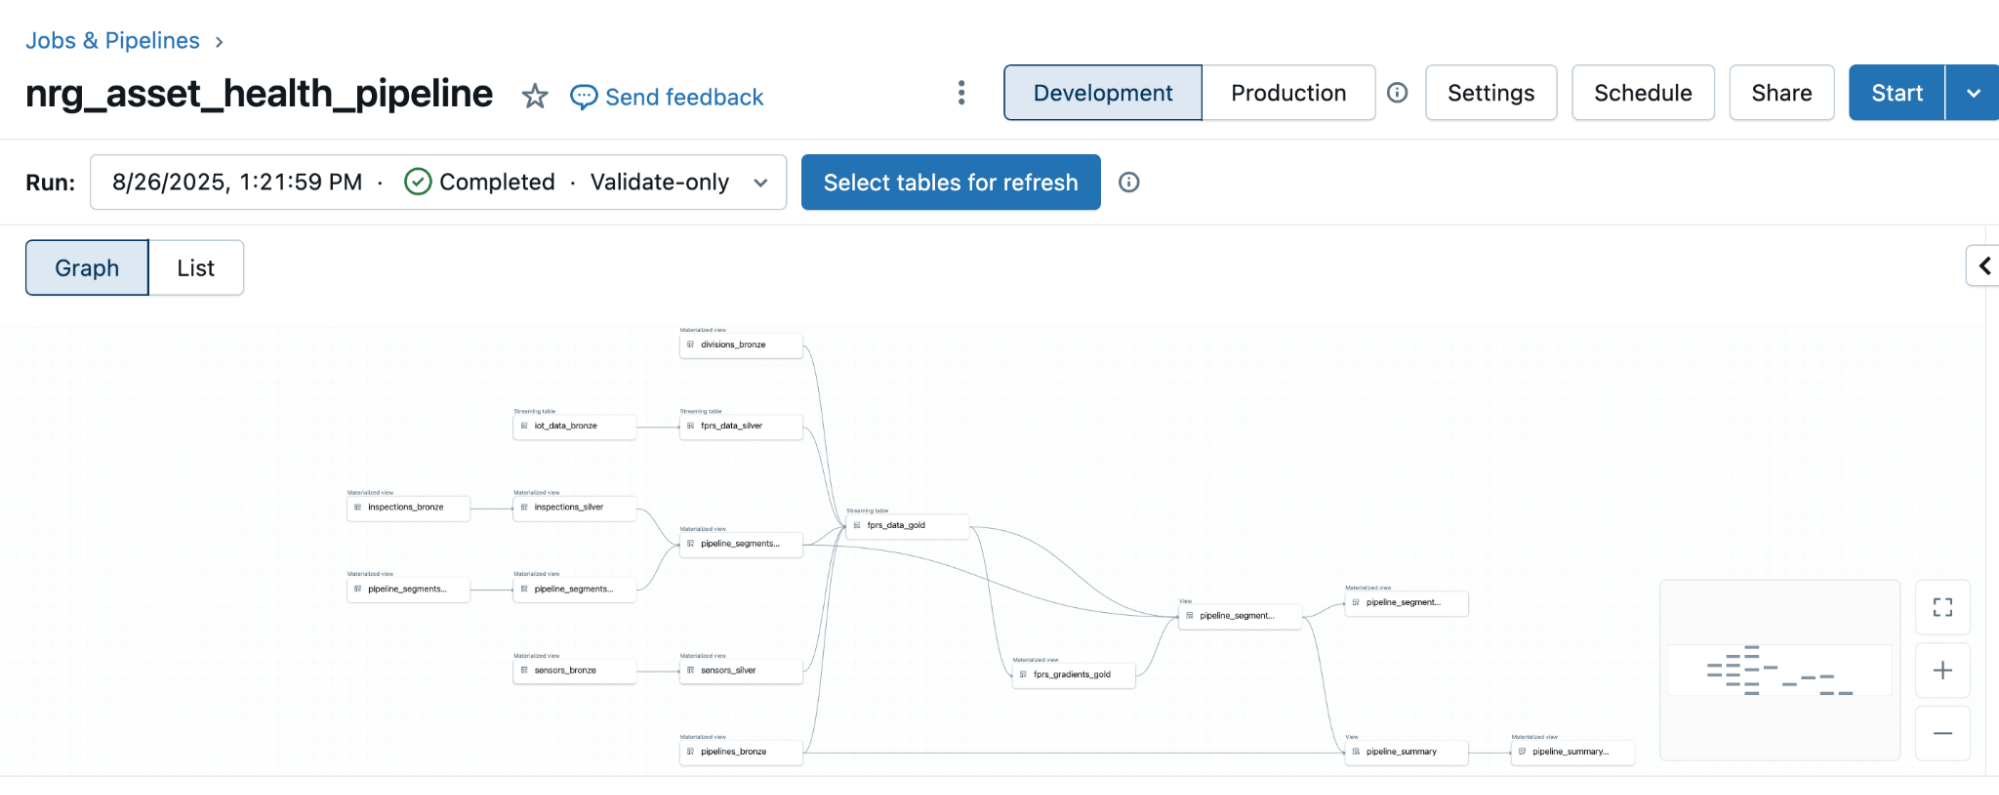
From the Bronze Layer, the data undergoes processing and cleansing to address issues like missing values, outliers, and inconsistencies. This step ensures that only high-quality data is passed to the Silver Layer, where it is further refined and enriched with contextual information, such as equipment metadata or geospatial attributes. Raw sensor data often contains issues such as missing values, outliers, or inconsistencies due to sensor malfunctions or communication errors. Lakeflow Declarative Pipelines simplifies the data cleansing process by applying rules to remove null values, handle outliers, and standardize formats. For example:
- Missing flow rate values can be filled using historical averages.
- Pressure readings outside expected thresholds are flagged for further investigation.
Finally, the cleansed data flows into the Gold Layer, where it becomes fully enriched and ready for advanced analytics and reporting. Examples of this Gold layer enrichment include:
- Rolling Average Flow Rates: Calculating 5-minute rolling averages to smooth out short-term fluctuations and identify trends in gas flow.
- Pressure Gradient Changes: Analyzing pressure differences across pipeline segments to detect potential blockages or leaks.
- Temperature Differentials: Comparing temperature readings between adjacent sensors to identify thermal anomalies that could indicate operational issues.
These derived metrics are critical for proactive decision-making and help operators quickly identify areas of concern.
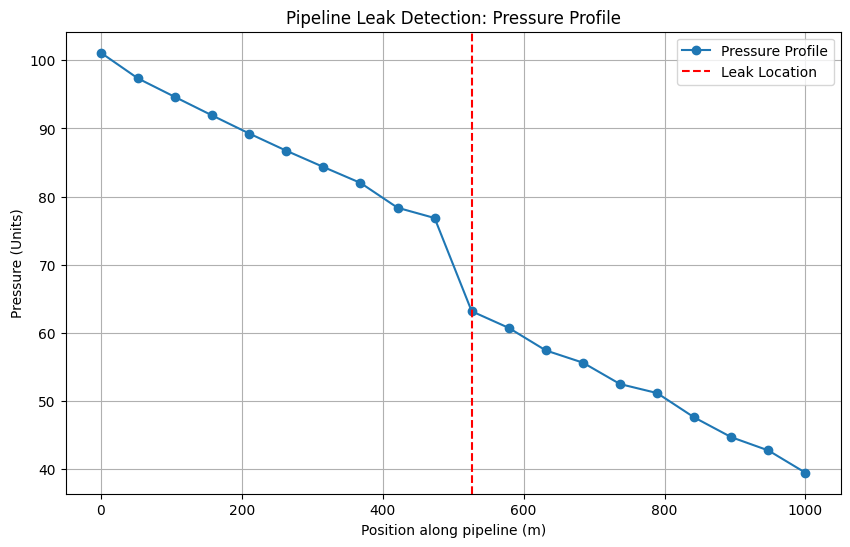
Modeling Leak Detection
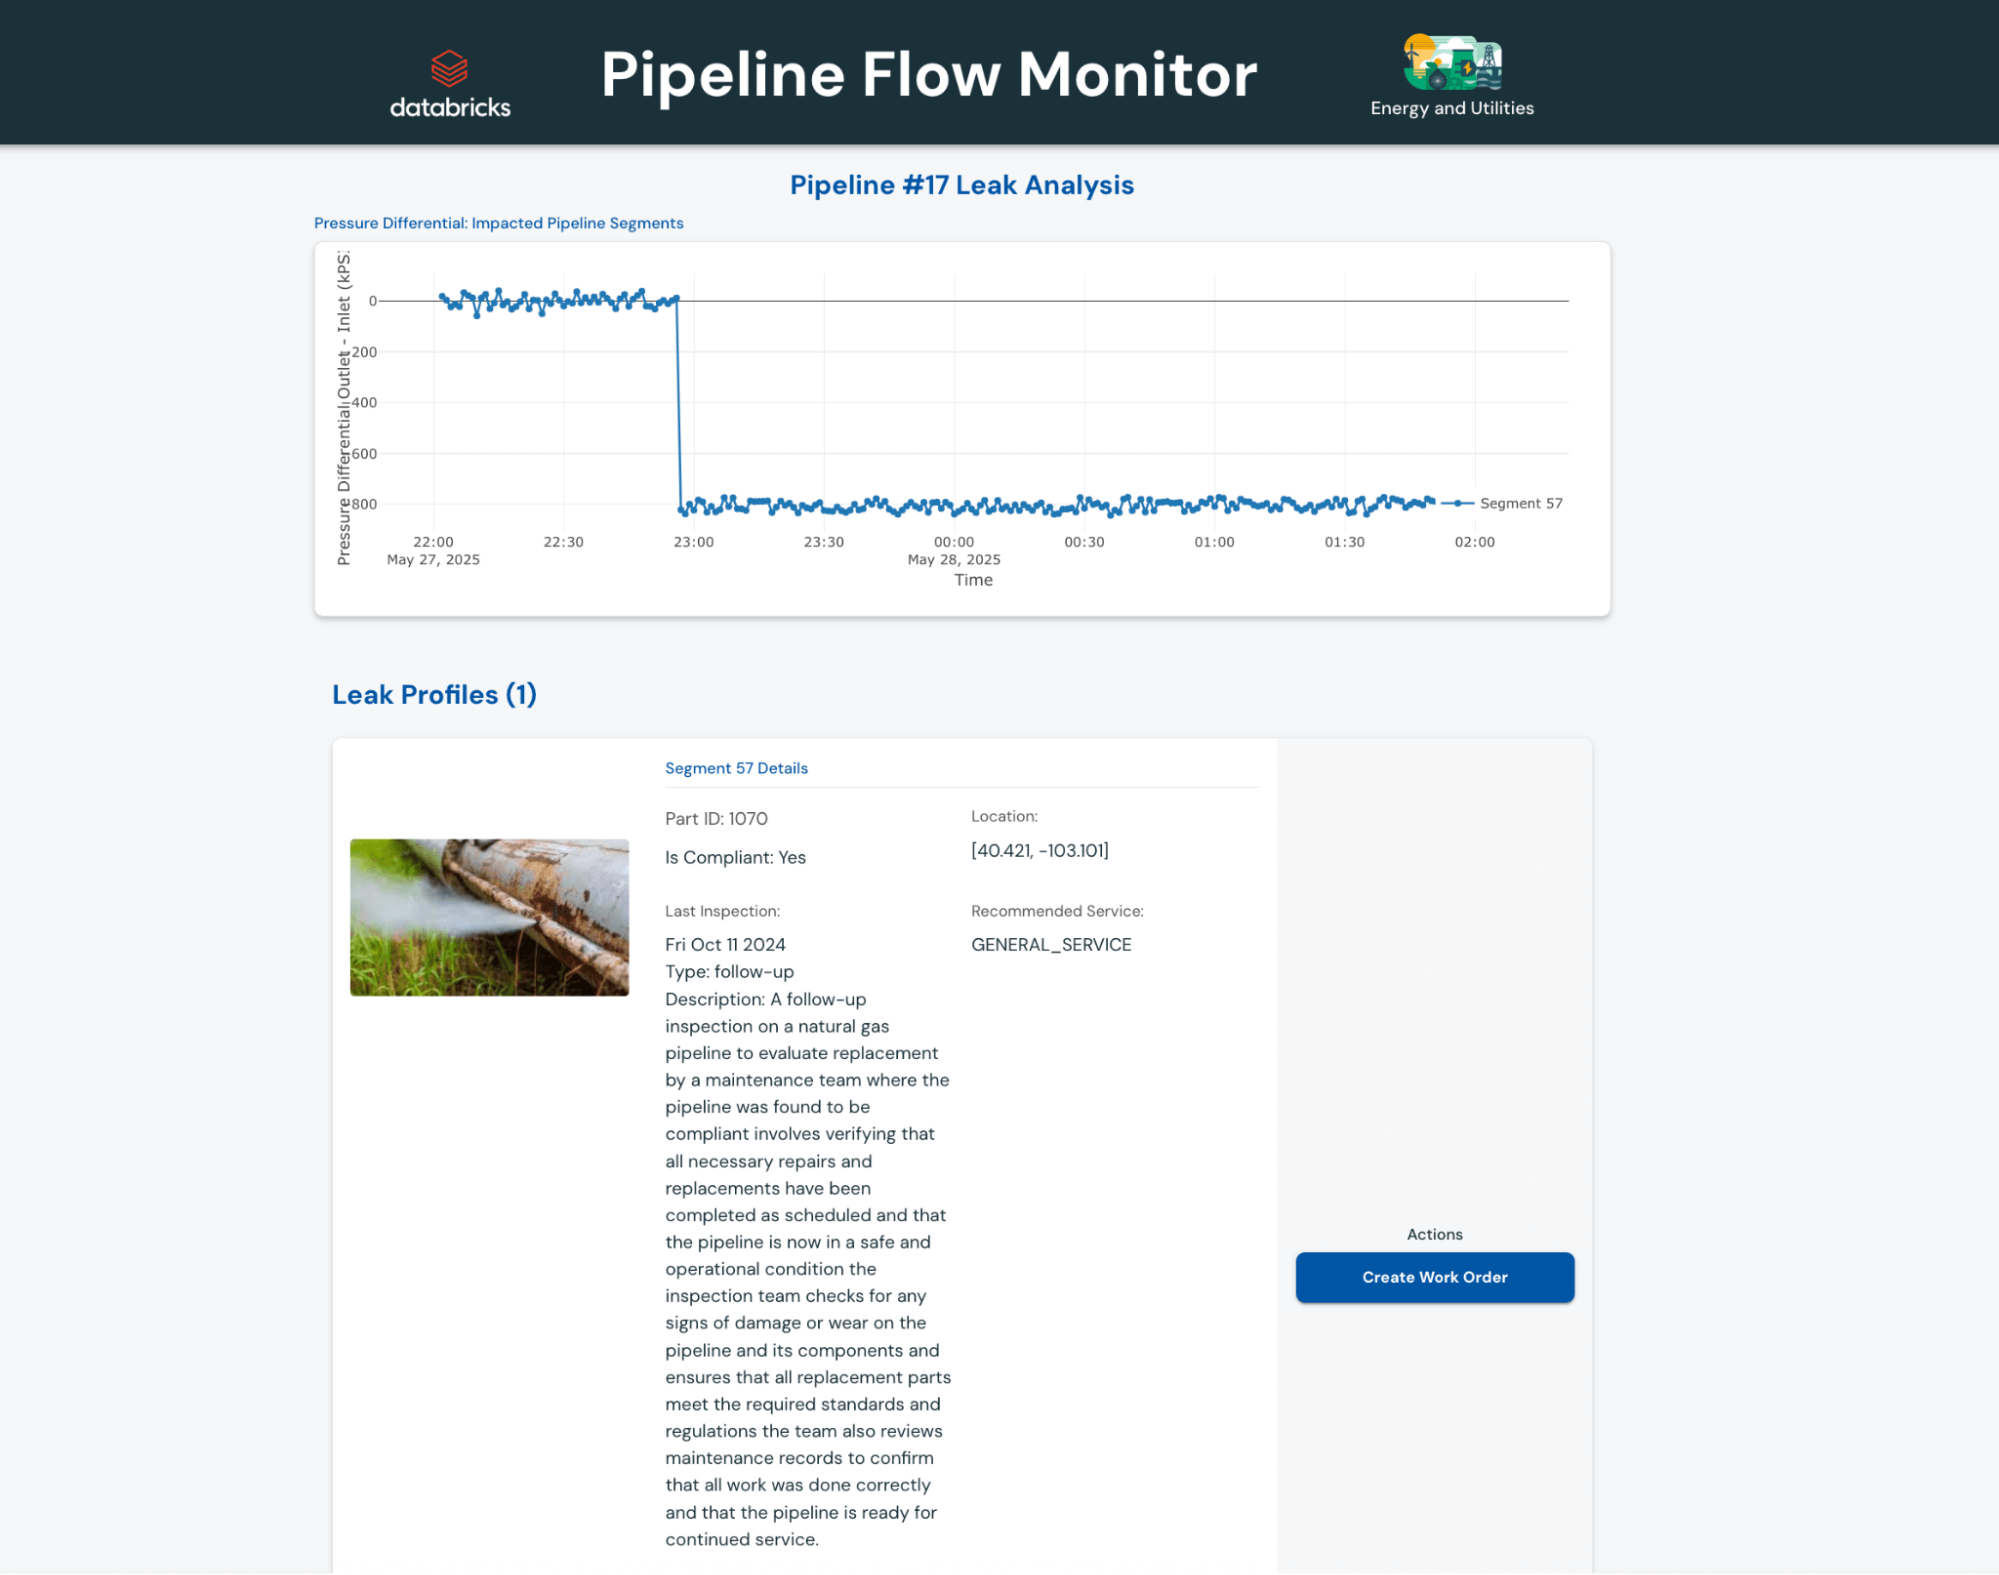
Detecting pipeline leaks relies on identifying deviations from normal operational parameters. Under standard operating conditions, pressure within a pipeline decreases linearly from the inlet to the outlet due to frictional losses. However, the presence of a leak disrupts this predictable pattern, causing a sudden and anomalous pressure drop at and beyond the leak's location. This behavior can be modeled mathematically as follows: P(x) = P₀ − k ⋅ x
Where:
- P(x): Pressure at position x along the pipeline
- P₀: Inlet pressure (pressure at the start of the pipeline)
- k: Pressure gradient (rate of pressure loss due to friction)
A leak introduces an additional pressure drop that disrupts this linear relationship, creating a detectable anomaly in the pressure profile. These anomalies form distinct patterns that can be identified using advanced machine learning techniques.
Visualization & Reporting
Effective leak detection doesn’t stop at identifying anomalies, it requires actionable insights delivered through intuitive visualizations and real-time reporting. Using Databricks' suite of tools, we’ve built a robust visualization and reporting framework that empowers operators to monitor pipeline health, detect leaks, and respond swiftly to anomalies. Actionable insights derived from real-time analytics can significantly enhance pipeline operators' ability to detect and respond to leaks swiftly. By creating interactive visualizations and receiving timely data-driven information, operators can rapidly identify anomalies and potential leaks. These insights provide a comprehensive framework for monitoring pipeline integrity, allowing operators to make data-driven decisions and initiate immediate responses to maintain safe and efficient pipeline operations.
With these insights, crews can respond faster by pinpointing the exact location of leaks and allocating resources more effectively. This targeted approach reduces response times and minimizes the impact of leaks on the environment and surrounding communities. Additionally, having real-time data helps crews prepare the necessary equipment and personnel in advance, ensuring that they are fully equipped to handle the situation as soon as they arrive on site. This streamlined response process not only enhances safety but also helps in reducing downtime and associated costs.
We achieve advanced analytical insights through Databricks Apps which is leveraged for sophisticated and real-time monitoring of pipeline leaks. Unlike traditional dashboards, Databricks Apps enable us to build highly customized, dynamic applications tailored for complex use cases such as monitoring streaming pressure gradients and incorporating real-time visual inspections.
Key features include:
- Pipeline Section Health Predictions: Quickly understand which pipeline sections are healthy and which have been flagged as having potential integrity issues. These predictions come directly from our machine learning models referenced in the section above
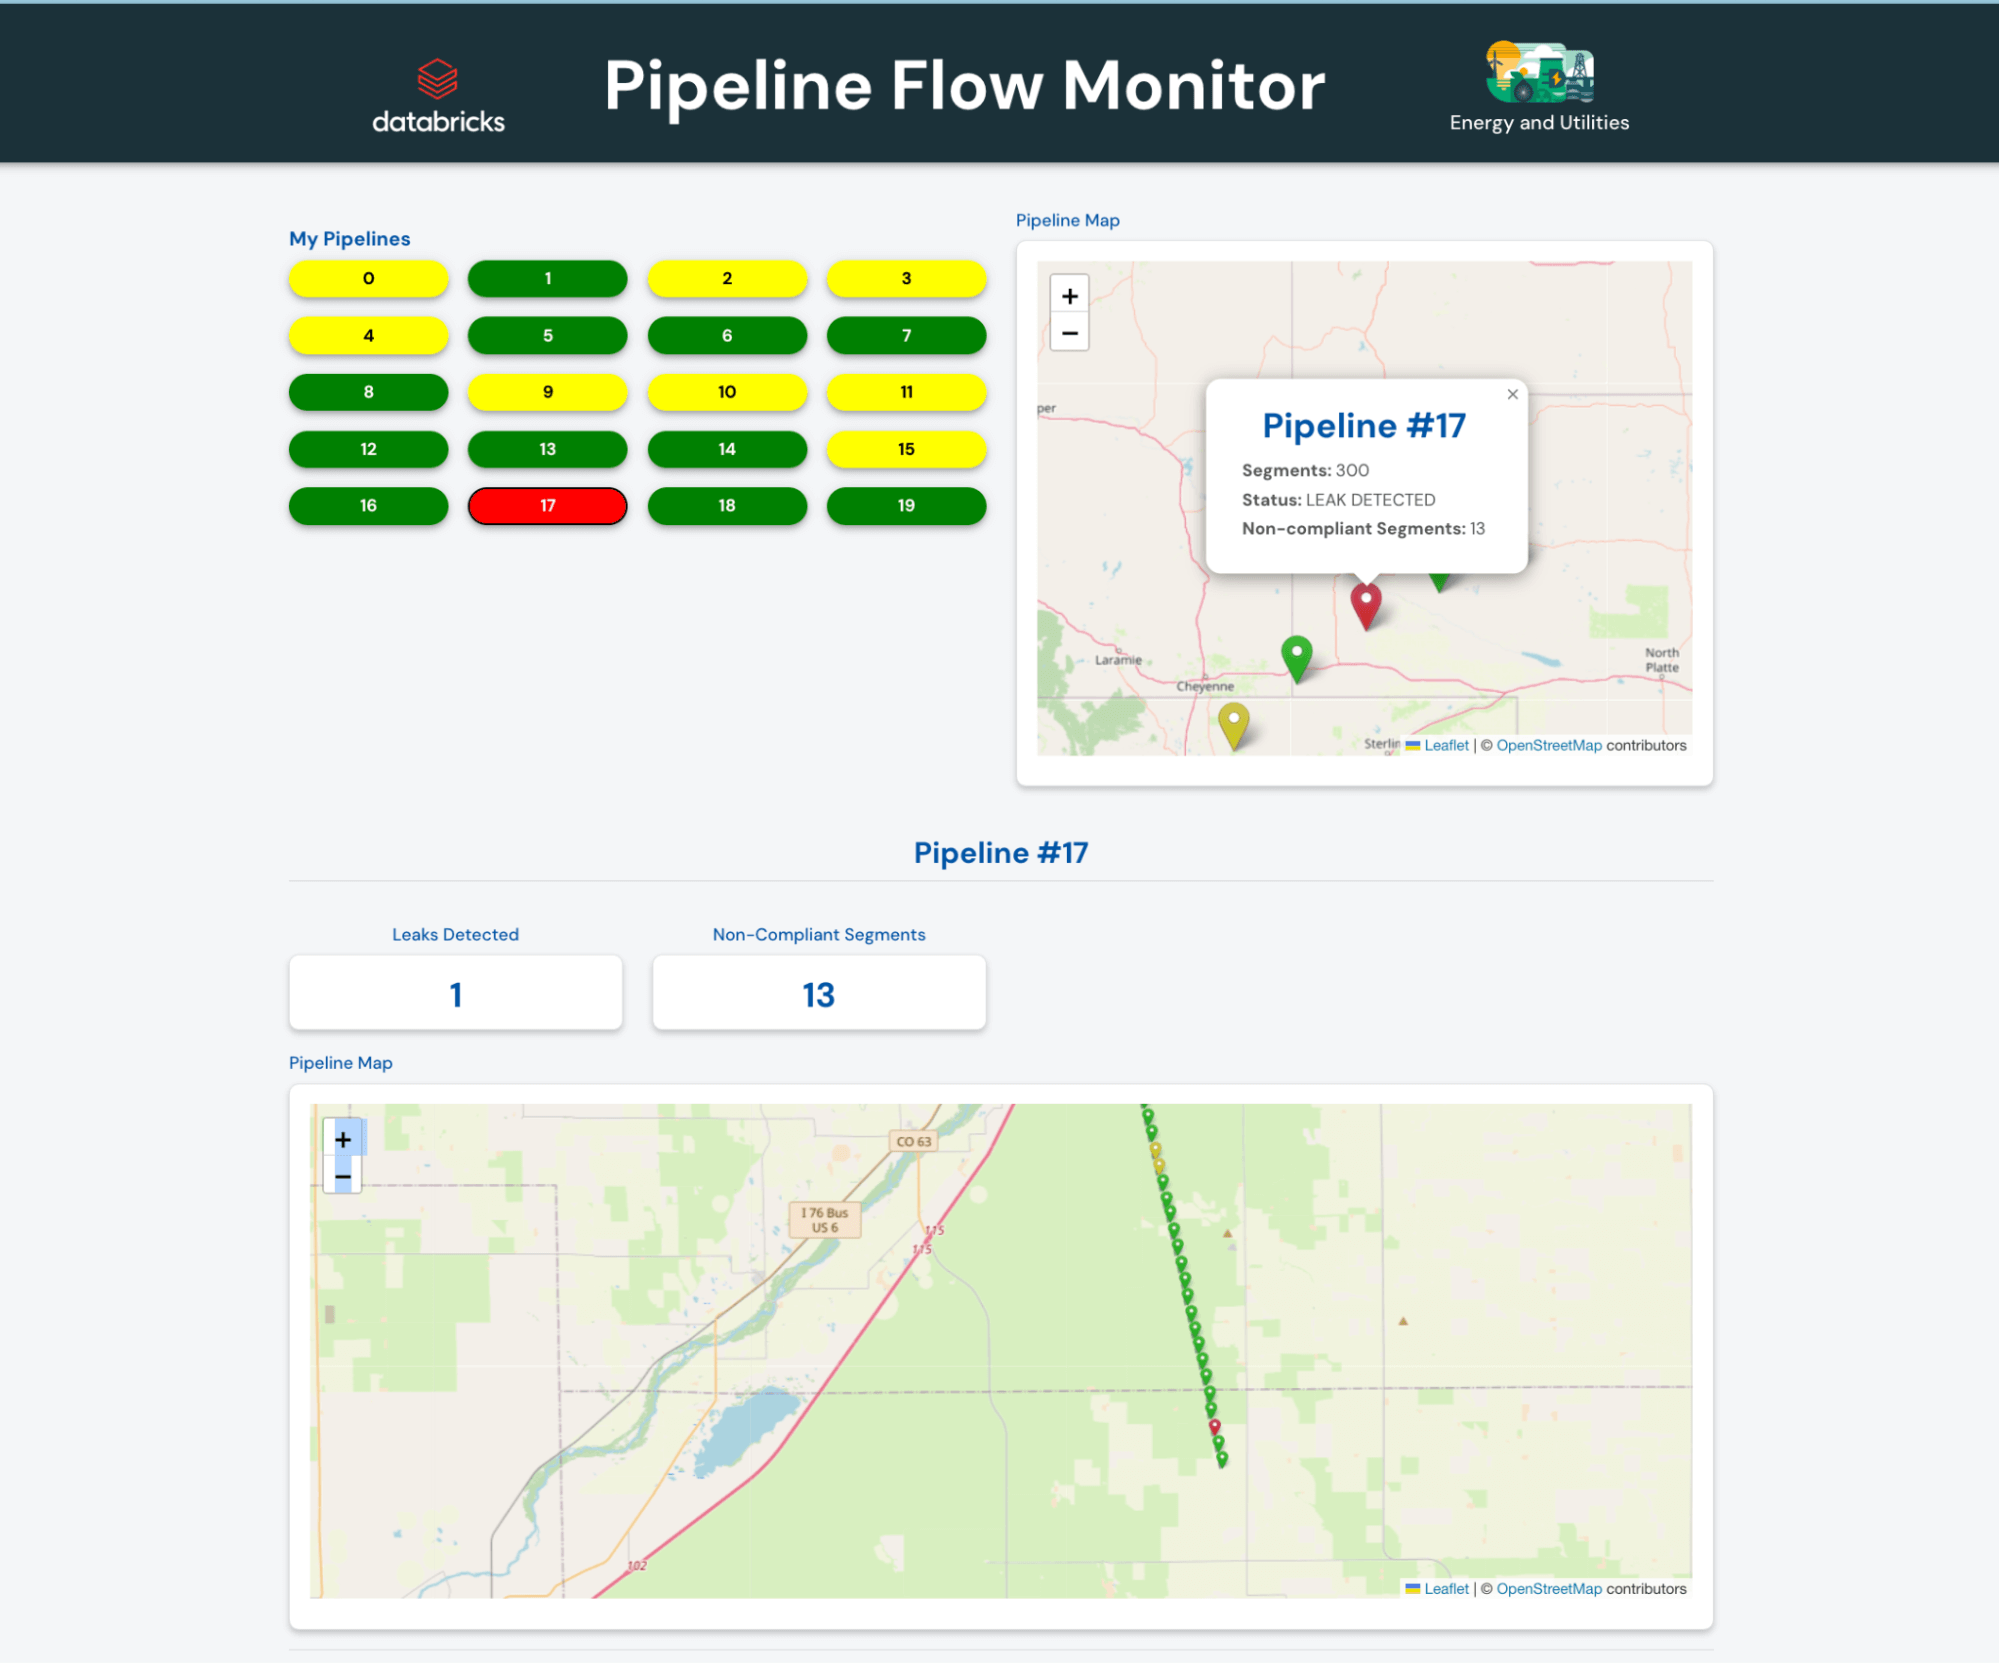
- Pressure Gradient Visualizations: Display pressure changes along the pipeline, allowing operators to pinpoint abnormal drops caused by potential leaks.
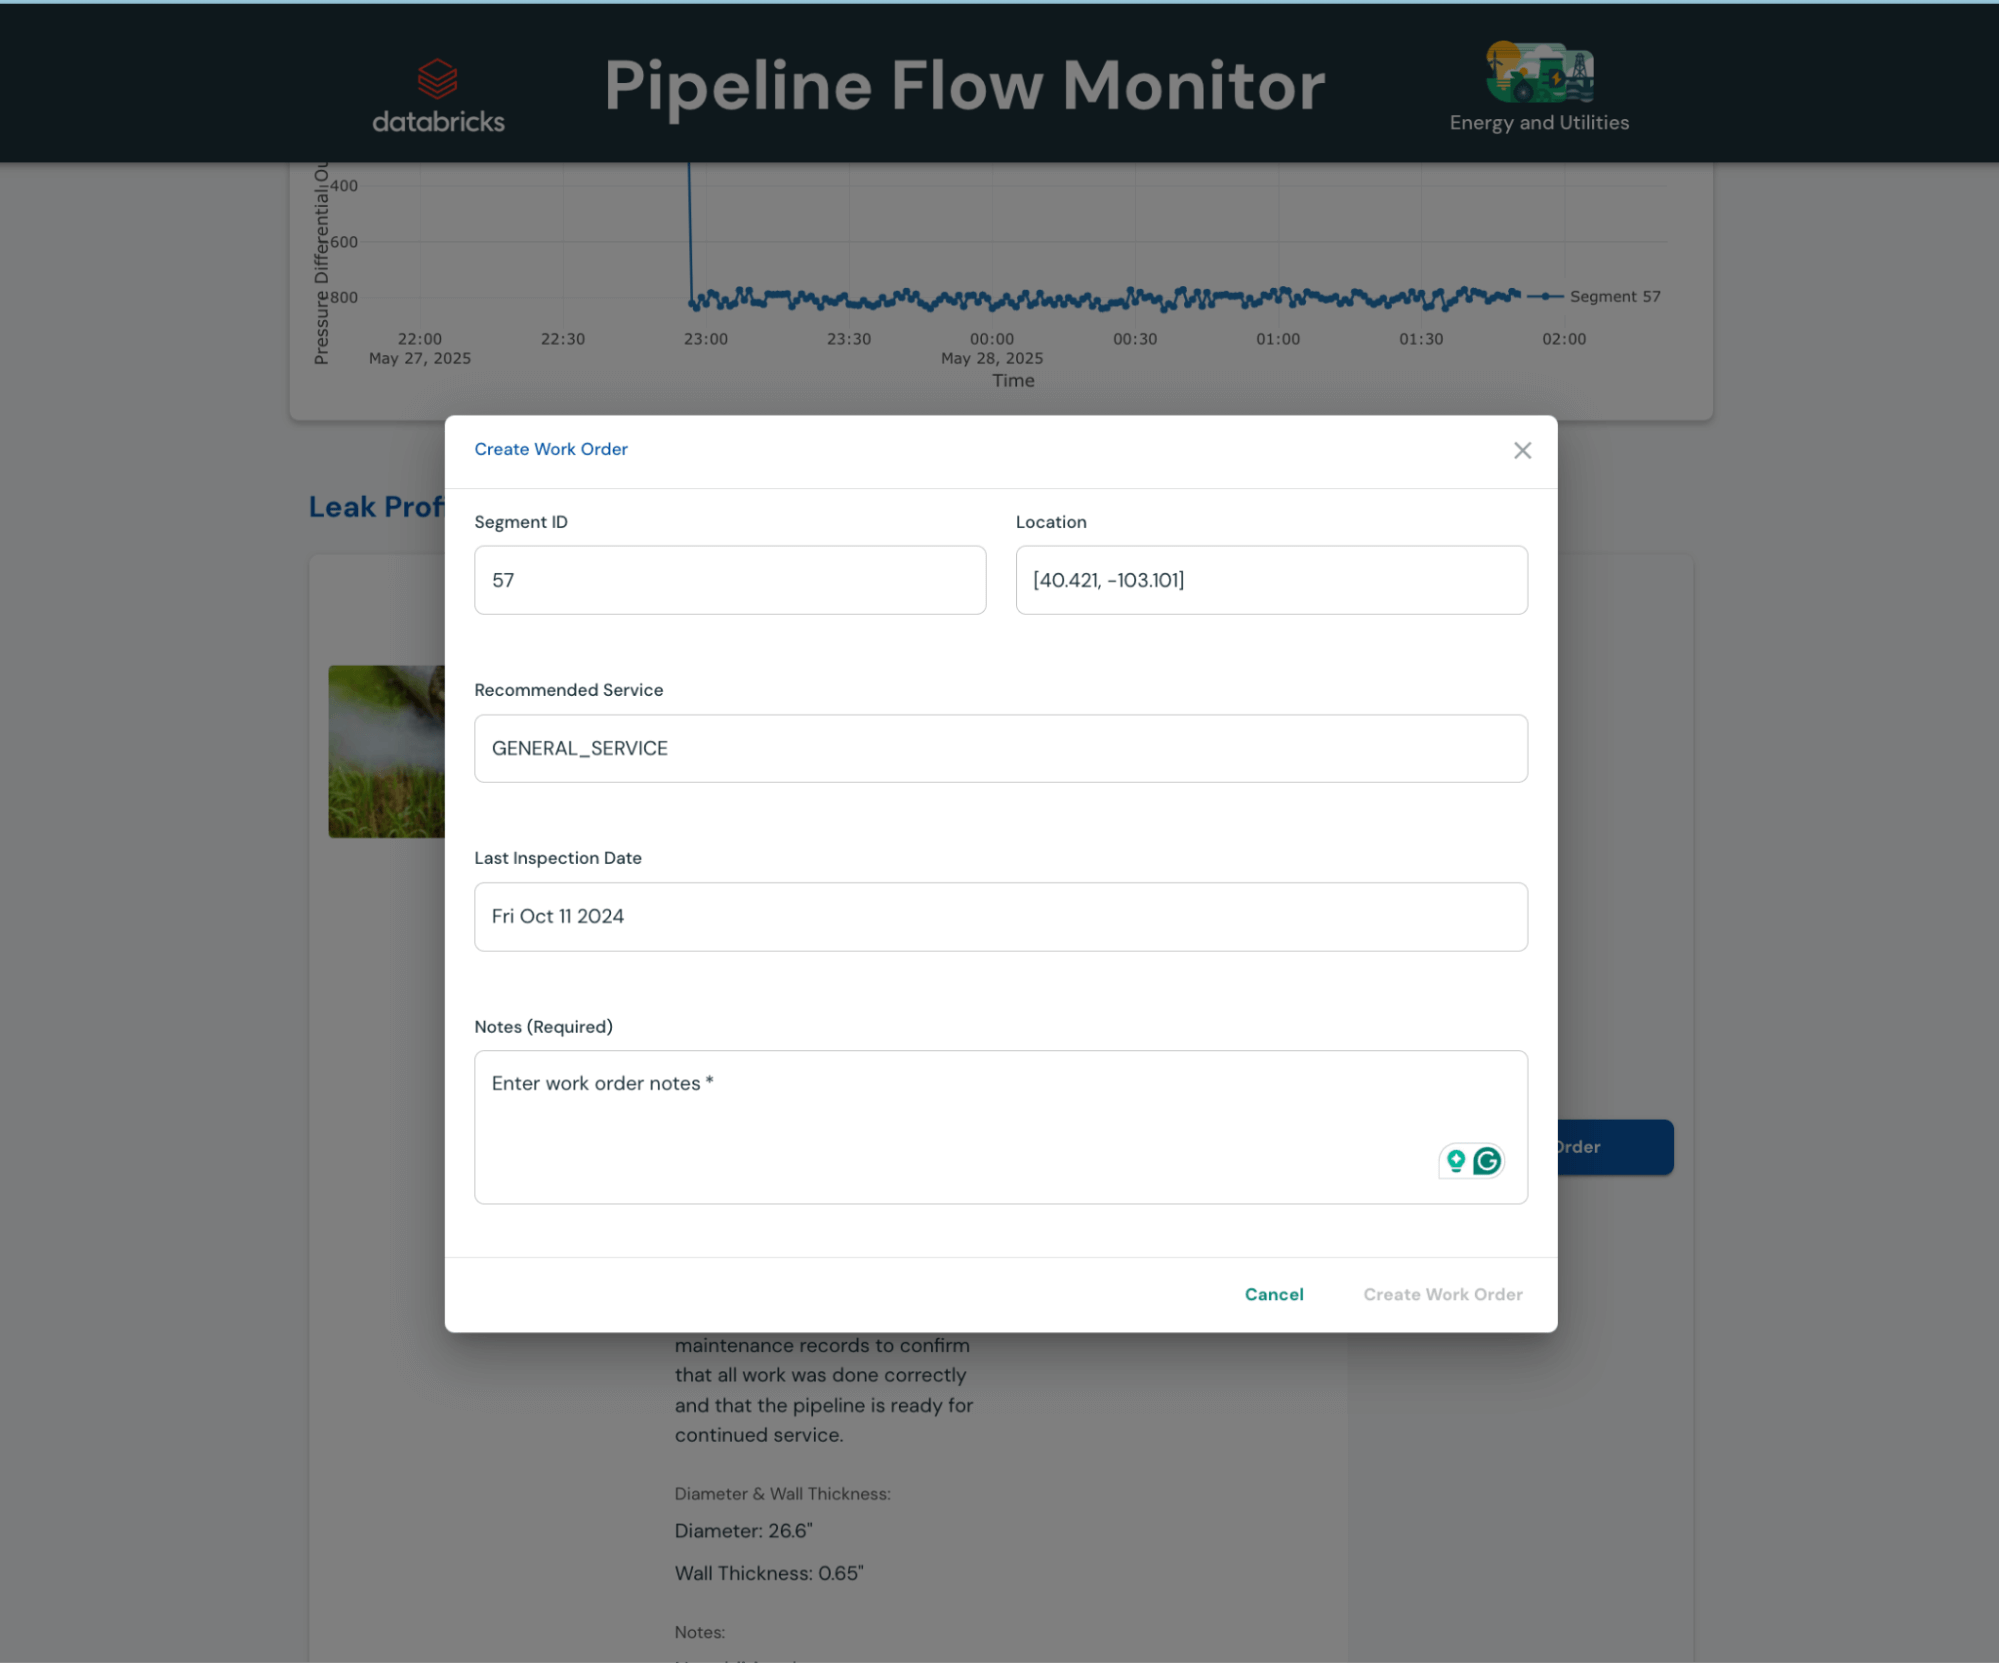
- Workorder Management: Quickly create work orders on impacted pipeline sections that integrate with existing crew management software to expedite resource deployment for potential leaks. With the introduction of Lakebase, creating transactional records that integrate with existing systems has become quicker and easier than ever.
Conclusion
The integration of Pipeline Flow Monitor with the Databricks Unified Analytics Platform represents a transformative step for gas pipeline maintenance. By uniting big data and AI in a single workspace, this solution enables predictive monitoring that reduces downtime, lowers costs, improves safety, strengthens compliance, and enhances environmental protection. In an industry where delays cost millions, Pipeline Flow Monitor—powered by Databricks—elevates maintenance from a cost center to a strategic asset. Adopting this data-driven approach ensures more reliable, efficient, and sustainable pipeline operations, setting a new standard for the future of midstream energy infrastructure.
For a personalized demo and discussion on transforming your energy operations, contact your Databricks representative. Review more industry specific use cases around harnessing the power of Databricks here.
Get the latest posts in your inbox
Subscribe to our blog and get the latest posts delivered to your inbox.