Revolutionizing Car Measurement Data Storage and Analysis: Mercedes-Benz's Petabyte-Scale Solution on the Databricks Intelligence Platform
by Dr. Thomas Bonfert, Jonathan Bräuer, Dr. Xuan Wang and Florian Doll
- Mercedes-Benz partnered with Databricks to build a novel data model on the Databricks Intelligence Platform for representing and analyzing petabytes of vehicle time series data while optimizing cost and scalability.
- We evaluated and benchmarked multiple data layouts of the model on real world Mercedes-Benz data and identified using Run-Length-Encoding with Liquid Clustering as the best suited data layout.
- Our approach balances storage requirements and execution speed, enabling faster, more efficient automotive time series data analysis to drive future-proof innovation.
Abstract
With the rise of connected vehicles, the automotive industry is experiencing an explosion of time series data. Hundreds of Electronic Control Units (ECUs) continuously stream data across in-vehicle networks in high frequencies (1Hz-100Hz). This data offers immense potential for predictive analytics and innovation, but extracting knowledge at petabyte scale presents major technical, financial, and sustainability challenges.
In this blog post, we introduce a novel hierarchical semantic data model tailored for large-scale time series data. Leveraging the latest features (e.g. liquid clustering) introduced by the Databricks Intelligence Platform, it enables scalable and cost-efficient analytics - transforming raw automotive measurement data into actionable insights that drive vehicle development, performance tuning, and predictive maintenance.
Additionally, we share benchmarks based on real-world data from Mercedes-Benz and compare state-of-the-art data optimization strategies to evaluate performance across key industry use cases.
Introduction
Time series analysis in the automotive industry isn’t just number crunching; it's like reading the pulse of every vehicle on the road. Each data point tells a story, from the subtle vibrations of an engine to split-second decisions of autonomous driving systems or even driver-vehicle interactions. As these data points coalesce into trends and patterns, they reveal insights that can revolutionize vehicle development, enhance safety features, and even predict maintenance needs before a single warning light flashes on a dashboard.
However, the sheer volume of this data presents a formidable challenge. Modern vehicles, equipped with hundreds of ECUs, generate a massive amount of time series data. While collecting and storing this wealth of information is crucial, the real challenge—and opportunity—lies in harnessing its power to move beyond simple reporting to forward-looking predictive analytics using ML & AI.
At the heart of this challenge is the need for a universally applicable, efficient, and scalable model for representing time series data — one that supports both well-defined and emerging use cases. To meet this need, we introduce a novel hierarchical semantic data model that addresses the complexity of automotive time series analysis, transforming raw measurement data into a strategic asset.
In developing this data model, we focused on three critical aspects:
- Cost-efficient and Scalable Data Access: A data model should be designed to support common query patterns in time series data analysis, enabling rapid and resource-efficient processing of massive datasets.
- Usability: Ease of use for data practitioners as well as domain experts is critical, ensuring that working with the data is straightforward and intuitive, regardless of the scale to get insights quickly without spending hours on writing queries.
- Data Discoverability & Data Governance: Minimizing the data model for time series data of up to thousands or millions of different signals and contextual metadata is crucial for governance and maintainability. Data of an arbitrary number of car fleets can be easily registered in a few Unity Catalog tables and users can securely discover, access and collaborate on trusted data.
In collaboration with Mercedes-Benz AG, one of the largest premium vehicle manufacturers based in Stuttgart Germany, we enhance the data model based on ASAM standards to help Mercedes-Benz to develop the most desirable car leveraging the power of Mercedes-Benz Operating System (MB.OS). Like the Mercedes-Benz Vision EQXX concept car, which sets new benchmarks for electric range and efficiency, we are pushing the analytics performance and efficiency to an entirely new level by using cutting-edge technologies.
In this blog post, we showcase productive data analytics use cases and real-world data to demonstrate the capabilities of our extended data model across various setups. Additionally, we conducted scientific research on different optimization strategies and performed systematic benchmarks on Z-Ordering and Liquid Clustering data layouts.
A hierarchical semantic data model for addressing the three critical aspects
This data model can represent time series data of tens of thousands signals in a single table and includes a hierarchical representation of contextual metadata. Our model, therefore, provides the following advantages:
- Efficient Filtering: The hierarchical structure allows for rapid filtering across multiple dimensions, enabling analysts to quickly narrow down their search space.
- Semantic Relationships: By incorporating semantic relationships between samples and contextual metadata, the model facilitates more intuitive and powerful querying capabilities.
- Scalability: The hierarchical nature of the model supports efficient data organization as the volume grows to petabyte scale.
- Contextual Integration: The semantic layer allows for seamless integration of contextual metadata, enhancing the depth of analysis possible.
The Core Data Model
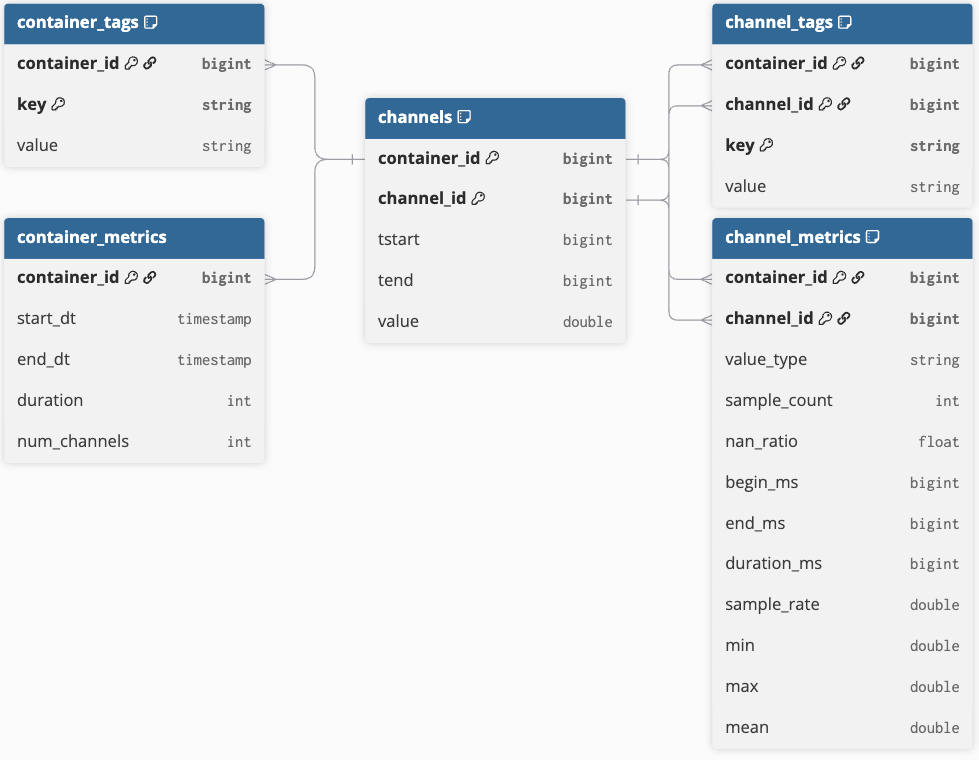
The core model consists of five tables that efficiently represent time series data and contextual metadata (see Figure 1 for the Entity Relationship diagram). Central to the model is the samples table, which contains time series data in a narrow format with two identifier columns: container_id and channel_id. The container_id serves as a unique identifier for a collection of time series objects, while channel_id uniquely identifies each time series (or channel) within that container. This structure enables distributed analysis of the underlying time series data.
In the automotive context, a container includes predefined channels recorded by car data loggers during a test drive and stored in a single file. However, multiple measurement files can be grouped into a single container if measurements from a trip are split due to size constraints. This concept also applies to continuous time series data streams (e.g., from IoT devices), where container boundaries can be defined by time (e.g., hourly or daily) or by process knowledge, such as splitting streams based on production steps or batches.
All sample data is stored using run-length encoding (RLE), merging consecutive samples with the same value into a single row defined by a starting time (“tstart”), an ending time (“tend”) and the recorded value. The ending time is non-inclusive, marking the transition to the next value. RLE is a simple compression method that facilitates efficient analysis, such as calculating histograms by bucketing values and summing the duration (tend - tstart). Each row is indexed by container_id, channel_id, and the active timeframe. This core samples table is kept simple to minimize storage size and enhance query performance.
In addition to the samples table, we have 4 tables to represent the contextual metadata:
- “container_metrics” and “container_tags” are indexed by their given “container_id”.
- “channel_metrics” and “channel_tags” metadata is additionally identifiable by the corresponding “channel_id”.
- Both metrics tables have a static schema which contains valuable information for pruning queries.
- Both tags tables are used as a simple key-value-pair store that can hold any kind of metadata.
Some metadata can be extracted directly from measurement files; tags can also be enriched from external metadata sources to give a context to linked containers and signals.
Mercedes-Benz Implementation
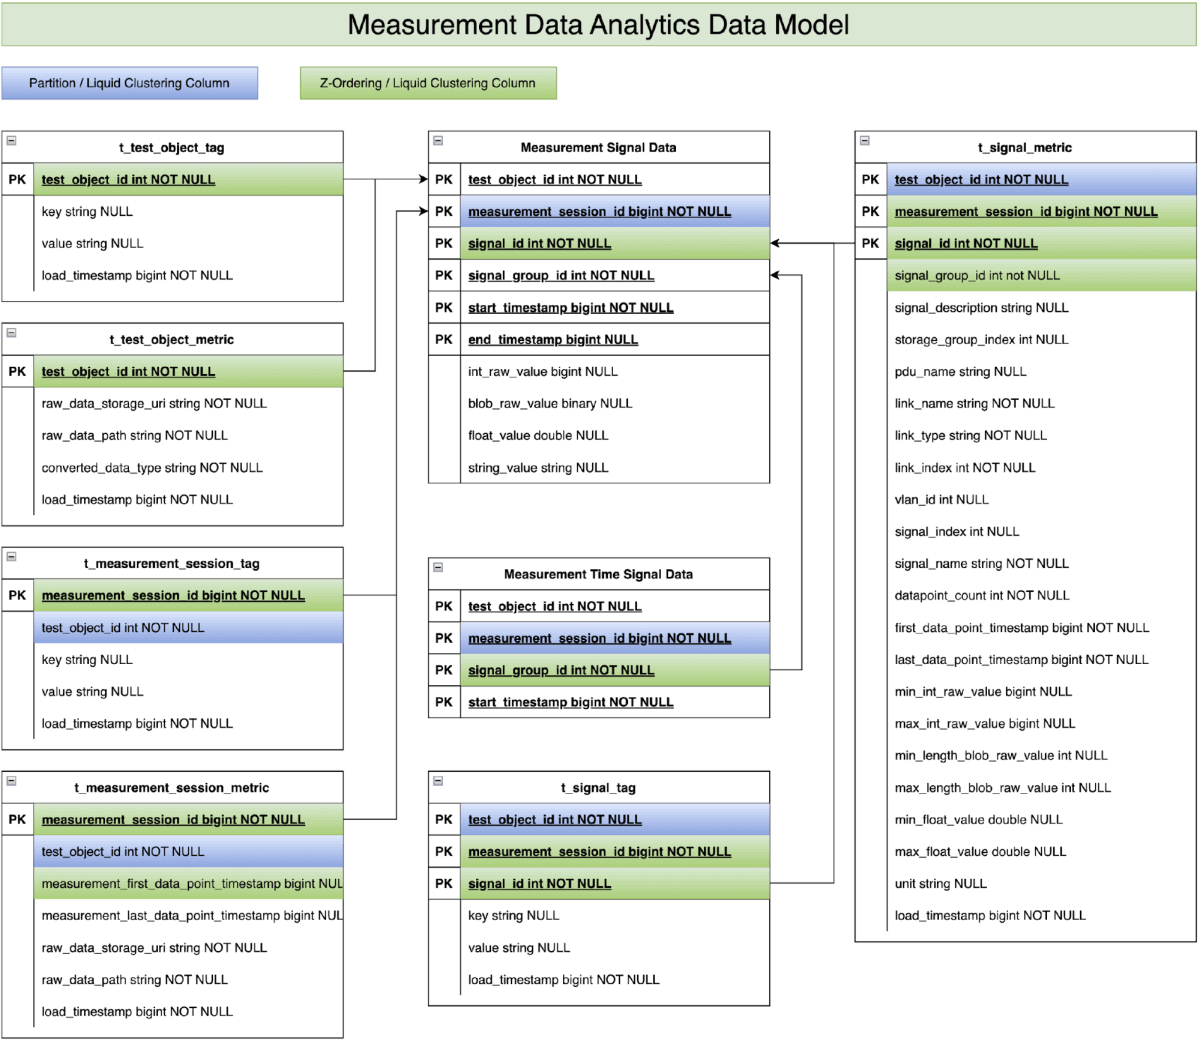
As a member of Association for Standardization of Automation and Measuring Systems (ASAM) community (status in August 2025), Mercedes-Benz has long utilized various technologies to analyze collected measurement data. Through our collaboration with Databricks, we recognized the immense potential of the before mentioned time series data model to support the Mercedes-Benz vehicle development. Consequently, we leveraged our vehicle development expertise to enhance the data model based on the ASAM MDF standard (see Figure 2). We contributed productive measurement data from development vehicles and adapted real data analytics use cases. This allowed us to validate the data model concept and demonstrate its feasibility in enhancing the vehicle development process and quality.
Our focus will now shift to demonstrating how this enhanced data model performs with Mercedes-Benz development vehicle measurement data:
- Level 1 filtering via “t_test_object_metric” & “t_test_object_tag”: These two tables store business information and statistics at test object level (e.g. test vehicle). Examples include vehicle type, vehicle series, model year, vehicle configuration etc. This information allows the data analytics use cases in the first step to focus on specific test objects among hundreds of test objects.
- Level 2 filtering via “t_measurement_session_metric” & “t_measurement_session_tag”: These two tables store the business information and statistics at the measurement session level. Examples include test events, time zone information and measurement start/end timestamps. The measurement start/end timestamps help the data analytics scripts in the second step to narrow down the interesting hundreds of measurement sessions from millions of measurement sessions.
- Level 3 filtering via “t_signal_metric” & “t_signal_tag”: These two tables store the business information and statistics at signal key level. Examples include vehicle speed, road type, weather condition, drive pilot signals etc. The data analytics scripts leverage the information in the final step to identify the relevant signals for the underlying query from thousands of available signals.
- Analytics scripts on measurement signal data tables: The actual analytics logic is executed on the measurement signal data tables, which store the time series data collected from test vehicles. However, after applying the three levels of data filtering mentioned above, typically only a small fraction of the original raw time series data needs to be processed and analyzed.
Mercedes-Benz Example Use Case for working with the metadata tables
By introducing different levels of metric and tag tables as core metadata, data analytics performance has significantly improved compared to existing solutions at Mercedes-Benz. To illustrate how the core metadata enhances analytics performance, we would like to use the Automatic Lane Change (ALC) system readiness detection as an example.
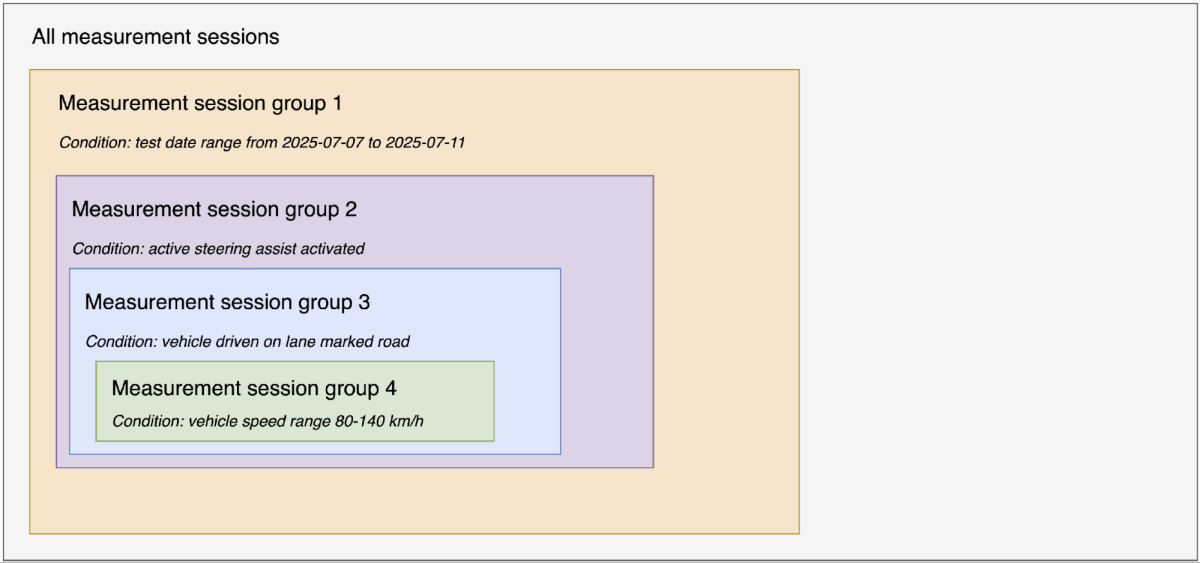
As highlighted in Mercedes-Benz innovation, the ALC function is an integral part of Active Distance Assist DISTRONIC with Active Steering Assist. If a slower vehicle is driving ahead, the vehicle can initiate a lane change itself in the speed range of 80-140 km/h and overtake completely automatically if lane markings are detected and sufficient clearance is available. The prerequisite is a road with a speed limit and the vehicle being equipped with MBUX Navigation. The sophisticated system requires no further impulse from the driver to execute the automatic lane change. These three preconditions help the analytics script filter the relevant sessions from thousands of sessions. For clarity, we present our methodology in a logical and sequential manner (see Figure 3); it is important to note that the actual implementation can be performed in parallel.
- Filter sessions during the test drive date range between 2025-07-07 and 2025-07-11 from all generated measurement sessions to create session group 1. In this step, we use the measurement_first_data_point_timestamp and measurement_end_data_point_timestamp columns in the “t_measurement_session_metric” table to identify the relevant sessions from all recorded sessions of the vehicle.
- Filter sessions within session group 1 that contain activated Active Steering Assist to create session group 2. In this step, we check the sessions where max_int_raw_value > 0 (assuming the signal integer raw value for activated Active Steering Assist is 1) in the “t_signal_metric” table to identify the relevant sessions from session group 1.
- Filter sessions within session group 2 where the vehicle is driven on a lane-marked road to create session group 3. In this step, we check the sessions where max_int_raw_value > 2 (assuming the signal integer raw value for lane-marked road type is 3) in the “t_signal_metric” table to identify the relevant sessions from session group 2.
- Filter sessions within session group 3 that contain vehicle speed in the range of 80-140 km/h to create session group 4. In this step, we check the sessions where max_float_value >= 80 OR min_float_value <= 140 in the “t_signal_metric” table to identify the relevant sessions from session group 3.
- Filter the necessary signal IDs within session group 4. In this step, we use the combination of pdu_name, link_name, vlan_id, and signal_name to find the signal IDs of relevant signals.
- Use the filtered signal IDs and measurement session IDs from session group 4 to join the measurement signal data point table and identify the ALC system readiness.
Selecting the optimal data layout through real-world data & use case benchmarking
To demonstrate the performance and scalability of the described data model, we systematically benchmarked real-world measurement data and use cases. In our benchmark study, we evaluated various combinations of data layouts and optimization techniques. The benchmarks were designed to optimize for:
- Data layout & optimization strategies: We tested different data layout approaches, such as partitioning schemes, RLE, non-RLE, Z-Ordering, and Liquid Clustering, to optimize the query performance.
- Scalability: We focused on solutions capable of handling the ever-growing volume of measurement data while maintaining efficiency.
- Cost-efficiency: We considered both storage costs and query performance to identify the most cost-effective approach for long-term data retention and analysis.
Since the benchmark results are crucial for selecting the future measurement data schema and format in Mercedes-Benz, we used productive data and analytics scripts to evaluate the different options.
In practice even minor optimizations can unlock major savings at scale, enabling thousands of engineers to extract insights safely and cost-efficiently. Benchmarking is key to validate efficiency of a suggested solution and should be steadily repeated with larger changes to the system.
Benchmark Setup
The benchmark dataset contains measurement data from 21 distinct test vehicles, each equipped with modern car loggers to collect the measurement data. The collection features between 30,000 to 60,000 recorded signals per vehicle, which offer a wide range of data points for analysis. In total, the dataset represents 40,000 hours of recordings, with 12,500 hours specifically capturing data while the vehicles were live (ignition on). This dataset enables the study of various aspects of automotive behavior and performance across different vehicles and operating conditions.
The following four analytical query categories were executed as part of the benchmark:
- Signal Distribution Analysis - We generated one-dimensional histograms for key signals (e.g. Vehicle Speed) to assess data distribution and frequency patterns.
- Signal Arithmetic Operations - We performed basic calculations (e.g. subtraction, ratios) on several to thousands of signals.
- Test Case Identification – The queries identify and validate predefined operational scenarios within the dataset, defined by a sequence of events occurring in a given order.
- Detection of Readiness of Automated Lane Change Assistant System - This query extensively utilizes the metadata tables before the actual underlying time series data is queried.
Please note that in this blog post, we only present the results for category 1 and 4, as the results for the other categories yield comparable performance results and do not provide additional insights.
To benchmark the scalability of the solution, we used four different cluster sizes. The memory optimized Standard_E8d_v4 node type was selected because of its delta cache feature and larger memory to hold the core metadata. As for the Databricks runtime, the 15.4 LTS was the latest available long-term support runtime. In our earlier investigation, the Photon feature has proven to be more cost-efficient, despite its higher DBU cost, so Photon was utilized in all benchmarks. Table 1 provides details of the selected Databricks cluster.
| T-Shirt Size | Node Type | DBR | #Nodes (driver + worker) | Photon |
|---|---|---|---|---|
| X-Small | Standard_E8d_v4 | 15.4 LTS | 1 + 2 | yes |
| Small | Standard_E8d_v4 | 15.4 LTS | 1 + 4 | yes |
| Medium | Standard_E8d_v4 | 15.4 LTS | 1 + 8 | yes |
| Large | Standard_E8d_v4 | 15.4 LTS | 1 + 16 | yes |
Table 1 The benchmark cluster setups
Benchmark Results
The benchmark was executed on two main versions of the data model. The first version has run length encoded (RLE) samples data (see section Core Data Model), while the second version does not use RLE. Furthermore, we applied two different data layout optimizations to both versions of the data model. In the first optimization we used hive-style partitioning to partition the measurement signal data table by the measurement_session_id column and applied the Z-Ordering technique on the signal_id column. In the second optimization, we used Liquid Clustering to cluster the measurement signal data table by measurement_session_id and signal_id.
Runtime Performance
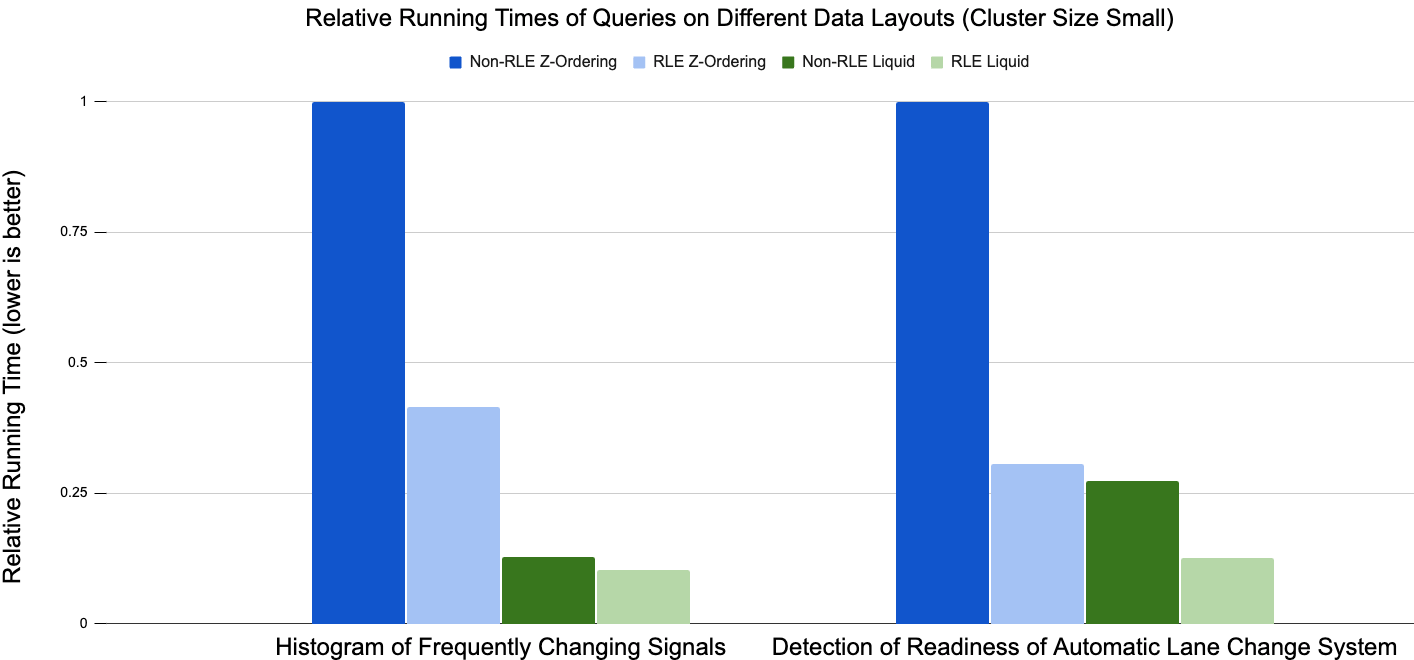
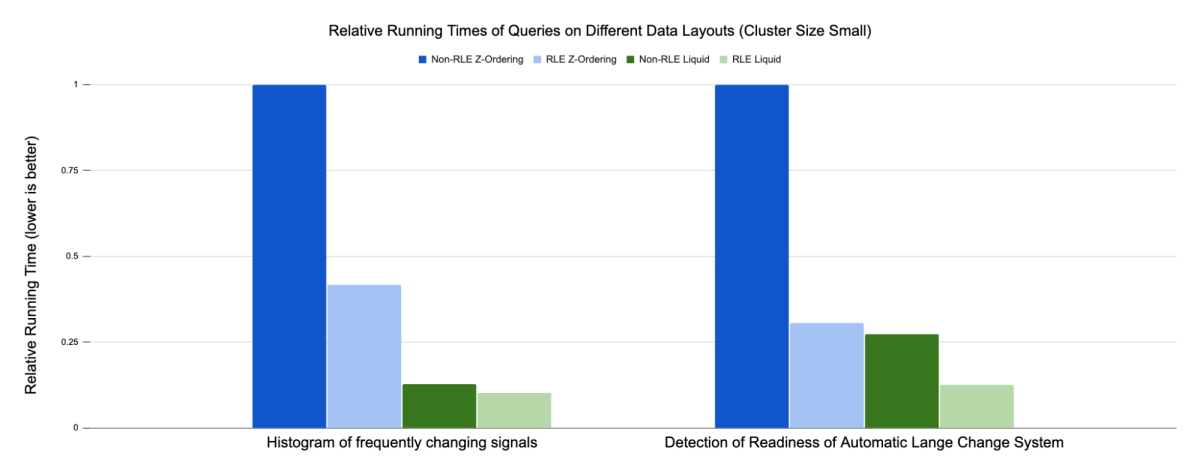
Due to the significant differences in absolute running times among the benchmarked setups, we decided to use relative running time based on Z-Ordering with non-RLE results to visualize the outcomes. Generally, across all tests we performed, Liquid Clustering (green bars) outperforms hive-style partitioning +Z-Ordering (blue bars). For the histogram of frequently changing signals, the RLE optimization reduces the runtime by approximately 60% for Z-Ordering, while it only reduces the runtime by less than 10% for Liquid Clustering.
In the second use case, detection of readiness of automatic lane change system, RLE reduced the runtime by nearly 70% for Z-Ordering and more than 50% for Liquid Clustering. The overall results of the demonstrated use cases indicate that the combination of RLE and Liquid Clustering performs the best on data model.
Scalability
To evaluate the scalability of the solution, we executed all four analytical queries on a static dataset using different cluster sizes. In fact, in every benchmarking run, we doubled the cluster size compared to the previous run. Ideally, for a solution that scales perfectly, the runtime of a query should decrease by a factor of 2 with each doubling of the cluster size. However, the technical limitations often prevent perfect scaling.
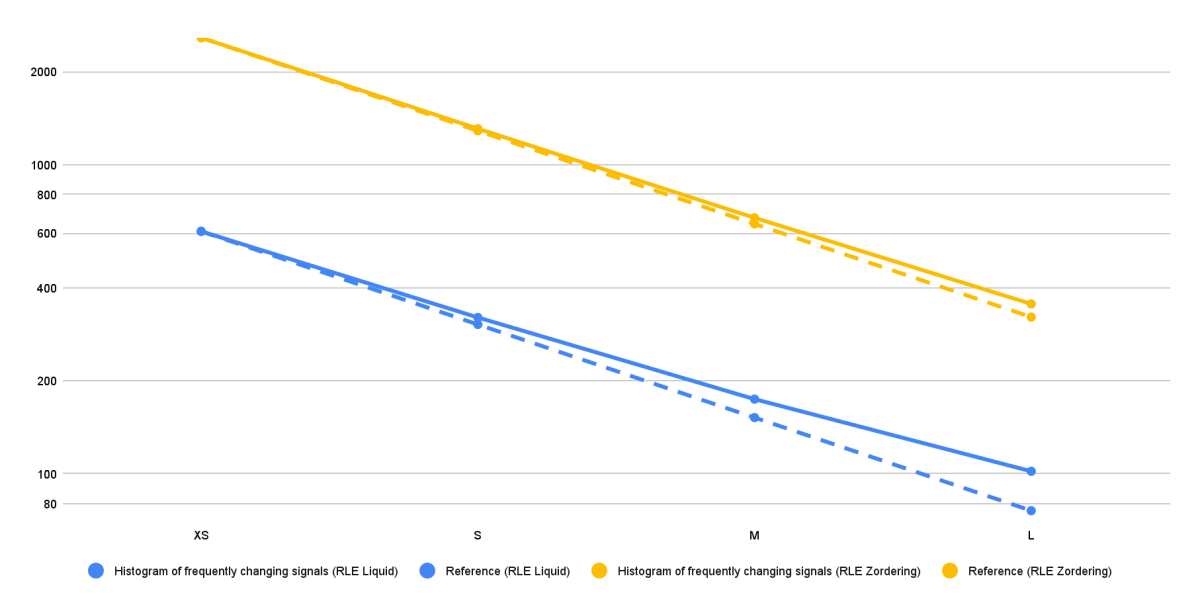
Figure 5 shows the results in absolute running times (seconds) for various benchmark setups for one use case, though we observed the exact same pattern across all other use cases. The reference lines (yellow and blue dashed lines) represent the lower bound of running times (perfect scaling) for the two different benchmark setups. For the shown use case the running time generally decreases almost perfectly as the cluster size increases from X-Small to Large. This indicates that the data model and optimization strategies are scalable, benefiting from additional nodes and processing power.
Nevertheless, we can see that the running times of the RLE Liquid Clustering solution (blue line) start to drift away from the perfect scaling reference line beginning with the Medium cluster size. This gap becomes even more pronounced with the Large cluster size. However, it's important to note that the absolute running times for the RLE Liquid Clustering solution are significantly lower than those for RLE Z-Ordering. Therefore, it is anticipated that the RLE Liquid Clustering solution would exhibit diminished scalability improvements at larger cluster sizes, as its baseline running time is already exceptionally low at that stage.
Storage Size
Our benchmark data were generated from 64.55TB of proprietary MDF files, collected from 21 Mercedes-Benz MB.OS test vehicles over a five-month test period. To maximize the query performance while maintaining an acceptable storage size, we use the zstd compression for Parquet file and set the DELTA target file size as 32MB, based on results of previous investigations. Small file sizes are desirable in this scenario to prevent storing too many signals in the same physical file, making dynamic file pruning more efficient for highly selective queries.
All data layouts resulted in Delta tables comparable in size to the proprietary MDF data (please see Table 2). In general, the compression rate from raw file format to the Delta tables depends a lot on different characteristics of the MF4 files. The underlying dataset contains up to 60.000 signals per vehicle and a lot of them were recorded on value change only. For those signals compression techniques like RLE have no effect. For other datasets with only thousands, but continuously recorded signals, we found that the storage size was reduced by >50% compared to the raw MDF files.
Our results showed that the Liquid Clustering tables were significantly larger in size when compared to the Z-Ordered tables (+14% for the RLE data layouts). However, considering the running time performance benchmark results presented above, the additional storage size required by RLE Liquid Clustering layout is justified by its superior performance.
| Formats | Proprietary MDF File | RLE Z-Ordering | RLE Liquid Clustering |
|---|---|---|---|
| Storage size [TB] | 64.55 | 67.43 | 77.05 |
Table 2 Storage sizes of raw data and of the different RLE data layouts
Conclusion
We developed a hierarchical semantic data model to efficiently store and analyze petabyte-scale time series data from connected vehicles on the Databricks Intelligence Platform. Designed for cost-efficient, scalable access, usability, and strong governance, the model opens up turning raw telemetry into actionable insights.
Using real-world Mercedes-Benz data, we showed how hierarchical metadata tables improve analytics performance via multi-level filtering. In the Automatic Lane Change Readiness example, this structure enabled rapid identification of relevant sessions and signals, drastically reducing processing time.
Benchmarking revealed that combining Run-Length Encoding (RLE) with Liquid Clustering delivered the best performance across analytical query types, outperforming RLE with Z-Ordering, especially in runtime. While it required more storage, the trade-off was justified by significant query speed gains. Scalability tests confirmed strong performance even as data volumes grew.
In the future, the Databricks team will publish solutions on 1) how to convert MDF files into the newly introduced data model with Databricks Jobs, 2) cover how to govern complex data sets containing large fleets or other assets and allow for easy discovery while maintaining privacy, security and growing complexities with Unity Catalog and 3) introduce a framework for engineers without a strong SQL or python background to efficiently gain insights from data by themselves.
In summary the hierarchical semantic data model with RLE and Liquid Clustering offers a powerful, governed, and scalable solution for automotive time series analytics, accelerating development at Mercedes-Benz and fostering data-driven collaboration toward a more sustainable, efficient future.
Get the latest posts in your inbox
Subscribe to our blog and get the latest posts delivered to your inbox.