Track health and fitness goals with Apple Healthkit and Databricks
Health insights with Big Data
Data is a powerful tool that can be used to improve many aspects of our lives, including our health. With the proliferation of wearable fitness trackers, health apps, and other monitoring devices, it has become easier than ever to collect and analyze data about our health. By tracking and analyzing this data, we can gain valuable insights into our health and wellness, enabling us to make more informed decisions about our lifestyles and habits.
Health devices, which enable you to track all your health metrics in one place, make it easy to monitor your progress and make informed decisions about your health. This blog shows how you can use your device and its data to provide even more actionable insights. The example I'll walk through uses Apple Healthkit to perform advanced analytics and machine learning, and build a dashboard with relevant KPIs and metrics. The goal is help track my weekly and monthly performance across these metrics so I can monitor and achieve my health goals. Inspired by the blog post "You Are What You Measure," my intent is to measure my way to good health! You can join in the fun too (Github repo here).
The Foundation of Our Data-driven Fitness Journey
With the explosion of data volumes at our fingertips and the myriad of tools to acquire, transform analyze and visualize – it is easy to be overwhelmed. The lakehouse architecture simplifies data use cases by providing all of the necessary capabilities available under one platform. In addition to unifying workflows and data teams, the Databricks Lakehouse Platform – powered by Delta Lake –makes data warehouse-level features (like ACID transactions, governance, and performance) available on data lake scale, flexibility, and cost.
To power our dashboard and analytics, we'll be leveraging Apple HealthKit, which in addition to great tracking, provides data sharing capabilities from third-party apps in the iOS ecosystem. But to take it a step further, we'll also be using full extent of the lakehouse! It uses a combination of Apache Spark, Databricks SQL, and MLflow to extract further insights, aggregations, and KPI tracking to keep me honest throughout 2023. We'll walk through how to utilize Delta Live Tables to orchestrate streaming ETL process, use a metadata driven ETL framework for data transformation, and expose a dashboard with relevant KPIs to make data-driven actions!
In the subsequent sections of this blogpost, we'll show how to:
- Export your health data
- Utilize Delta Live Tables to orchestrate streaming ETL
- Use a metadata-driven ETL framework to classify and perform transformations of our data
- Expose a dashboard with relevant KPIs
- Make data-driven actions!
Preparation
The first step is to make the data available. There are several options to export Apple Healthkit data, including building your own integration with the accompanying APIs or third-party apps. The approach we'll take is documented on the official HealthKit website by exporting directly from the app. Follow these simple instructions below to export your data:
- Ensure you have relevant data in Health Application (such as steps and heartrate)
- Export health data and upload to your cloud storage of choice (I use Google Drive)
- Verify that export.zip file is available in Google Drive
High-Level Architecture
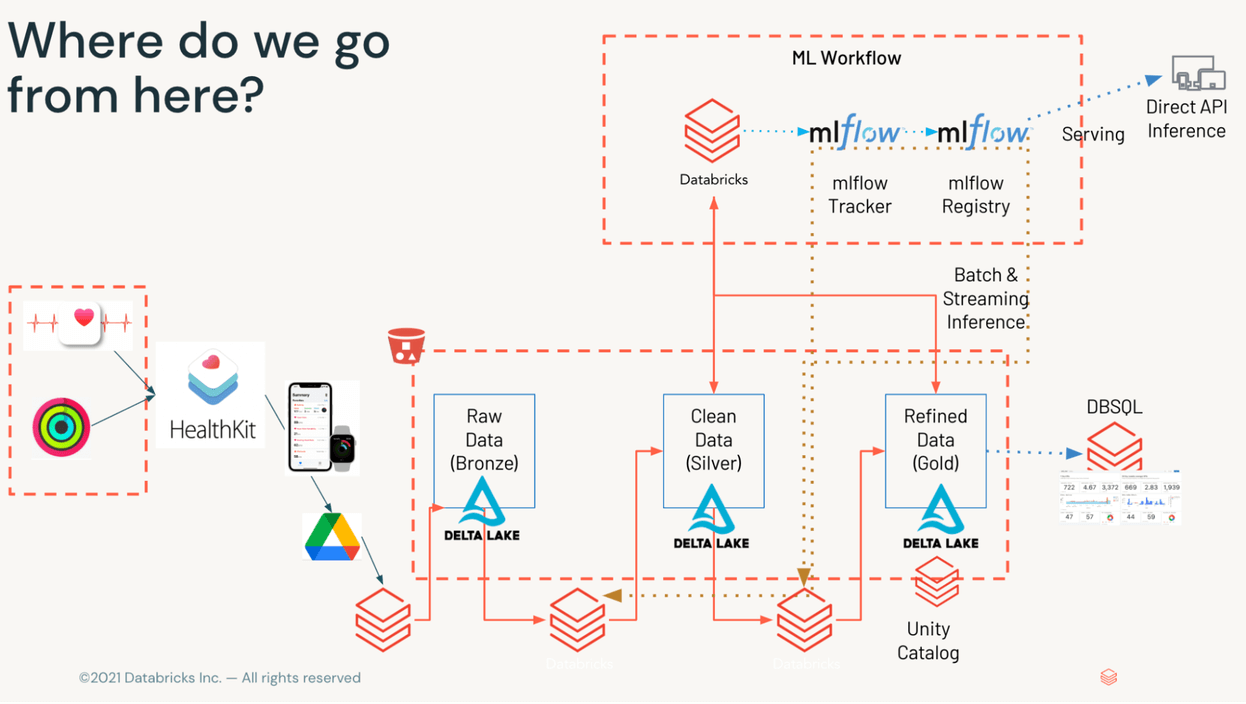
As shown in Figure 1, our data will make several stops along the way to visualization. Once data is available on object storage, we'll process it through the Medallion framework – taking raw XML (bronze), breaking out disparate datasets (silver), and aggregating relevant KPIs on minute, hourly, and daily basis to present to the serving tier (gold).
Data Verification and Sharing
To ensure data is available, log into your target Google Drive account (or wherever your export was uploaded to) and find the filename export.zip. Once located, please ensure file permissions reflect "anyone with the link," and copy the link for later use.
Data Acquisition and Preparation
Now that our data is available, it's time to set up our notebook for data access, governance, and ingestion into Databricks. The first step is to install and import necessary libraries and setup variables we'll be reusing to automate extractions and transformations in later steps.
For data acquisition, we'll be using gDown, a neat little library that makes downloading files from Google Drive simple and efficient. At this point, all you have to do is copy your shared link from Google Drive, a destination folder, and expand .zip archive to the /tmp directory.
When exploring the contents of export.zip, there are several interesting datasets available. These data include workout routes (in .gpx format), electrocardiograms (in .csv), and HealthKit records (in .xml). For our purposes we are concentrating on export.xml, which tracks most of our health metrics in Apple HealthKit. Please note, if export.xml contains millions of records (like mine does), you may need to increase the size of the Apache Spark driver for processing. Please refer to GitHub for reference.
Before proceeding, we'll do a quick review of the dataframe using Bamboolib, which provides a lowcode/no-code approach to exploring the data and applying transformations, changing datatypes, or performing aggregations with minimal code. This will give us great insights into our data and alert us to any possible data quality concerns. Check out EDA notebook
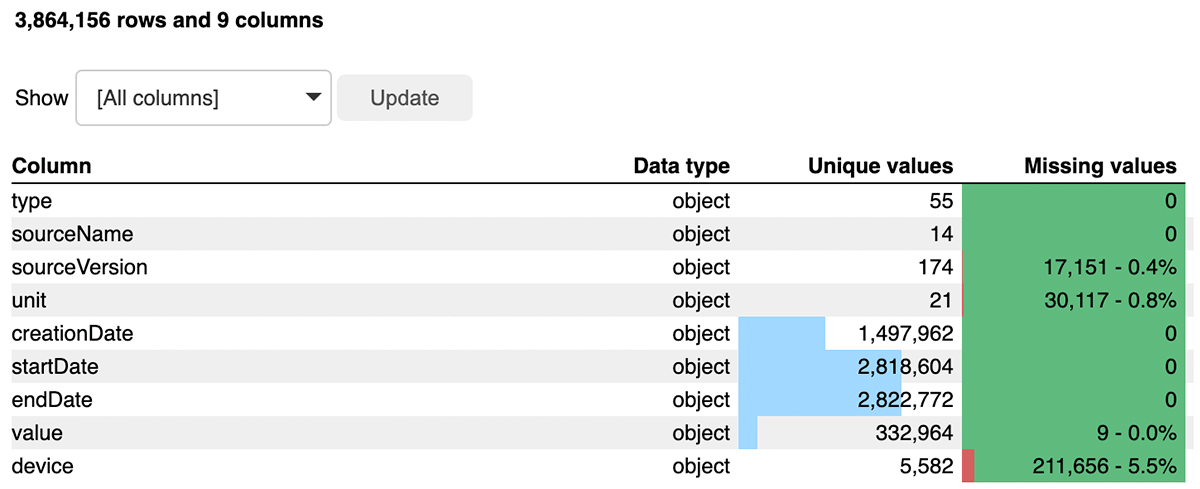
As seen in Figure 3, the export.xml consists of more than 3.8M records across 55 types of data. Through this exploration, we see this is a relatively clean dataset, with minimal null values in the value column, which is important because it stores metrics based on the column type. The type column consists of different available metrics – from sleep tracking to heartbeats per minute.
Now that we understand the data shape and relationships, we can move on to the fun stuff!
Go for the GOLD – Medallion framework!
Upon further inspection, the xml - is not so simple after all. As provided by our Bamboolib analysis, although contained in a single XML, it is actually 55 different metrics that are tracked. Enter Lakehouse! We will apply the ETL Medallion framework on the lakehouse to curate our data lake and process our data for downstream consumption by data science and BI teams – all on cheap object storage!
Processing and landing this data into the Delta format allows us to keep raw data and start reaping the benefits.
As part of the ELT process, we'll be taking advantage of Delta Live Tables (DLT) to automate and simplify our data processing. DLT provides the advantage of a declarative framework to automate functions, which would be otherwise manually developed by engineering teams, including streaming pipeline tasks such as checkpointing and auto-scaling with enhanced autoscaling, data validation tasks with expectations, and pipeline observability metrics.
Data Exploration and Manipulation
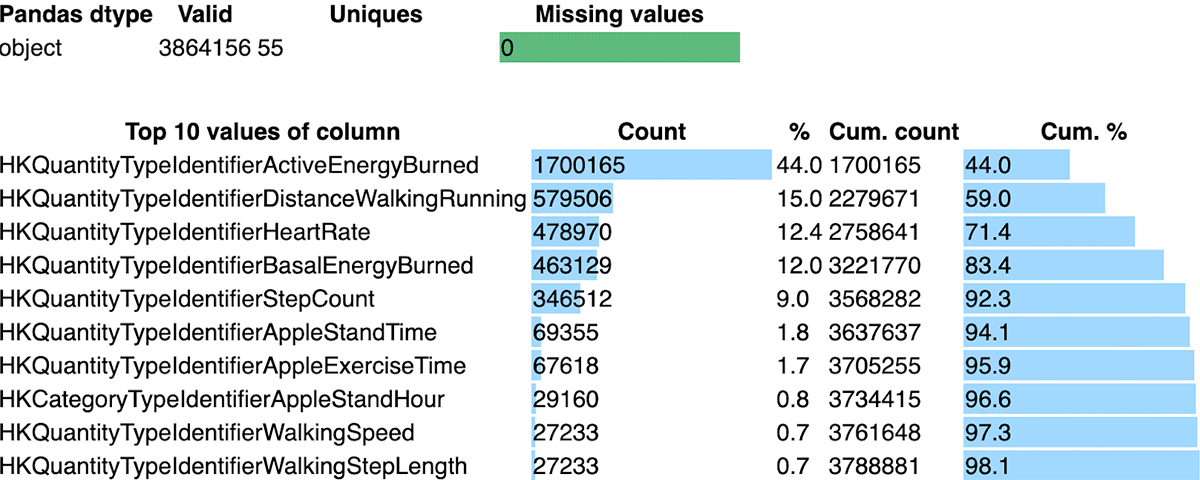
We'll base our subsequent analysis on the 'type' column, which defines the data in the payload. For example, HeartRate type will have different metrics tracked when compared to ActiveEnergyBurned type. As seen below - our xml file actually contains 55+ metrics (at least in my case – YMMV) tracked by Apple healthKit.
Each of these sources represents an unique metric being tracked by Apple HealthKit - regarding different aspects of overall health. For example, it will pull metrics from environmental decibel levels and lat/lon of workouts, to heart rate and calories burned. In addition to unique measurements, they provide different timescales - from per workout, per day, to per second measurements – a rich dataset indeed!
Clean up!
We want to ensure we track any data quality concerns throughout the pipeline. From our earlier investigation, it seemed that some values might have been measured incorrectly - which might skew our data (heart rate above 200??). Luckily, DLT makes data quality issues manageable using expectations and pipeline metrics. A DLT expectation is a specific condition you expect of the event (for example IS NOT NULL OR x>5), which DLT will take an action on. These actions could be just for tracking purposes ("dlt.expect") or could include dropping the event ('dlt.expect_or_drop') or failing the table/pipeline ('dlt.expect_or_fail'). For more information on DLT and Expectations, please refer to the following page (link).
Metadata FTW!
As mentioned above, each type will provide unique insights into your overall health. With over 55 different types and metrics, it can be a daunting task to manage. Especially when new metrics and our data sources pop into the pipeline. For this reason, we'll leverage a metadata-driven framework to simplify and modularize our pipeline.
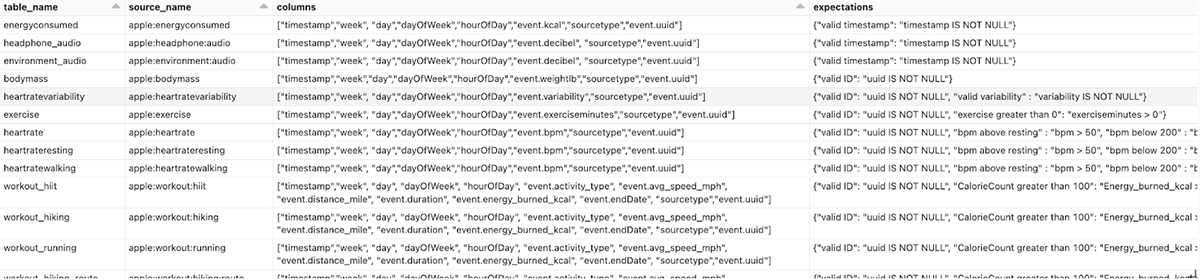
For our next step, we deliver over 10 unique sources to individual silver tables with specific columns and necessary transformations to make the data ML and BI-ready. We use the metadata-driven framework, which simplifies and speeds up development across different data sources, to select specific values from our bronze table and transform into individual silver tables. These transforms will be based on the type column in our bronze table. In this example, we'll be extracting a subset of data sources, but the metadata table is easily extended to include additional metrics/tables as new data sources arise. The metadata table is represented below and contains columns that drive our DLT framework, including source_name, table_name, columns, expectations, and comments.
We incorporate our metadata table into our DLT pipeline by leveraging looping capabilities available in the python API. Mixing capabilities between SQL and Python makes DLT an extremely powerful framework for development and transformation. We'll read in the Delta table (but could be anything Spark can read into a dataframe; see example metadata.json in repo) and loop thru to extract metadata variables for our silver tables using the table_iterator function.
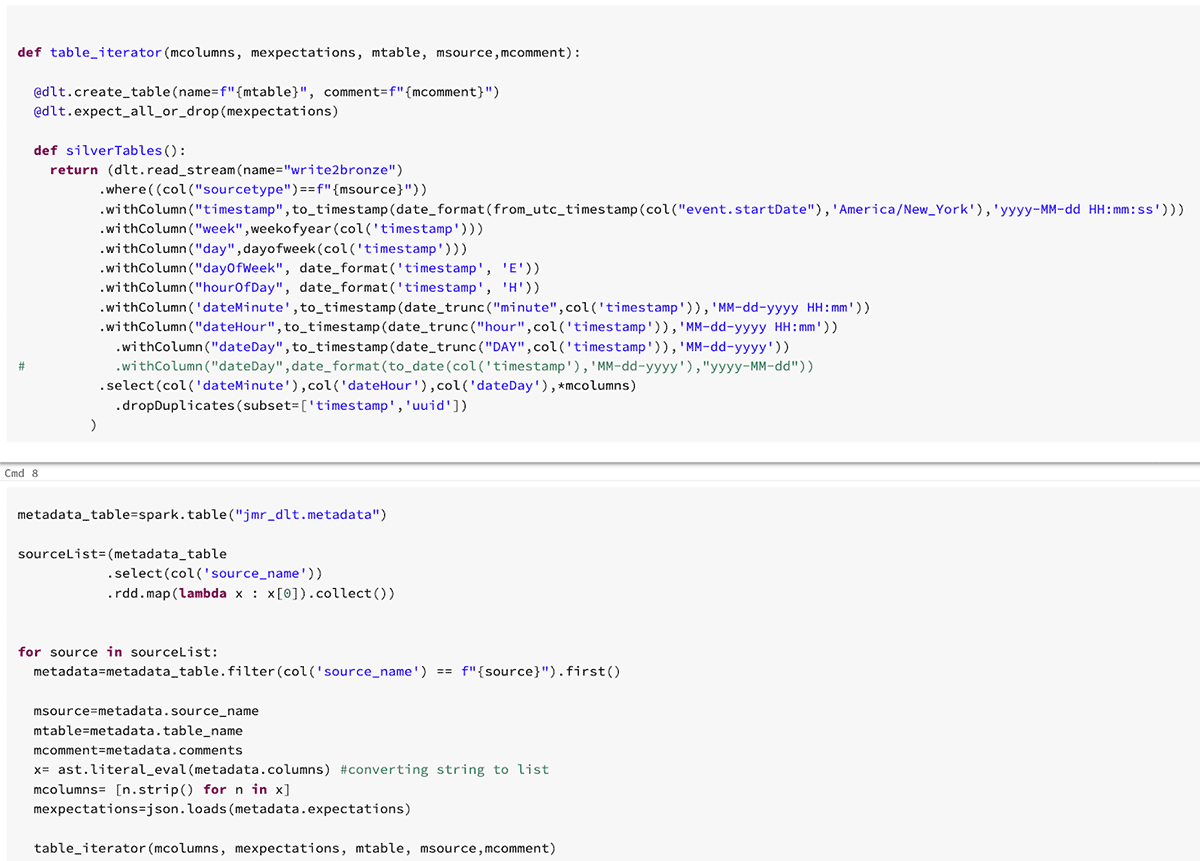
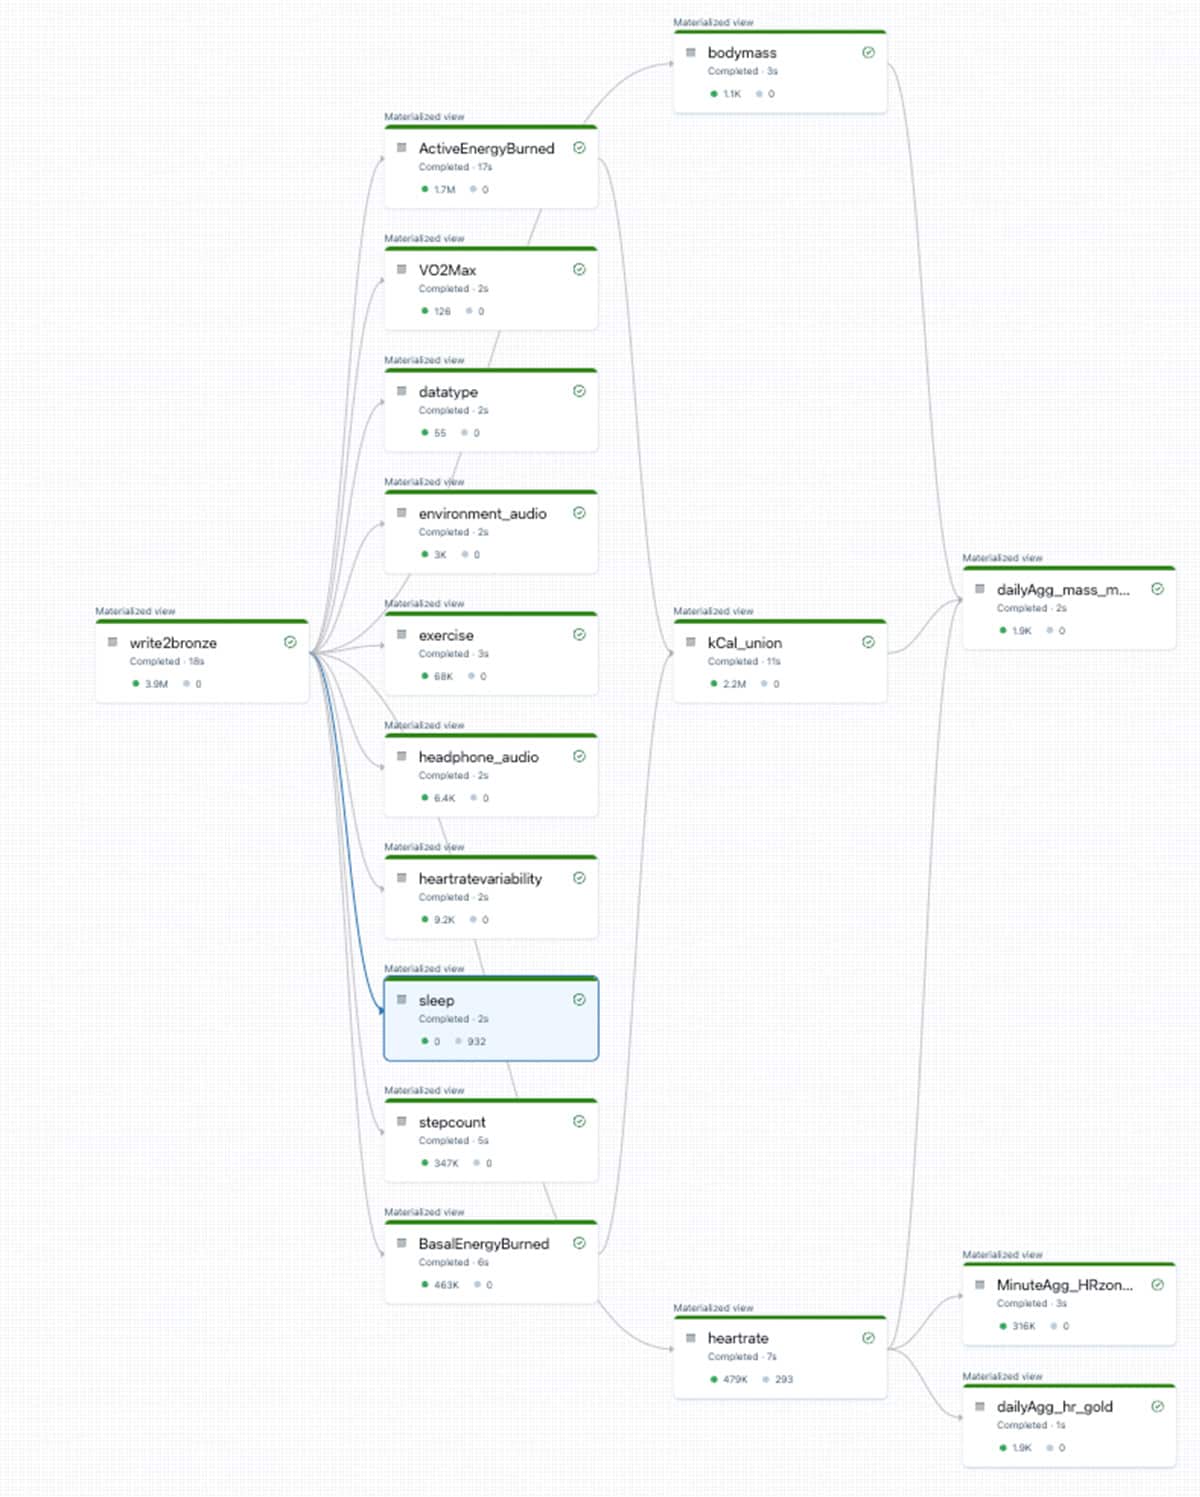
This simple snippet of code, accompanied by a metadata table, will read in data from bronze, and provide extractions and unique columns to over 10 downstream silver tables. This process is further defined in the "DLT_bronze2silver" notebook which contains data ingestion (autoloader) and metadata-driven transformations for silver tables. Below is an example of the DLT DAG created based on the different sources available in Apple HealthKit.
And clean datasets!
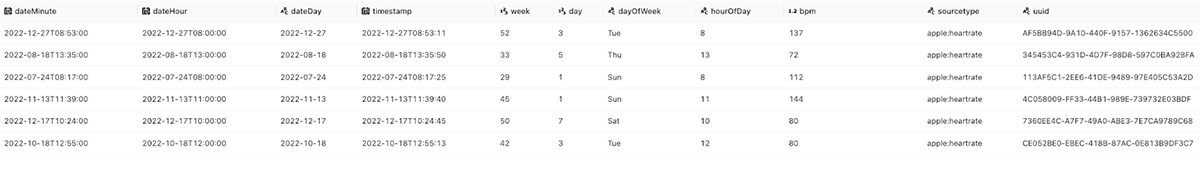
Finally, we combine several interesting datasets – in this case, heart rate and workout information. We then create ancillary metrics (like HeartRate Zones) and perform by-minute and day aggregations to make downstream analytics more performant and appropriate for consumption. This is further defined in the 'DLT_AppleHealth_iterator_Gold' notebook in the repo.
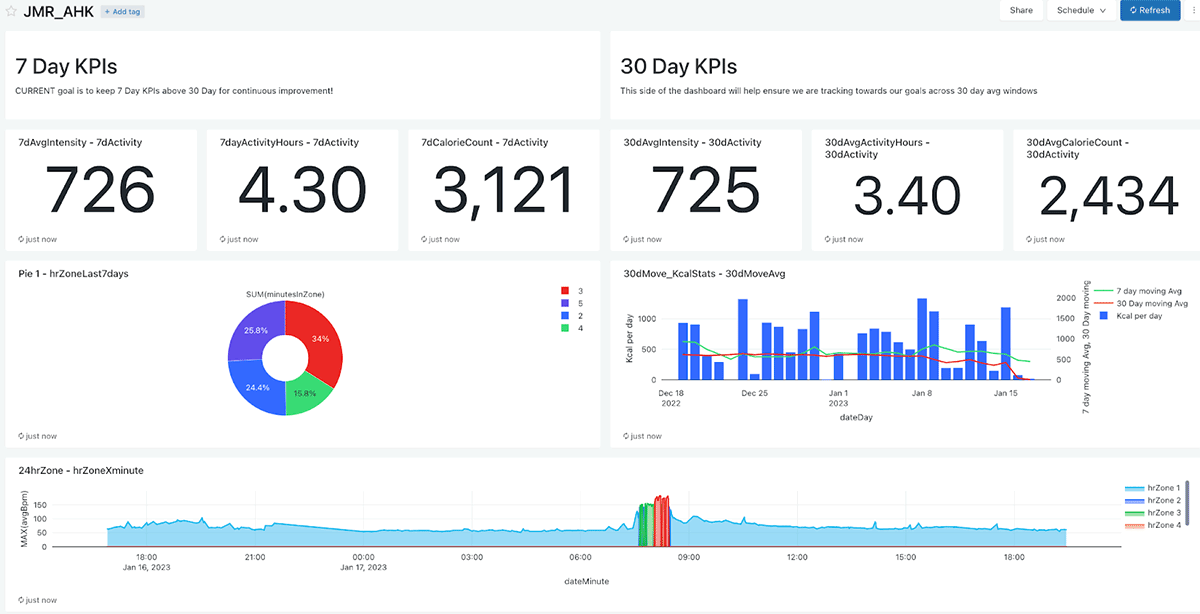
With our data available and cleaned up, we are able to build out some dashboards to help us track and visualize our journey. In this case, I built a simple dashboard using capabilities included in Databricks SQL to track KPIs that will help me achieve my goals, including workout time, heart rate variability, workout efforts, overall averages, and short and long-term trends. Of course, if you are more proficient in other data visualization tools (like Power BI or Tableau), Databricks can be fully integrated into your existing workflow.
Below is a simple dashboard with relevant metrics, split by 7 day and 30 day averages. I like getting a view across KPIs and time all in a single dashboard. This will help guide my activity program to ensure I continuously improve!
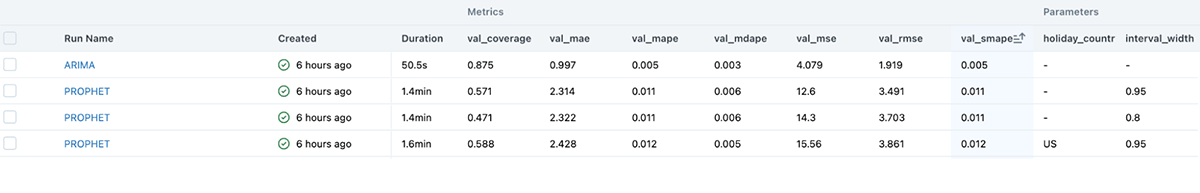
With such a rich dataset, you can also start delving into ML and analyze all measures of health. Since I'm not a data scientist, I leveraged the built-in capability of autoML to forecast my weight loss based on some gold and silver tables! AutoML provides an easy and intuitive way to train models, automate hyperparameters tuning, and integrate with MLflow for experiment tracking and Serving of model!
Summary
Hopefully this experiment provided a consumable introduction to Databricks and some of the great feature functionality available on the platform.
Now it's your turn to leverage the power of data to change behavior in a positive way! Get started with your own experiment.
Get the latest posts in your inbox
Subscribe to our blog and get the latest posts delivered to your inbox.