Using Delta Sharing to Accelerate Insights with Nasdaq’s Digital Assets Market Data
by Mitch Tessier, Josh Seidel, Sri Ghattamaneni, Vionna Lo and Joe Widen

This is a collaborative post from Databricks and Nasdaq. We thank Mitch Tessier, Product Marketing Manager at Nasdaq, for his contributions.
Data exploration is the process of investigating a new data set by asking basic questions in order to gain insights for further analysis. Delivering seamless access to vast digital asset data (blockchain networks, crypto markets, and decentralized finance) is essential to support trading and risk strategies. With the Databricks Lakehouse for Financial Services and Nasdaq Data Link's Digital Assets Market Data, financial institutions can:
- Access data sets for crypto trades, quotes and order books
- Reduce ETL of large datasets from months to minutes
- Analyze and explore the different pairs across global markets
- Prepare digital asset data for analytics and AI at scale
Nasdaq Data Link Digital Assets is a part of Nasdaq's Investment Intelligence suite of products, designed to provide significant value to customers in making informed decisions. As the creator of the world's first electronic stock market, Nasdaq technology powers more than 70 marketplaces in 50 countries, and one in ten of the world's securities transactions. Built in partnership with Amberdata, the Digital Assets Market Data from Nasdaq is a suite of data products covering trades, top-of-book and depth-of-book data for 2,000+ cryptocurrency pairs across 15 exchanges.
Large Data Sets And Delta Sharing
As enterprises look to find new sources of revenue and better manage risk within the organization, data sharing has become a proven avenue to monetize data and collaborate with external data providers for better risk governance strategies. While there are data platforms that provide the ability to share data, oftentimes there are several shortcomings such as vendor lock-in and high cost of data transfer, among others.
To solve these problems, Databricks developed Delta Sharing which is an open-source protocol that enables easy access and processing of shared data securely from your lakehouse to any computing platform. Data is not duplicated, but managed by the Delta Sharing Server, which generates short-lived URLs for access. These URLs allow various vendor-agnostic Delta Sharing clients, such as Spark, Pandas, PowerBI, and Tableau, to directly read and process the data. Delta Sharing allows for the efficient sharing and processing of data sets of all sizes, and is a fundamental requirement for working with large data sets such as the Digital Assets Market Data.
Data Exploration
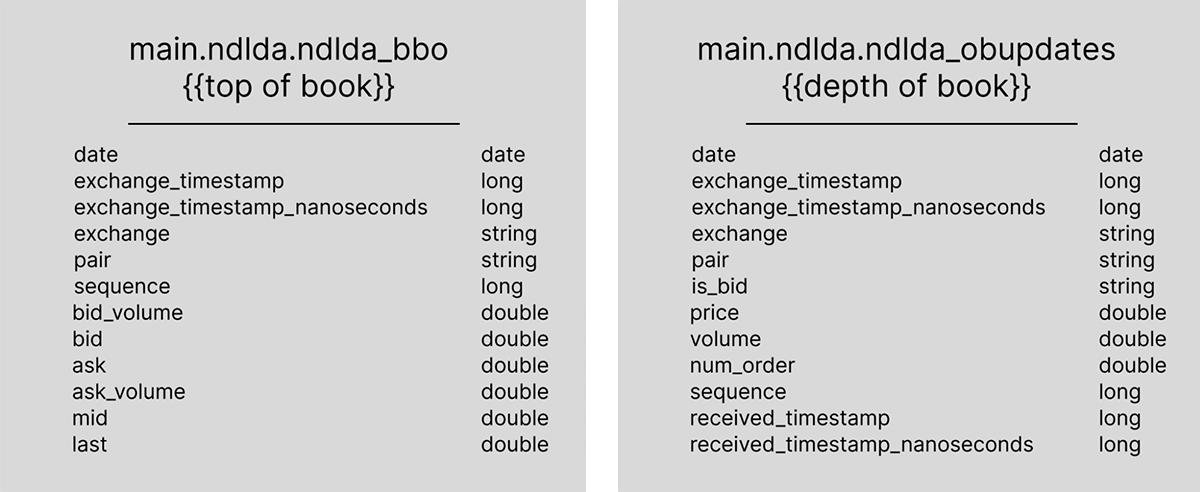
Today, we're analyzing two of the available tables in Nasdaq's Digital Assets Market Data suite: Top of book (BBO) & Depth of Book (OB updates), which are 3 terabytes and 30+ terabytes respectively. Before diving into this much data, it's important to have a basic understanding of its structure and schema. This will reveal that the data follows the standard fields for trade and quote (TAQ) data.
Data Transformations and Cleaning
After quickly reviewing the table columns, basic data exploration can begin. One efficient way to explore the data within the Databricks environment is by using a notebook. Within the two datasets, the most important columns for segmenting and grouping data are the "pair," "exchange," and "exchange_timestamp" columns. These columns allow for examination of the cryptocurrency pair, the exchange on which the quote or trade is listed, and the timestamp of the exchange the TAQ data was marked.
It is important to note that the timestamp column should be transformed to be human-readable, as it is a long value in UNIX time. Using Spark, it is easy to convert the column and add new columns to make the data more readable, as well as break out different columns by date, hours, minutes, and seconds. This allows for more detailed data exploration, comparison, and creation of summary statistics and views.
Basic summary statistics and graphs, such as looking at the buy vs. sell-side quantities, can yield insight into initial quantities and amounts of buy-side trades completed and the market participants. Graphs can also be built to visually explore the data and further plots can be used to show different views into the data, even showing histograms per crypto-pair and the market participants across prices and sizes of trades. Additionally, opening trade data and identifying the first set of trades after the date change for the exchange timestamp can yield a view into the way a pair trades after the opening.
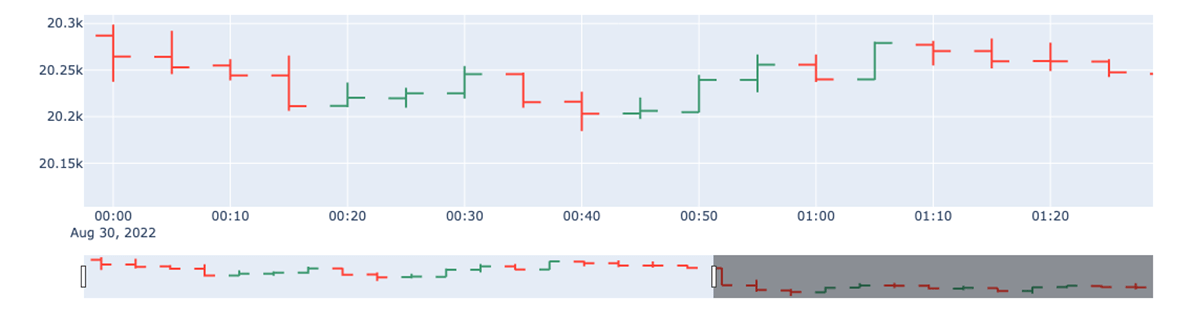
Creating a blurred, minute bar Open, High, Low, Close (OHLC) view into the trades starts to yield a timed-based view into price movements. The data can then be landed in Plotly for direct visual inspection of how the price moves during the trading day. There are also tools such as mplfinance that can be used to give Yahoo! Finance styled plots.
Market Depth Analysis
To truly understand how a cryptocurrency instrument trades, it's important to consider not just the trades themselves, but also the liquidity and timing of those trades. The Depth notebooks provide a way to visualize the timings of when the most quotes are made, giving insight into the peak times of day when there is the most potential for trades. By drilling down into specific dates or times, it's possible to see specific information about price and quantity, and how the instrument is trading overall. Using tools like Pandas, this information can be quickly and easily visualized.
Market Fundamentals, Moving Averages
When working with time-series data, it's important to cleanse and format the data; timestamps need various functions and operations to be properly utilized. This often involves converting strings of data into more usable fields, such as specific dates, time-zones, or hours. Once the data is prepared, it's possible to calculate simple patterns and trends, such as using candlestick patterns and moving averages for price movements, "blurring" the discreet trades in the market, and taking a more holistic view of price and depth. This technique of looking at the discrete individual trades and combining the trades into "bars or bands" and other technical Indicators allows for additional trends to be identified using numerical analysis.
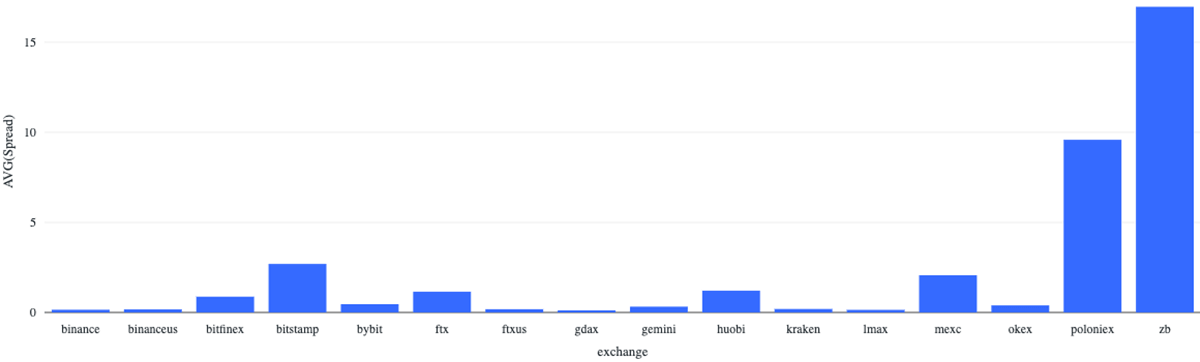
Additionally, it's valuable to look at the spread percentage when analyzing cryptocurrency trading. The spread percentage can give insight into the supply and demand of a particular pair and the cost of entering and exiting a position in the market. By visualizing the spread percentage across different exchanges using tools like Pandas, it's possible to understand how the values vary across the exchanges.
Spread Analysis
Upon creating a new Databricks notebook, the initial step is to retrieve the best bid and best offer quotes at the top of the book for each exchange. By analyzing these quotes, we can determine the best bid/offer for each crypto pair, including the price, size, and exchange. Additionally, we can look for arbitrage opportunities by identifying crossed markets - instances where an exchange has a bid greater than an ask.
To analyze the data, it's necessary to examine the ndlda_bbo table for best bid and offer quotes and the ndlda_trades table for historical crypto trades. By exploring the data, we can gain insight into the size and shape of the data set. For instance, by examining the table schemas, we can determine the number of exchanges present in the data set, in this case, 18. This gives us an idea of the number of markets available to trade crypto-pairs. To further understand the scope and size of the data set, we can count the number of distinct crypto-pairs, 8132, and use this information to estimate the data augmentation needed to build a comprehensive view of the crypto-pair markets. This will help us to understand the overall size and structure of the markets.
We can scan the individual rows and search for instances where the bid price is greater than the ask price. This will give us a number of quotes that can be used to validate and test the data quality, and also help to uncover and identify any issues with the data that may affect the overall results.
Next, we will create a column that lists the best bid and best ask prices for all the exchanges, and then, for each crypto pair, we will identify the exchange with the highest bid price and the lowest ask price across the market system. This will help us to identify crossed markets, providing insight into the market system and potential opportunities for price improvement.
Finally, we will calculate summary statistics such as the number of exchanges with crossed quotes, as well as the mean and standard deviation of the spreads between the best bid and ask prices for each crypto pair. This will give us a comprehensive view of the data and help to understand the market mechanisms for price improvement.
Conclusion
Databricks and the components that make the platform allow for easy and simple data exploration for massive data sets with Spark, Delta Lake and Delta Sharing. Databricks notebooks allow for the exploration of ideas in a simple way with visualizations not only with the native tools, but with tools such as Pandas and Plotly. By leveraging such tools, faster time to market with data sets can be utilized for gaining insight and deriving new ideas. Finally, the combination of Nasdaq's Digital Assets Market Data with the Databricks Lakehouse provides the simplicity, the versatility, and the powerful visualization to analyze large sets of crypto data.
Please refer to the sample notebooks for more information about getting started.
Get the latest posts in your inbox
Subscribe to our blog and get the latest posts delivered to your inbox.