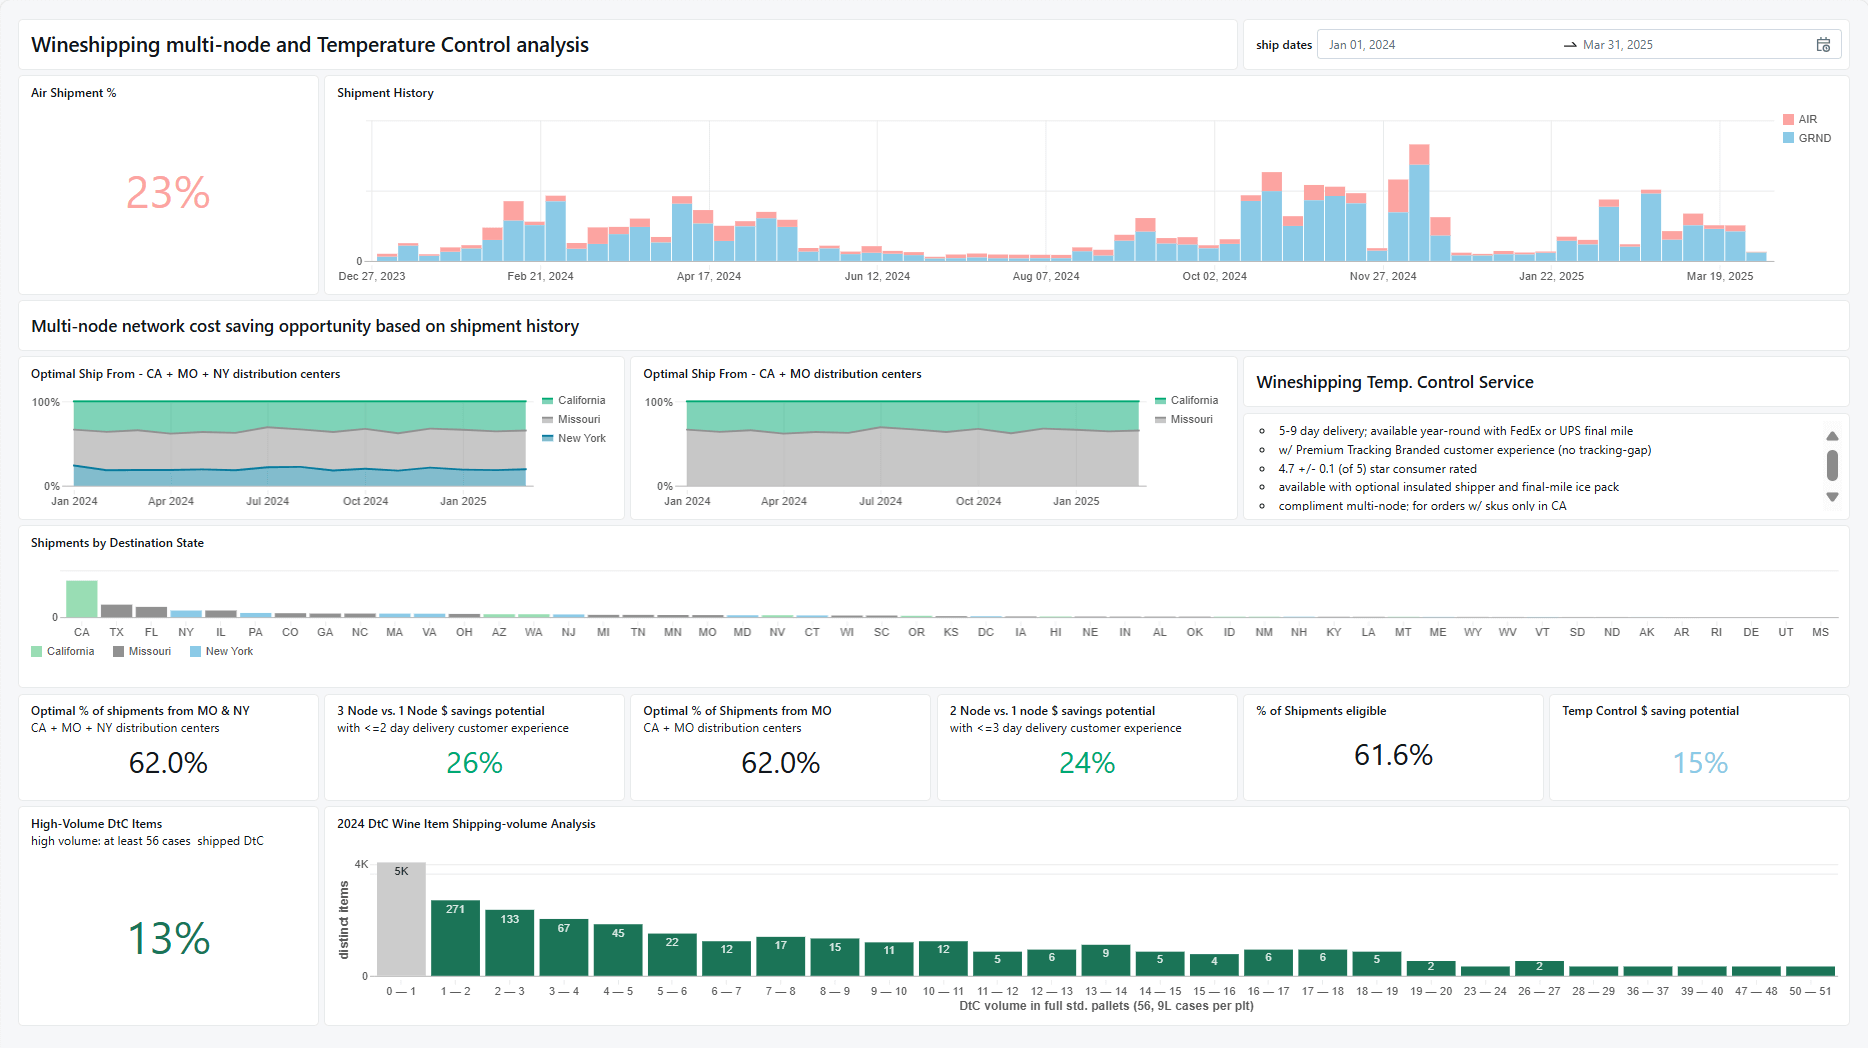
Product descriptions:
Wineshipping, a leading logistics provider serving 1,500 U.S. wine brands and shipping millions of packages annually, transformed their operations with the Databricks Data Intelligence Platform. The company previously struggled with fragmented data and legacy dashboards. Their analytics process relied on Power BI reports that business users couldn’t easily modify. By implementing Databricks AI/BI Dashboards, the company eliminated the steep learning curve of Power BI, enabling true self-service analytics where everyone could explore data and access insights autonomously, transforming how decisions are made across all organizational levels.
Fragmented data landscape hindered business agility
When Christina Mottolo joined Wineshipping as Vice President of Enterprise Applications, she encountered a severely fragmented data ecosystem that limited the company’s ability to make data-driven decisions. “The data was in about five different data warehouses. We were using Postgres, there was some data in Microsoft SQL Server, and various other sources, including spreadsheets. The data was all over the place,” Christina explained. This disjointed approach created significant redundancies and inefficiencies across the organization.
The fragmentation forced line-of-business systems to function outside their intended purposes, as Pawel Smolarkiewicz, Chief Experience and Innovation Officer at Wineshipping, noted: “We were using our warehouse management system as the data repository for information we needed to drive business. That was leading to a lot of workarounds and caused us to not have the agility we wanted and needed as a business to build new solutions.”
The analytics process was equally cumbersome, relying primarily on legacy Power BI reports that business users couldn’t easily modify. When new insights were needed, employees had to submit tickets to the data team, leading to lengthy back-and-forth communications. Christina explained, “What initially starts as a simple request often evolves as we see initial results, triggering new questions and insights. Our data engineers have been instrumental in helping translate business needs into technical solutions, even as requirements evolve throughout the discovery process. But it’s a lengthy process.”
Pawel added, “With data, it’s really an iterative journey. As soon as you get a result, it answers some questions and raises 18 others. It’s the natural progression of data discovery.” This iterative nature of data analysis highlighted the need for a more agile and user-friendly solution.
Empowering business users with self-service analytics in Databricks AI/BI Dashboards
To address these challenges, Wineshipping made the strategic decision to migrate all their data to the Databricks Data Intelligence Platform. “We just needed to get it all in one place. And then we started to sort through it and get it cleaned so we could actually leverage it,” Christina explained. This centralization created a single source of truth for the entire organization.
Central to this transformation was the implementation of the medallion architecture, a data design pattern that organizes information through progressive refinement layers. Pawel elaborated, “The medallion architecture has been instrumental in our data transformation journey. By structuring our data through Bronze, Silver and Gold layers, we’ve created a scalable foundation that maintains data quality while enabling self-service analytics.”
The true game changer came with the adoption of Databricks AI/BI Dashboards. “We were very early adopters of AI/BI Dashboards because we were so ready for it,” Pawel shared. Unlike Power BI, which required specialized knowledge of data modeling concepts and complex DAX formulas, AI/BI Dashboards offered an intuitive, low-code interface that business users could immediately understand. This fundamentally different approach meant that everyone — not just data specialists — could create and modify visualizations independently.
“There’s that really great balance of usability, modern UI and then just enough widgets and just enough complexity without the noise or legacy getting in the way. This is exactly what we were looking for,” Pawel noted.
Instead of exporting CSVs from Power BI and manipulating them in Excel, business users could now create visualizations directly in Databricks with data refreshed every 15–30 minutes. This intuitive experience coupled with immediate access to fresh data drove rapid adoption across the organization, effectively ending the never-ending BI request backlog that had plagued their previous approach.
Transformative business impact through improved productivity and faster decision-making
The adoption of Databricks AI/BI Dashboards at Wineshipping has been remarkable, with the company now maintaining approximately 140 dashboards in production. In just one week, 105 users out of about 150 potential users actively engaged with these dashboards — representing a 75% adoption rate. Christina emphasized, “The users range from our CEO to hourly employees. It’s really throughout the entire company.”
AI/BI Dashboards now power virtually every business function, transforming operations across departments. Finance leverages real-time forecasting tools, sales utilizes geographic visualization dashboards, operations benefits from comprehensive logistics monitoring and customer service gains visibility into service metrics. Even project management has been revolutionized with dashboard-driven workflows.

Pawel shared the profound impact on the business: “We couldn’t have achieved our strategic objectives without going on this data enablement journey that Databricks enabled. Wineshipping has leveraged these data insights to drive operational efficiency and win market share in a competitive industry.”
Looking ahead, Wineshipping is excited about the potential of Databricks AI/BI Genie to further democratize data access. “It has helped drive adoption and encourage people to just try it,” Pawel noted. “It’s played an important role in demonstrating that analytics doesn’t have to be intimidating or complex.”
For Wineshipping, the journey with Databricks has been transformative. Pawel concluded, “I’ve never second-guessed our decision to put our bet on Databricks here at Wineshipping. The platform has been instrumental in our ability to build a truly data-driven organization that can adapt quickly to market changes and customer needs.”
