Data Quality Management With Databricks

Liping Huang, Sr. Solutions Architect, and Lara Rachidi, Solutions Architect
What Is Data Quality?
Data quality is a key success factor for all organizations. Undetected errors or invalid data can mislead decision-makers, create missed opportunities and prevent compliance with regulations. According to Gartner, data quality issues cost the average organization $12.9 million every year.
However, ensuring data quality at scale is not an easy task, as it requires a combination of people, processes and technology to guarantee success. We will explore how Databricks can help with data quality management in analytical data platforms, and how customers can accelerate the implementation of a data quality management framework with Lakeflow pipelines.
Principles of Data Quality
Before implementing the techniques detailed below, it is crucial to bring together a variety of stakeholders to help define a data governance framework. There are a few essential aspects to consider during this process:
- The success criteria will be slightly different for each organization, and it is vital that multiple personas have input into this framework, including data teams, data consumers and decision-makers
- Data quality management must cover the entire data estate of an organization, encompassing both operational data stores (OLTP) and analytical data platforms (OLAP)
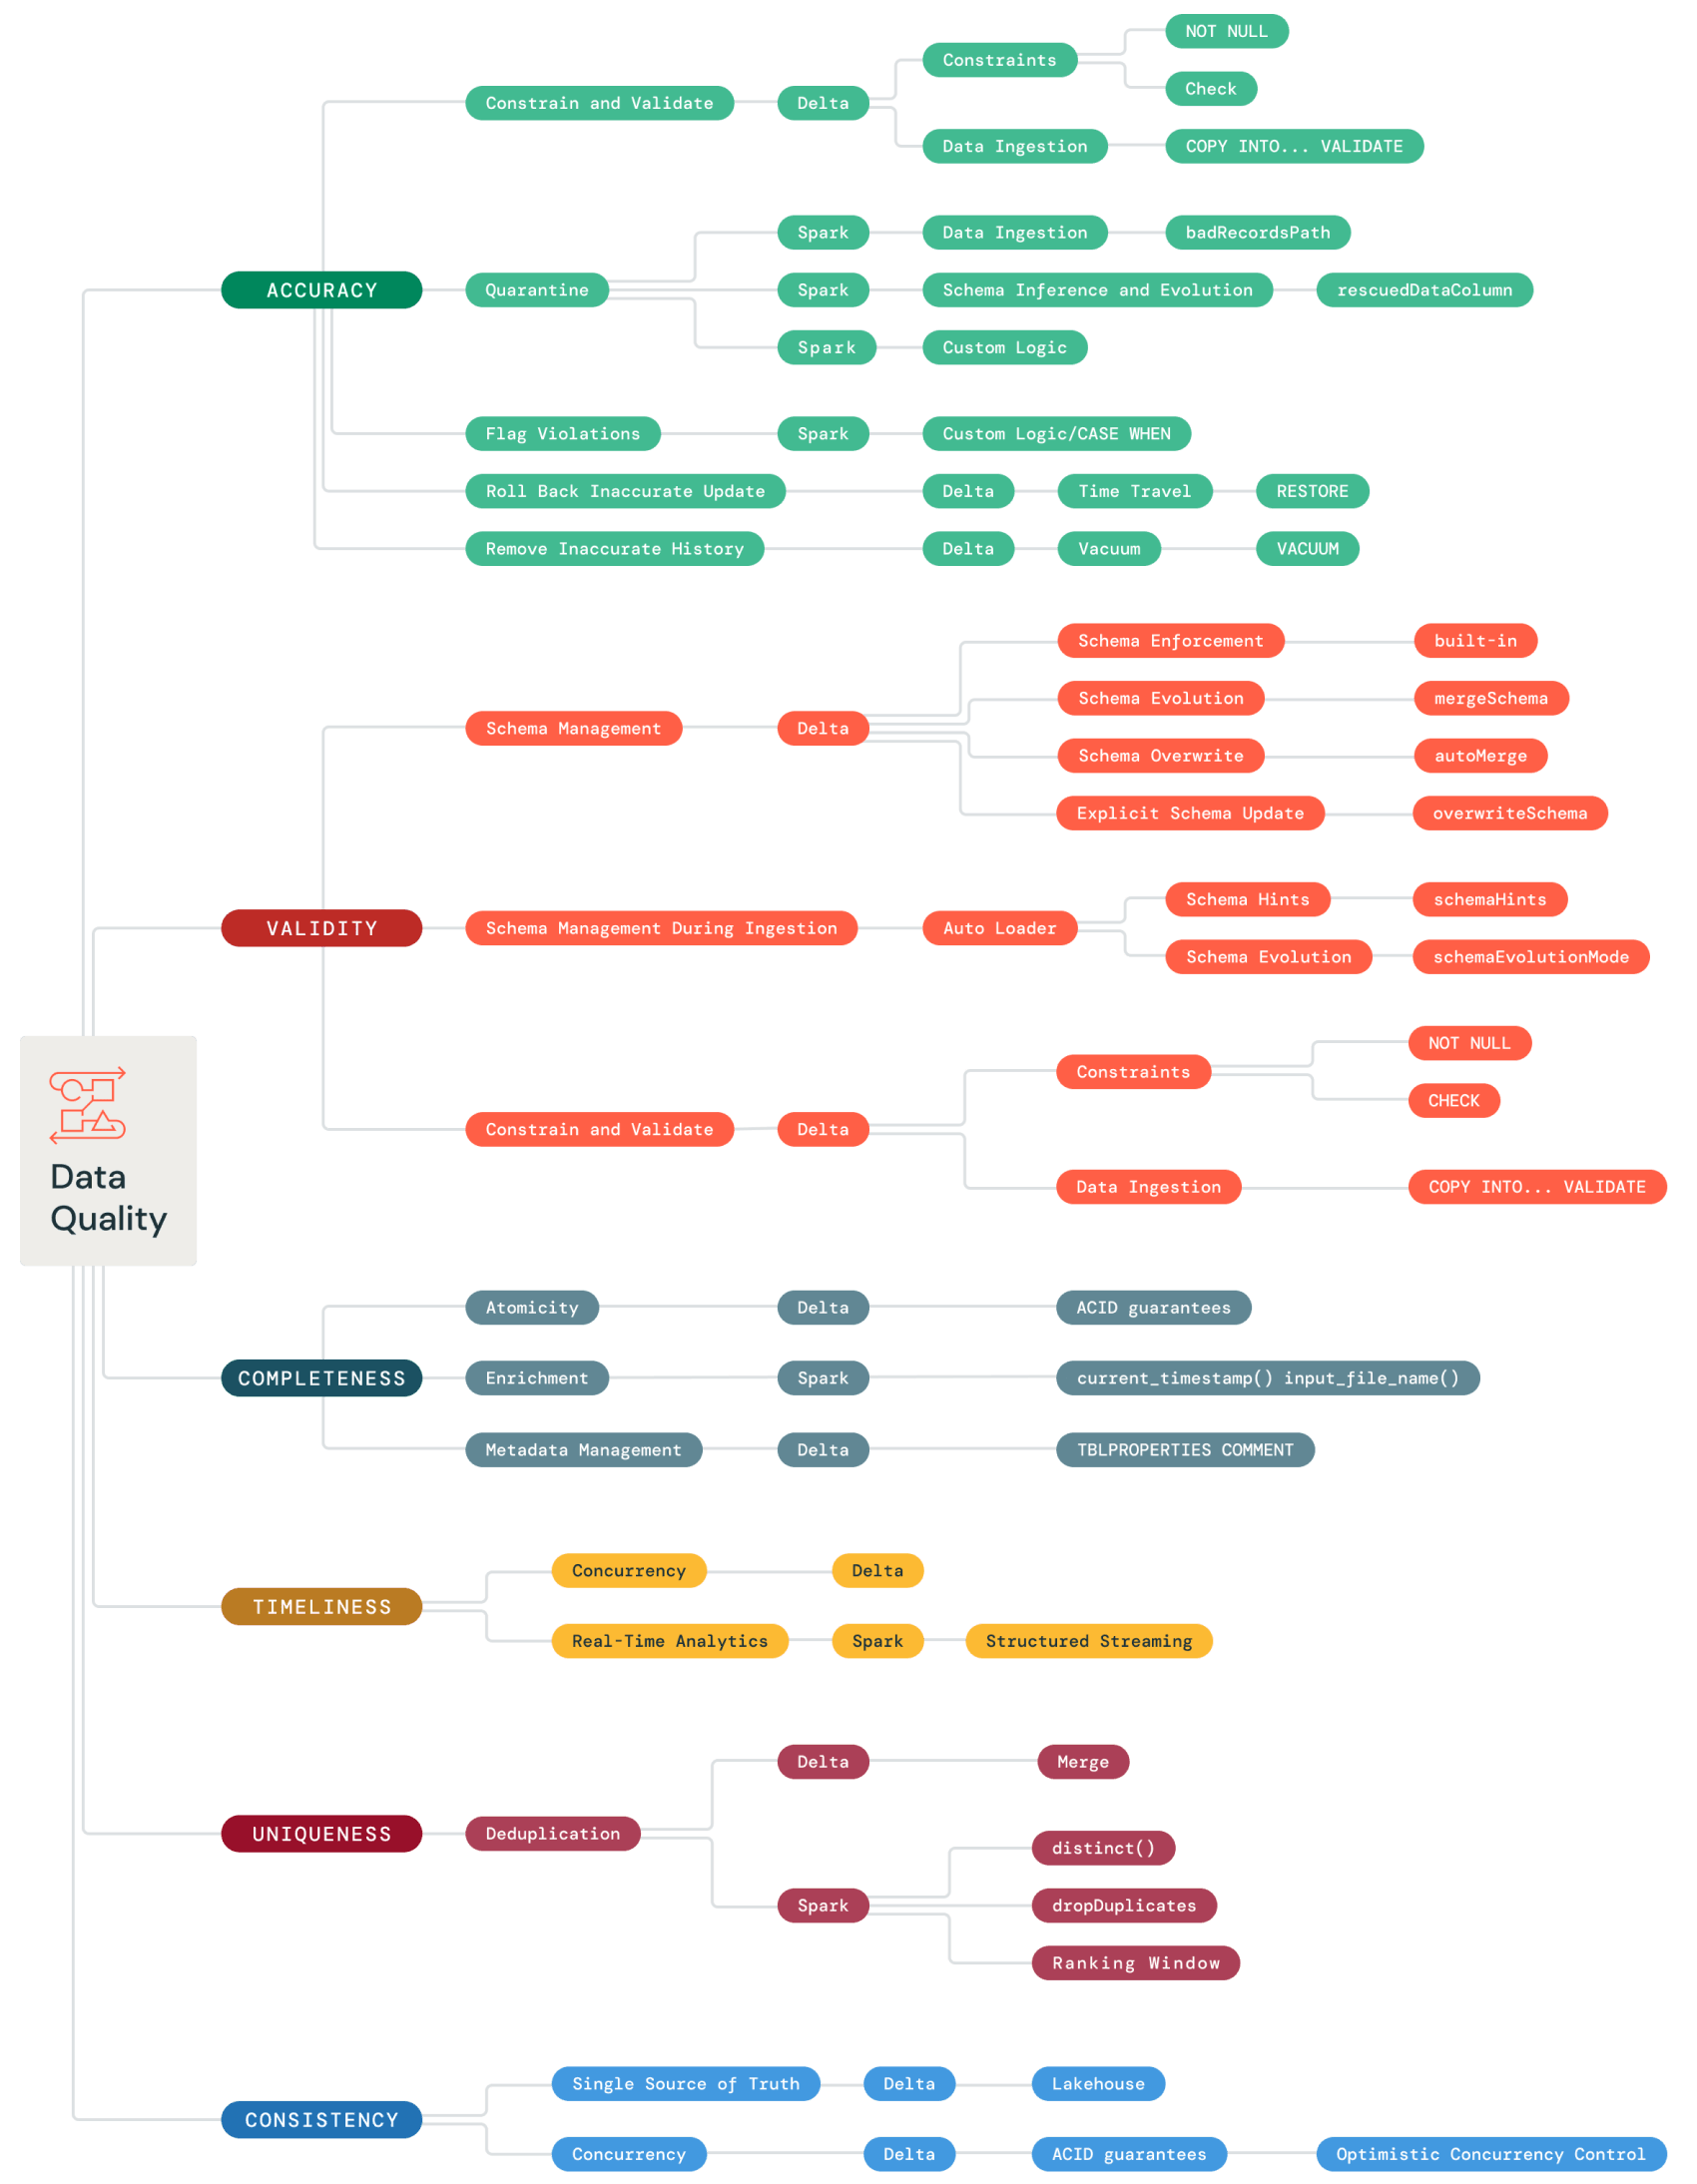
A proven tool for understanding the different aspects of data quality is the “Six Dimensions” model. This model breaks data quality down into the following concepts:
- Consistency – Data values should not conflict with other values across data sets
- Accuracy – There should be no errors in the data
- Validity – The data should conform to a certain format
- Completeness – There should be no missing data
- Timeliness – The data should be up to date
- Uniqueness – There should be no duplicates
It is likely that data entering an analytics platform will initially not satisfy all six dimensions, especially when incorporating multiple source systems. As the data moves through the platform, it should be cleaned and transformed to improve its quality. When the data reaches the data consumers, it should satisfy each dimension.
Data Quality in the Lakehouse
The architectural features of the Databricks Lakehouse Platform can assist with this process. By merging the data lake and data warehouse into a single system, organizations can remove data silos, house all workloads from AI to BI in a single place, and enable all teams and personas to collaborate on the same platform. The medallion architecture provides a clear structure for the “when, why and what” of cleaning and transforming data. As a result, a data governance framework can be implemented on a Databricks Lakehouse in an efficient and consistent manner.
Lakehouse Monitoring is an integrated platform service that provides out-of-the-box quality metrics for data and AI assets and an auto-generated dashboard to visualize these metrics. It’s the first AI-powered monitoring service for both data and ML models. Users can define custom metrics tied to their business logic and be alerted of data quality issues. Those alerts are incorporated into Unity Catalog’s data lineage to facilitate root-cause analysis.
The following sections will cover each of the six dimensions in more detail, including the relevant techniques and features that the Databricks platform provides.
Consistency
When discussing data quality, “consistency” has two key aspects:
- Data values used by data consumers do not conflict with each other. For instance, the value ‘customer churn’ will return the same result when queried by analysts from table_a or by data scientists from table_b
- The correct data is returned to the user/written, regardless of concurrent read or write processes affecting the relevant data objects
Both aspects help ensure that users will always receive the correct version of the truth.
Achieving the first aspect requires input from the business — typically, business logic will be embedded within transformation pipelines to correct any contradictory data values. However, Databricks Lakehouse architecture and implementation of Delta do assist with both aspects of the consistency dimension.
The Lakehouse
Inconsistencies can occur when changes in one data system are not replicated in another (e.g., a data lake and separate data warehouse). Databricks helps prevent this issue by housing all the data within the lakehouse, which provides a single source of truth and prevents data silos.
Additionally, one benefit of the medallion architecture is the structured and scalable approach to data cleaning by using the Bronze, Silver and Gold layers. In this architecture, the data is going to be further validated and enriched as it moves from Bronze to Silver to Gold.
- In the Bronze layer, the data is ingested from various sources and it’s generally retained fully unprocessed. At this stage, it is recommended to keep the data in a raw state and augment it with additional information to facilitate discovery.
- Most of the transformation and cleaning steps happen at the Silver layer, which constitutes the single source of truth. A lot of data quality processes happen at this stage, such as deduplication or schema enforcement.
- The Gold layer provides data consumers with a refined view of the aggregated data. These refined tables are used for reporting and dashboarding.
Delta Lake
Delta can help achieve the second aspect of consistency, as it is ACID compliant at the table level and uses optimistic concurrency control. This means that users will see a consistent and predictable snapshot of each table, regardless of any other in-flight read or write operations, and multiple writes occurring against the same table will be executed in the correct order.
In Delta, write operations occur in three steps: ‘Read’, ‘Write’, and ‘Validate and Commit’. Changes are staged and (if no conflicts are found during validation) are then committed to a new, versioned snapshot. However, if any conflicts are found, the write operation will fail with a concurrent modification exception.
Parquet tables do not benefit from these features. However, existing Parquet tables can be easily converted to Delta tables, as shown below.
Accuracy
Data is considered accurate if it correctly represents factual information about the business (typically provided by the source systems). Maintaining accurate data is essential to establishing trust in an analytics platform. It requires that any erroneous data values are actively identified and remediated.
Databricks offers three features/techniques that can ensure that only accurate data is processed and presented to end users:
- Constraints and Validate
- Quarantining data
- Flagging violations
Additionally, the following two features can assist in repairing and removing inaccurate data:
- Time travel–based rollback
- Using Vacuum to delete incorrect table versions
Constraints and Validate
Constraints enable the analytics platform to automatically identify a data set that contains errors and prevent it from being inserted into a table. Two types of constraints are supported with Delta tables:
- NOT NULL: prevents any NULL values from being inserted into the column
- CHECK: requires that the specified Boolean expression must be true for each input row
When a constraint is violated for any row, the entire transaction will fail, raise an error and roll back.
The two examples below show how constraints can be added, removed and displayed.
When attempting to add a constraint to a table that contains data, the new constraint must not be in conflict with any existing data values. For example, a NOT NULL constraint cannot be added to a column that contains a NULL value. Consequently, it is recommended that constraints are added before data is loaded. Alternatively, invalid records can be manually modified or removed.
Errors are most commonly created in source systems, and are then carried through into the analytics platform. When ingesting data using the COPY INTO command, the VALIDATE keyword can be used to run a series of checks against the data before the copy executes. These validation checks will ensure that:
- All NOT NULL and CHECK constraints are met
- The data can be parsed
- The data set’s schema matches that of the table
By default, the VALIDATE keyword will inspect the entire data set, but the number of rows to check can also be specified. The COPY INTO query will return a preview (of up to 50 rows) of the data, which can be inspected by the data practitioner.
Expectations With Lakeflow pipelines
Lakeflow pipelines makes it easy to build and manage reliable data pipelines that deliver high-quality data on Delta Lake by offering out-of-box features for handling expectations and data quality monitoring.
Lakeflow pipelines can prevent bad data from flowing through data pipelines using validation and integrity checks in declarative quality expectations. An optional ON VIOLATION clause can be added to define how bad quality data should be handled when the constraint is violated. There are three ways to handle the violation: retaining invalid records, dropping invalid records or failing on invalid records.
Lakeflow pipelines expectations are being built into all Delta tables so that users can set expectations for any table.
- Retain invalid records:
The rows will not be dropped; however, the violation will be reported.
- Drop invalid records:
The rows violating the constraint will be dropped.
- Fail on invalid records:
The job will fail when records violate the constraint.
Fail expectations modify the Apache Spark™ query plan of transformations to track information required to detect and report on violations. For many queries, it is possible to use this information to identify which input record resulted in the violation. The following is an example exception:
expect_all can be used to specify multiple data quality constraints.
- Retain invalid records:
- Drop invalid records:
- Fail on invalid records:
A collection of expectations can be defined as a variable and passed to one or more queries:
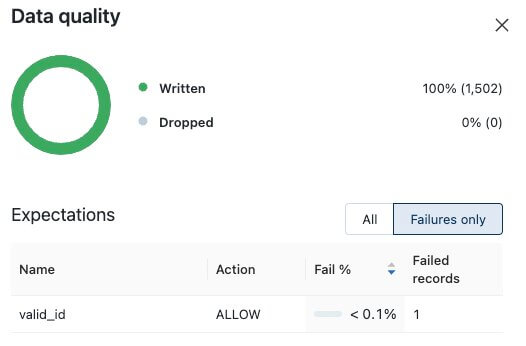
Data quality validation and check results can be viewed in the Lakeflow pipelines UI, and are automatically logged into event logs as Delta tables, so that data engineers can monitor data quality by querying those tables, building dashboards and/or setting up Databricks SQL (DB SQL) alerts.
Data Quarantine
Quarantining allows transformations to insert good data while storing bad data separately for later review. Once a quarantine record has been reviewed (and fixed), it may be rerun through the pipeline and inserted into the target table.
Databricks offers multiple out-of-box quarantining features. These include:
- badRecordsPath when using Spark in the Databricks Lakehouse Platform, which allows the data practitioner to set the path to record bad records or files that are encountered during data loading
- Auto Loader, which can safely capture and store any data that does not match the target schema by using a rescued data column. More information on Auto Loader can be found in the Validity section below.
In Spark, for both batch and streaming workloads, custom logic can also be written to quarantine bad data.
The following is an example implementation for a batch case.
Bad records can be identified and inserted into the quarantine table. The remaining data set can then be inserted into the target Silver table.
Quarantining is particularly useful for streaming data. This can be implemented by using Structured Streaming and leveraging the foreachBatch() function to write to different tables.
The following example demonstrates this approach, and uses filters to identify the records that must be quarantined. The example query also uses a MERGE INTO to avoid writing duplicate records into the target table.
Note that when using foreachBatch, data in each microbatch is treated as static rather than streaming. This means that when writing the microbatch data to a table, the ‘write’ command must be used rather than the usual ‘writeStream’ command. Also note that foreachBatch will be less performant if your target table is large.
It is possible to quarantine bad data using Lakeflow pipelines, as shown in this example. This can be achieved by creating rules that are the inverse of expectations defined and write the bad data to a separate downstream table.
Flag Violations
In this approach, all incoming data is ingested to the target table, but any records that fail the checks are tagged. This is achieved by adding an additional column to the target table, which will capture the results of any data quality checks. The below example shows how to flag violations on a single column using a simple CASE WHEN statement.
This approach can be extended, capturing the result of multiple data quality checks. Optionally, this metadata can be displayed to users, or could be used during downstream transformations (for example, excluding bad records from aggregations). This talk is a great example of building a data quality test framework on Databricks.
Summary – When to Use Constraints, Expectations, Quarantining or Violation Flagging
Constraints
- Will block the entire load if any constraints are violated
- Simple implementation
Expectations
- Uses Lakeflow pipelines: higher level of abstraction
- Declarative quality expectations
Quarantine
- Keeps job running
- Loads good data into the target table
- Isolates bad data in a quarantine table
Flag Violations
- Keeps job running
- Loads all data into the target table
- Tags bad data
Lakehouse Monitoring
In order to monitor the six dimensions, data practitioners can leverage the Lakehouse Monitoring capability.
Monitor All Data Assets
In order to use Lakehouse Monitoring, the workspace needs to be Unity Catalog-enabled and users need to have access to Databricks SQL. Lakehouse Monitoring uses serverless job compute.
Users can configure a table to be monitored using either the Databricks UI or the API. Lakehouse Monitoring provides the following types of analysis: time series, snapshot and inference.
- Time series profile: A table containing values measured over time. This table includes a timestamp column.
- Snapshot profile: Any Delta managed or external table.
- Inference profile: A table containing predicted values output by a machine learning classification or regression model. This table includes a timestamp, a model ID, model inputs (features), a column containing model predictions, and optional columns containing unique observation IDs and ground truth labels. It can also contain metadata, such as demographic information, that is not used as input to the model but might be useful for fairness and bias investigations or other monitoring.
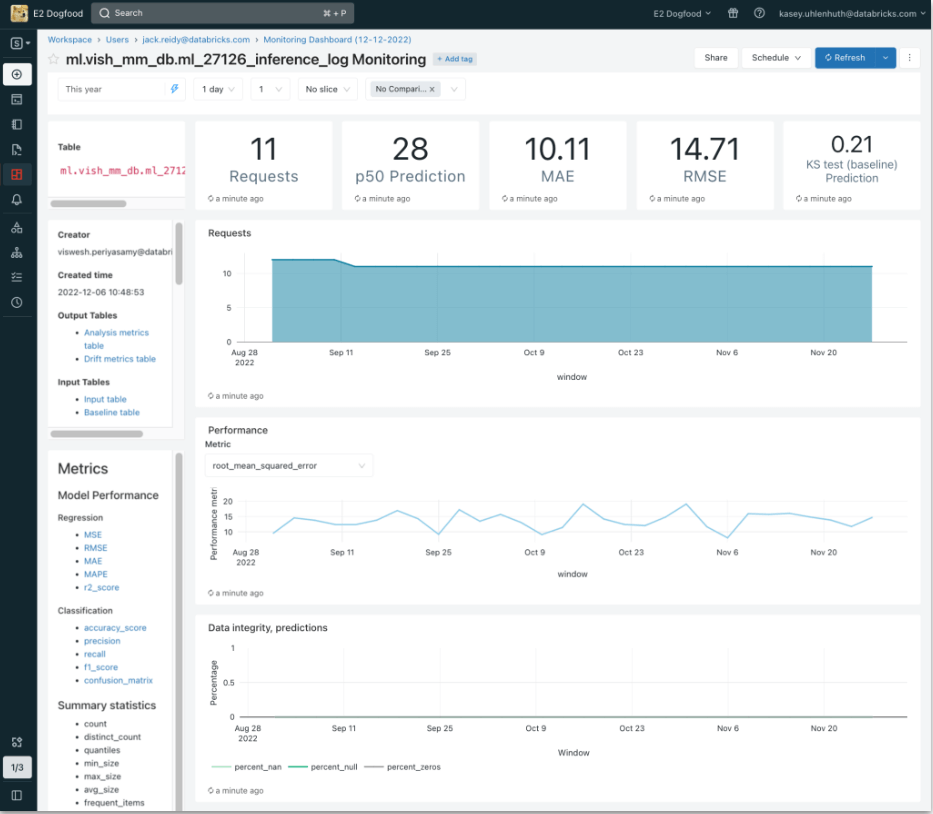
A table monitor creates two metric tables and a dashboard. Metric values are computed for the entire table, and for the time windows and data subsets (or “slices”) that are specified when the monitoring is created. In addition, for inference analysis, metrics are computed for each model ID.
The metric tables are Delta tables and are stored in a Unity Catalog schema that users can specify. Users can query these tables using Databricks SQL and create associated dashboards and alerts. A Databricks SQL dashboard is auto-generated by default to help visualize these metrics over time.
All entities (tables and models) within Unity Catalog, regardless of how they are produced (dbt, Lakeflow pipelines, Workflows, DB Serving, third-party serving, etc.) are monitored by one Lakehouse feature — Lakehouse Monitoring.
Monitor Metrics
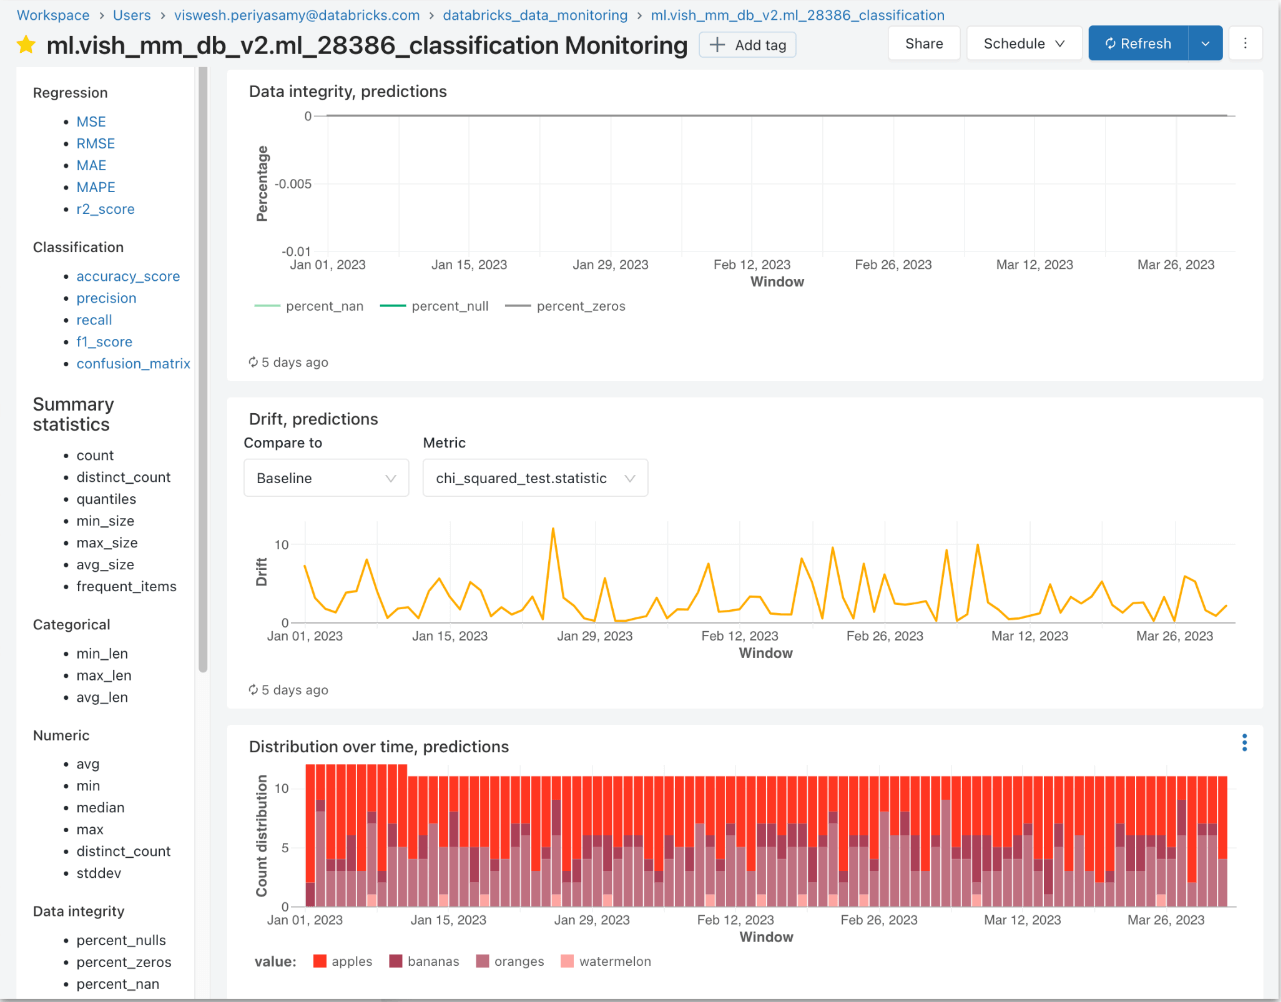
Lakehouse Monitoring produces a variety of tables and out-of-the-box metrics for Delta tables in the Unity Catalog:
- Profiling data tables, with metrics such as average, mean, median
- Data drift tables, with metrics such as the percentage change in nulls/count
- Custom metrics can be built as SQL expressions on top of these out-of-the-box metrics automatically provided by the monitoring solution
- Users determine how often those metrics should be refreshed
Data Quality Alerts
All of the metrics described above are visualized in a DB SQL dashboard. Users can then set up DB SQL alerts to any destination, such as Slack.
Webhooks can also be used to automatically retrain a model when a defined threshold for a certain metric (e.g. drift) is met without manual intervention needed.
Eventually, Lakehouse Monitoring will evolve towards enabling automatic alerting, with thresholds that can be learned and adapted as data changes.
Roll Back
The Time Travel feature of Delta Lake simplifies manual rollbacks, which may be necessary if inaccurate data is written to a table, or if valid data is mistakenly removed. The RESTORE command can easily revert a table to a previous numbered version or timestamp.
Vacuum
If inaccurate data has been corrected in a table, it may be desirable to prevent older versions of that table from being accessible via Time Travel. Additionally, when data is deleted, it is only removed from the current table snapshot, which may be an issue for sensitive data (e.g., PII). In both cases, vacuum can ensure that the data is fully removed and inaccessible.
Databricks will automatically vacuum versions of Delta Lake tables that exceed the data retention period. This process can be triggered manually using the VACUUM operation, and can remove versions of the data that are still within the data retention period. Note that after a vacuum has occurred, the data may still exist in the cache. The cache can be cleared by restarting the cluster.
A potential drawback of this operation is that users will lose the ability to time travel back to a table version that has been removed via vacuuming. Additionally, a balance should be found between keeping the ability to review old data versus the cost incurred to keep previous versions in storage.
Validity
Validity means that the data has conformed to a required format. In addition to the ‘constraint and validate’ and expectations in Lakeflow pipelines discussed in the Accuracy section above, Databricks offers the following features to assist with data validity:
- Schema Enforcement
- Schema Evolution and Overwrite
- Explicitly Update Schema
- Auto Loader
Schema Enforcement
Also known as Schema Validation, Schema Enforcement is a built-in feature of Delta Lake that prevents users and processes from adding data that does not match a target table’s schema. For example, incoming data could have an INT value in a column that should only contain BOOLEAN values, or it could have a column name that doesn’t exist in the target schema. In both cases, Schema Validation will prevent the data from being written to the target table.
If the incoming data contains any additional columns that are not present in the target table, then the write will be rejected. Note that Schema Enforcement is not case-sensitive and will not trigger based on column names that differ only by case. If the incoming data is missing columns that are present in the target schema, Delta will attempt to use NULL as a value for those columns.
Schema Evolution and Schema Overwrite
In some cases, source data can be constantly evolving, thus requiring frequent changes to the target table’s schema to prevent Schema Enforcement from blocking the data loads. Data practitioners can use Schema Evolution to handle these situations without having to rewrite any transformation logic.
Schema Evolution automatically modifies a table’s schema to add new columns as they appear in incoming data sets. This can be enabled by using the write command’s mergeSchema option.
It is also possible to set the ‘autoMerge’ option for an entire Spark session with the following syntax. Note that this will also suppress any warnings concerning Schema Evolution.
While Schema Evolution can account for new columns, it will not make changes that may affect existing data, such as dropping columns, changing an existing column’s data type, or renaming columns (beyond case changes). In these cases, the overwriteSchema option can be used, as shown below.
There are a few reasons why deleting the entire directory and creating a new table on the same path is not recommended as a best practice:
- It can take a long time to delete an entire directory (particularly in the case of large files)
- It’s harder to recover in case the wrong table is deleted
- The directory deletion is not atomic (while the table is being deleted, a concurrent query reading the table can fail or see a partial table)
Instead, there are multiple benefits that come with overwriting a table:
- It is much faster because it doesn’t need to list the directory recursively or delete any files
- The old version of the table still exists, and can be retrieved using Time Travel
- It’s an atomic operation: concurrent queries can still read the table while it’s being deleted
- Because of Delta Lake ACID transaction guarantees, if overwriting the table fails, the table will be in its previous state
Explicit Schema Update
In some cases, the data practitioner may wish to manually update a table’s schema. This grants a high degree of control over the process, which is valuable for complex changes, or changes that may negatively impact existing data. The possible schema alterations include:
- Adding new columns
- Changing a column’s comment
- Changing a column’s ordering (including nested fields)
- Replacing columns
- Renaming existing columns (see enable column mapping)
- Dropping column
- Modifying a column’s type
If the Delta table schema is updated during streaming, stream reads from that table will terminate. A restart is then required for streams to resume.
Summary — Schema Management Features
Schema Enforcement
- Automatic
- Fails jobs if any new columns are found
- Will use NULL as a default for missing columns

Schema Evolution
- Automatic
- Can add new columns
- Can change data from a null type to any other type
- Can change data type from byte to short or integer
Schema Overwrite
- Automatic
- Can drop a column
- Can change an existing column’s data type
- Can rename column names that differ only by case
Explicitly Update Schema
- Manual intervention
- Custom logic
- Variety of changes including adding, dropping and changing columns
Auto Loader
Furthermore, Auto Loader incorporates a variety of useful features that assist with loading data into Delta. Some of these are beneficial from a data validity perspective:
- Schema hints can enhance and control schema inference
Schema Evolution in Auto Loader can control how and when Auto Loader will evolve the schema of a target table versus raising an error
Completeness
Completeness means that all the data necessary for a particular use case is present and available. Depending on the organization and the number of source systems, this can be extremely large and is often a significant issue from a process and design perspective. As Databricks Lakehouse leverages Azure/AWS/GCP cloud storage, large volumes of data can be ingested without triggering storage sizing issues.
Additionally, Databricks offers the following features to help ensure completeness of both data and metadata during data ingestion and transformation.
Atomicity
Atomicity guarantees that each write operation will either succeed in its entirety, or automatically roll back if a failure occurs. This ensures completeness if all related records are inserted in a single transaction.
Processing each statement independently is not recommended, as this will result in separate transactions with their own ACID guarantees. Therefore, one or more transactions may fail and result in partially written and incomplete data.
Enrichment
When ingesting data, there are two useful built-in DB SQL commands that can be leverage to enrich your data:
- current_timestamp() records the timestamp at the start of the query evaluation
- input_file_name() records the source data file by returning the name of the file being read (or empty string if not available) for each row
A key benefit of enrichment is that it helps to establish relationships between tables and their source files, including where a particular data value came from, and how and when it progressed through the analytics platform. In turn, this can help track issues arising from source data and assist with identifying bugs in transformations.
Metadata Management
Completeness applies to both data and metadata, since metadata has a variety of valuable downstream uses, including search and discovery, and auditing. Databricks enables adding metadata to databases, tables, columns and individual commits.
Delta tables can have metadata added via the following properties:
- TBLPROPERTIES, which can add one or more user-defined key-value tags to the table or view
- COMMENT, which provides an overall table comment (e.g., a description)
Comments can also be added to individual columns.
The following example shows a table being created with individual column comments, an overall table comment and a single table tag.
Note that Spark is not case-sensitive by default, and therefore column or table names will not be differentiated based on case.
Metadata can also be added to databases, as per the following example.
Once added, metadata can be easily viewed, explored and leveraged in queries. If you are using Unity Catalog, you can use the integration with enterprise cataloging tools to export the metadata to have a comprehensive view of your data estate.
While the example below illustrates how to access a table’s metadata via queries, it is also possible to view metadata using the Databricks user interface.
Timeliness
Timeliness means that the data should be up to date. This target will differ depending on the organization and the use case. In general, the time that elapses between the moment a data change occurs in a source system and the moment this change is presented in the analytics system should be minimized and kept within business time constraints. The lakehouse is a single unified platform that helps address that challenge.
Delta’s High Concurrency
Delta’s ability to handle many writes against a single table means that the lakehouse can be loaded extremely quickly. Multiple pipelines can load data from different sources to a single table without encountering a state of deadlock. This minimizes the time between a new record being identified and that record being presented in the lakehouse.
Streaming
Streaming can dramatically increase the timeliness of data. Moving from a batch workload to a streaming workload means that data will be captured, ingested, processed and presented continuously. This can enable near real-time decision-making, alerting, and many other use cases. Databricks offers two mechanisms for streaming: Structured Streaming and Lakeflow pipelines.
Structured Streaming has built-in connectors for the major message stores, including Kafka, Kinesis, Event Hub and Pub/Sub. Data can be ingested directly from these streaming sources (which further reduce latency), processed with custom transformation logic, and then pushed to a real-time serving layer. The serving layer can be a target message store, a real-time BI dashboard, or other real-time application backend such as Cosmos DB.
Lakeflow pipelines unifies streaming and batch processes, and simplifies the creation of streaming pipelines by managing certain components on the user’s behalf (e.g., checkpoints, infrastructure, etc.).
Uniqueness
Uniqueness is a critical dimension of data quality management, and requires that duplicate data is not processed or presented. Duplicates in data can lead to misleading insights, especially if duplicate records are used in aggregations. Within Databricks, multiple deduplication techniques can be leveraged to guarantee data uniqueness:
- Merge
- distinct()
- dropDuplicates
- Ranking Window
Merge
Also known as an upsert, a MERGE will perform any needed updates, inserts or deletes while inserting a new data set. This also occurs as a single transaction, meaning that any changes will be successfully rolled back if any part of the merge fails.
A merge must be supplied with a matching condition, which will determine if a record already exists in the target table. Additionally, custom behavior can be triggered when certain conditions are met by using the WHEN MATCHED command. A common deduplication technique when executing a MERGE is to use the whenNotMatchedInsertAll() clause.
The following example shows a basic merge command, along with some optional WHEN matched conditions.
distinct()
The distinct() method will remove all duplicates from a given data set. By default, this will use every column while determining if a row is a duplicate. If only a subset of those columns should be considered, then a column selection can be made before calling the distinct() method.
dropDuplicates()
The dropDuplicates() method can remove duplicates within a table or incremental microbatch. By default, this will remove rows that are exact duplicates (i.e., checking all columns), but can be configured by passing in a list of the desired column names.
Ranking Window
The ranking window function can be used to deduplicate data using custom, and potentially complex, logic. For example, an incoming data set could have multiple records with the same row ID, where the latest record is correct. In this case, a MERGE would not work because the same ID is found in multiple rows, and the distinct() and dropDuplicates() methods would only keep the first record encountered, rather than the latest record. Instead, a ranking window can be used to rank the records for the same ID by timestamp, followed by filtering out all records except the latest. The code snippet below demonstrates this logic.
Summary – Deduplication Methods
MERGE
- Upsert
- Merge condition on one or multiple columns
- Can set custom match behavior
distinct() and dropDuplicates()
- Removes duplicates from a data set
- Considers all columns, unless specified
- Keeps the first record encountered
Ranking Window
- Can enable custom deduplication logic
- More flexible — e.g., can keep the latest record, rather than the first encountered
Deduplication is particularly useful for streaming cases with data sources that provide an at-least-once guarantee, as any incoming duplicate records can be handled. When using Structured Streaming, the watermark feature can limit how late the duplicate data can be and drop the window from the state after a certain amount of time has elapsed.
Finally, deduplication methods may identify and discard records based on a single column, such as a UUID. In cases where this kind of identifier is a composite (i.e., is split across more than one column), generating a single hash key from the composite columns is recommended.