What are Dataframes?
Discover how this tabular data structure enables scalable analytics across distributed computing clusters
- DataFrames are table like data structures with named columns that hold structured or semi structured data. They provide a higher level API for filtering, aggregating and joining data compared with working on individual records. DataFrames make it easier for analysts and engineers to work with large datasets using SQL like or declarative operations.
What is a DataFrame?
A DataFrame is a data structure that organizes data into a 2-dimensional table of rows and columns, much like a spreadsheet. DataFrames are one of the most common data structures used in modern data analytics because they are a flexible and intuitive way of storing and working with data.
Every DataFrame contains a blueprint, known as a schema, that defines the name and data type of each column. Spark DataFrames can contain universal data types like StringType and IntegerType, as well as data types that are specific to Spark, such as StructType. Missing or incomplete values are stored as null values in the DataFrame.
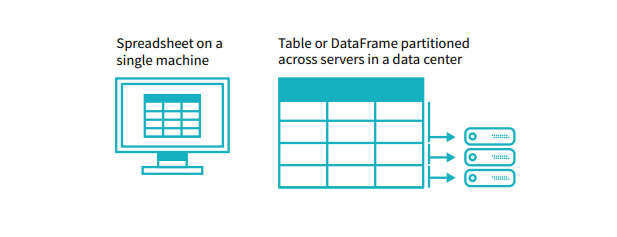
A simple analogy is that a DataFrame is like a spreadsheet with named columns. However, the difference between them is that while a spreadsheet sits on one computer in one specific location, a DataFrame can span thousands of computers. In this way, DataFrames make it possible to do analytics on big data, using distributed computing clusters.
The reason for putting the data on more than one computer should be intuitive: either the data is too large to fit on one machine or it would simply take too long to perform that computation on one machine.
The concept of a DataFrame is common across many different languages and frameworks. DataFrames are the main data type used in pandas, the popular Python data analysis library, and DataFrames are also used in R, Scala, and other languages.
The agentic AI playbook for the enterprise

Get the latest posts in your inbox
Subscribe to our blog and get the latest posts delivered to your inbox.