Building Data Science Applications on Databricks
Try this notebook in Databricks
This is part 2 of a 3 part series providing a gentle introduction to writing Apache Spark applications on Databricks. This post focuses on the tools and features that are helpful for data scientists to solve business problems instead of managing infrastructure.
The big challenge for data scientists is to take a model from the prototyping all the way into production. This process is often littered with a variety of different environments, samples of data that do not reflect production data quality, and a litany of infrastructure challenges. These problems become even worse when multiple teams are restricted to sharing one cluster for all of their work.
In these challenges lie the reason that, as a Solutions Architect, I’ve seen many data science teams become successful with Databricks. Jason Scheller described the secret to success well in his interview with SiliconAngle: “because of the notebook product that Databricks provides, there is no need for us to build an additional stack on top of that. Whatever notebook the analyst comes up with, that notebook can be inserted directly into the primary production system.” Jason also quantified the productivity gains achieved by a client's data science team: “previous to [Apache] Spark it took us about 24 hours to model one day worth of data to set up optimization for a particular campaign. With Spark we can model six months of data in about ten minutes.”
My personal experience reflects what Jason said. Running Apache Spark before Databricks was riddled with difficulty in taking prototypes to production. Additionally, waiting for infrastructure teams to provide the environment for me was frustrating. When I started at Databricks I saw how easy it was for us to run all our production workloads with our own product and how simple it was for our customers to drastically reduce their prototype to production time.
I’ve written this guide as a demonstration of the process to build a data product with Databricks. One of the most powerful aspects of Databricks is the simplicity by which users can prototype applications and then take them directly to production.
What is in this Guide
In the previous guide in this series, we provided an introduction to writing Apache Spark applications on Databricks. Be sure to check it out if you have not already! The second guide follows the same spirit but is geared towards the workflow of a data scientist. To do this, the guide starts with testing a simple idea and goes through the process of iterative data analytics. We will start with two sets of data provided by the US Department of Agriculture and the Internal Revenue Service.
![]()
The USDA data contains data about the number of farmer’s markets in zip codes across the United States.
![]()
The IRS has information about the taxes paid in different zip codes.
With these two datasets, we’re hoping to predict the number of farmers markets in a zip code by the amount of taxes paid in the area. The hypothesis is that zip codes that pay higher taxes (both personal and business) will have more farmers markets because the citizens in those zip codes have more income to pay a higher premium for locally sourced fruits and vegetables! Now this hypothesis makes a fair number of assumptions but will provide an excellent foundation for a worked example for data scientists.
While these are not large datasets by any means, we’ll learn a lot about processing data in Databricks with Apache Spark by creating powerful visualizations that display the key bits of information, cleaning the data to focus our analysis, and building a machine learning pipeline. This process makes for an excellent example for those that are just getting started with machine learning as well as those that are already familiar with other machine learning libraries like scikit-learn but aren’t sure how to build out similar pipelines in Apache Spark.
While building pipeline we will some of the convenient features of Databricks. As Jason mentioned in his interview, “A notebook in Databricks can be SQL queries, scala code, python… and the visualizations are built right in…”. For example the image below was created very quickly using Databricks built-in visualization capabilities right on top of a SQL query to quickly get a visual sense for which zip codes pay the highest taxes and what those taxes are made up of.
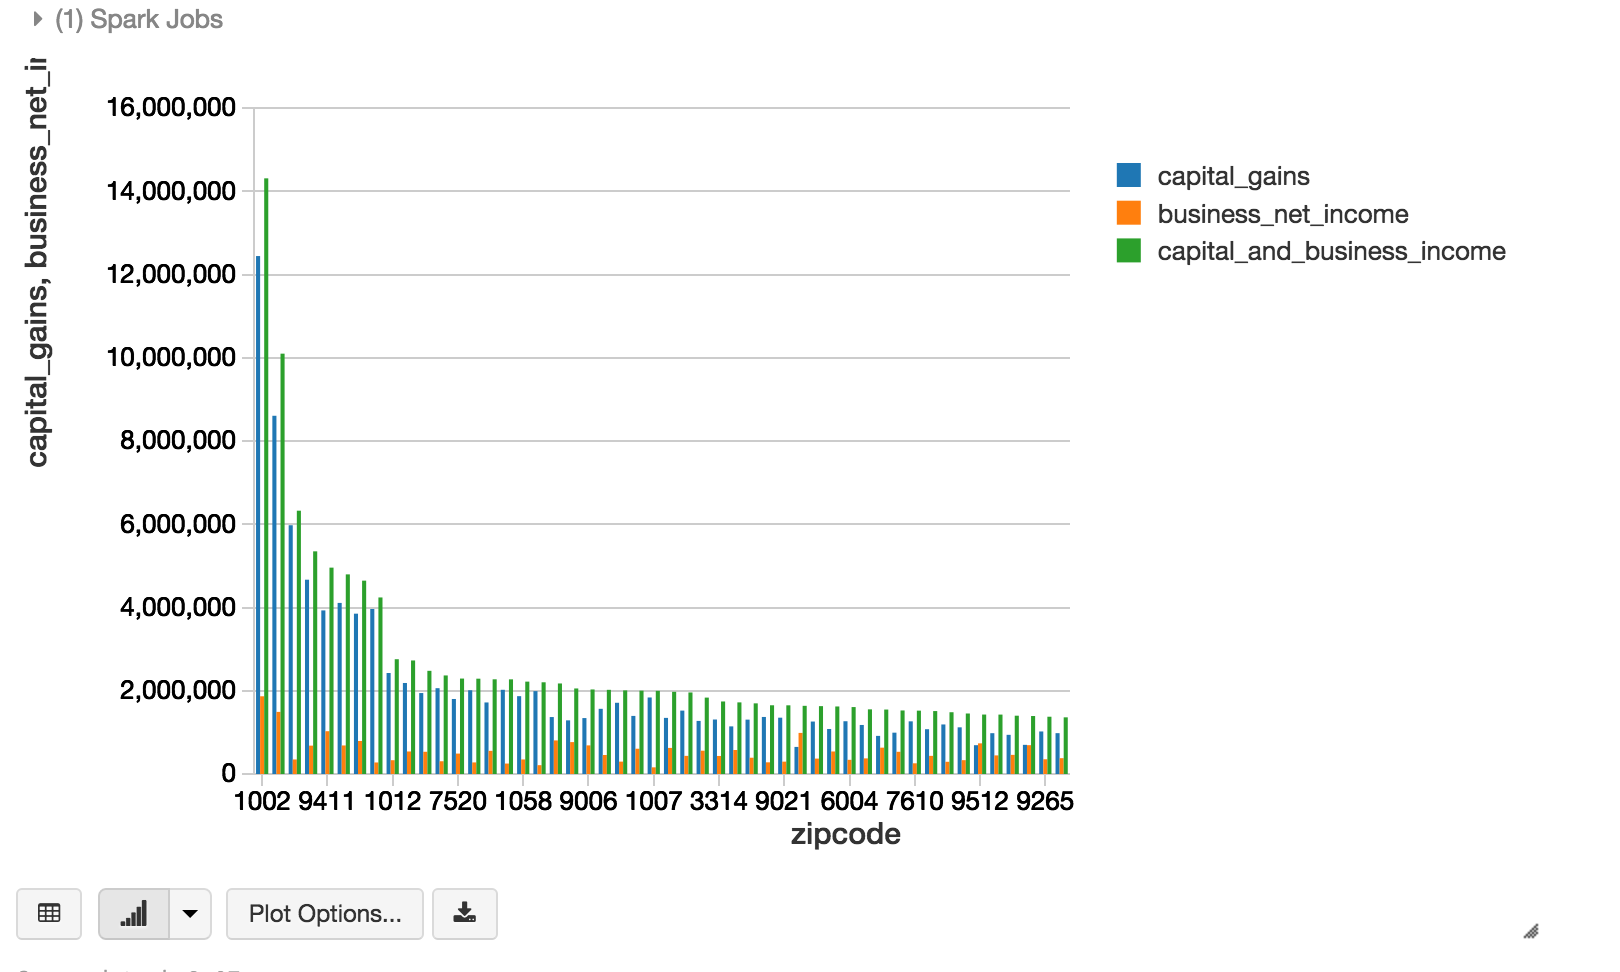
Built-in visualization in Databricks, zip codes truncated to simplify analysis.
These visualizations provide the insights that we will leverage along our path to building two machine learning models: First we will utilize linear regression to demonstrate the general process of setting up a machine learning model outside of a pipeline. It will also set a nice baseline for us to understand the predictive power of a simple linear approach in this context.
After exploring a simple linear model, we’ll take a step deeper and show how you can create a pipeline that will try a variety of different versions of the same model - a process called hyperparameter tuning - to yield better results. We’ll use this technique to tune a random forest regression model in an automated fashion. We’ll then compare the two models to see how they perform against one another.
What’s Next
You can work through the examples in this guide with the Databricks platform (Sign-up to try for free). The next guide in the series will tour the workflow that a data engineer will commonly leverage while using the Databricks platform. We’ll walk through building an ETL pipeline by connecting to a variety of data sources. We will also go through the process of creating UDFs to handle messy date time formats and combining with another dataset. The guide will have plenty of code and explanations, so stay tuned by following us on Twitter or subscribing to our newsletter!
Get the latest posts in your inbox
Subscribe to our blog and get the latest posts delivered to your inbox.