Continuous Integration & Continuous Delivery with Databricks
by Yu Peng, Andrew Chen and Prakash Chockalingam
Continuous integration and continuous delivery (CI/CD) is a practice that enables an organization to rapidly iterate on software changes while maintaining stability, performance and security. Continuous Integration (CI) practice allows multiple developers to merge code changes to a central repository. Each merge typically triggers an automated build that compiles the code and runs unit tests. Continuous delivery (CD) expands on CI by pushing code changes to multiple environments like QA and staging after build has been completed so that new changes can be tested for stability, performance and security. CD typically requires manual approval before the new changes are pushed to production. Continuous deployment automates the production push as well.

Many organizations have adopted various tools to follow the best practices around CI/CD to improve developer productivity, code quality, and deliver software faster. As we are seeing massive adoption of Databricks amongst our customer base for data engineering and machine learning, one common question that comes up very often is how to follow the CI/CD best practices for data pipelines built on Databricks.
In this blog, we outline the common integration points for a data pipeline in the CI/CD cycle and how you can leverage functionalities in Databricks to integrate with your systems. Our own internal data pipelines follow the approach outlined in this blog to continuously deliver audit logs to our customers.
Key challenges for CI/CD in building a data pipeline
Following are the key phases and challenges in following the best practices of CI/CD for a data pipeline:
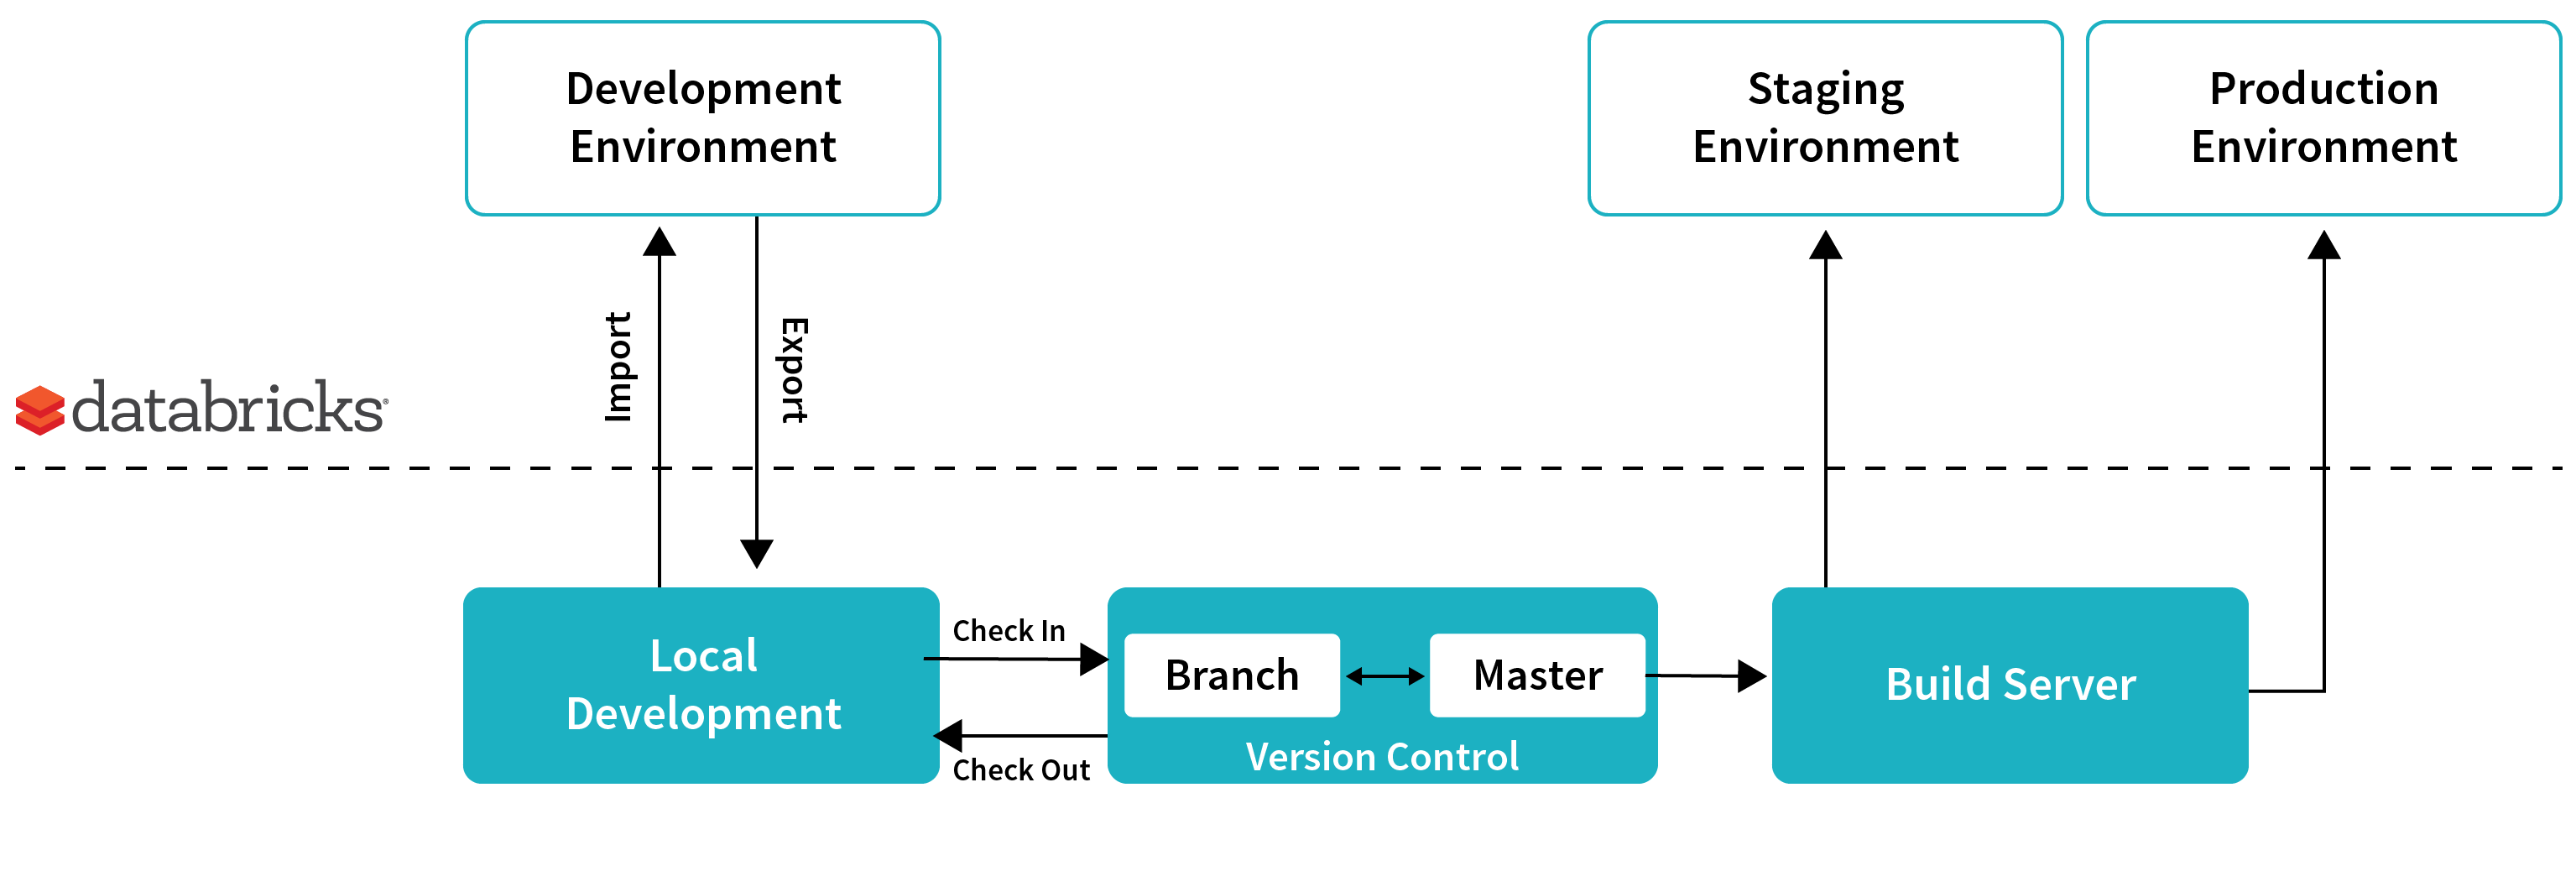
- Data exploration: Databricks’ interactive workspace provides a great opportunity for exploring the data and building ETL pipelines. When multiple users need to work on the same project, there are many ways a project can be set up and developed in this collaborative environment. Often users find it hard to get the right approach with notebooks.
- Iterative development with unit tests: As you are building ETL prototypes by exploring data in notebooks and moving towards maturity, code can get quickly unwieldy and writing unit tests can become a problem.
- Continuous integration and build: As new code is getting merged, the build server must be able to pull the latest changes and run the unit tests for various components and publish the latest artifacts.
- Pushing data pipeline to staging environment: Once all the unit tests have passed, the build server must be able to push the data pipeline to a staging environment to test the pipeline on a much larger data set that resembles production data for performance and data quality.
- Pushing data pipeline to production environment: The final phase is pushing the data pipeline in staging into production so that the next run of the pipeline picks the latest code and generates the new data set in production.
In the rest of the blog, we will walk through each of these phases and how you can leverage Databricks for building your data pipeline.
Development in Databricks’ Interactive Workspace
Lets pick a scenario where three data engineers are planning to work on Project X. Let’s say Project X is planned to enhance an existing ETL pipeline that has source code in notebooks and libraries.
The development environment in Databricks typically consists of:
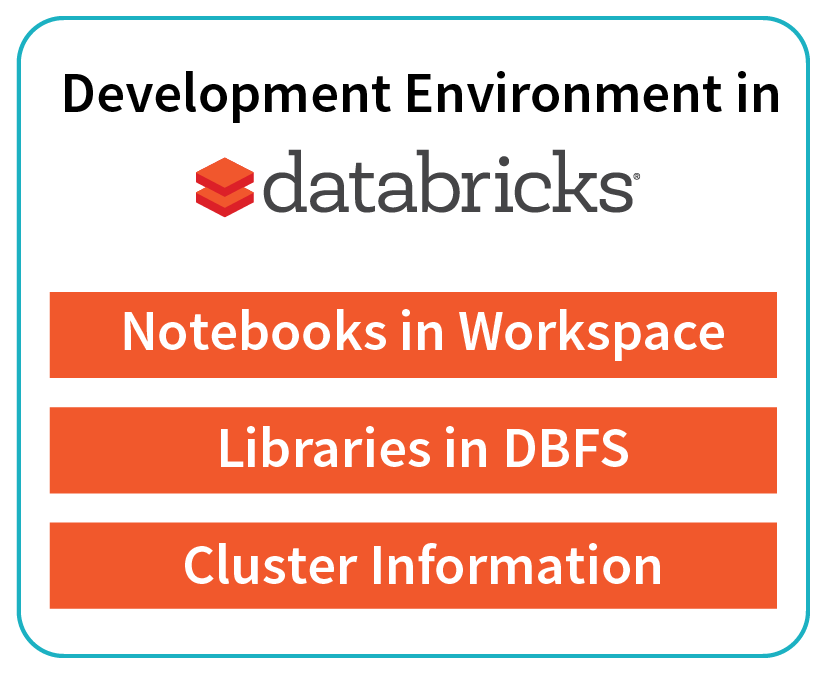
The recommended approach is to set up a development environment per user. Each user pushes the notebook to their own personal folders in the interactive workspace. They work on their own copies of the source code in the interactive workspace. They then export it via API/CLI to their local development environment and then check-in to their own branch before making a pull request against the master branch. They also have their own small clusters for the development.
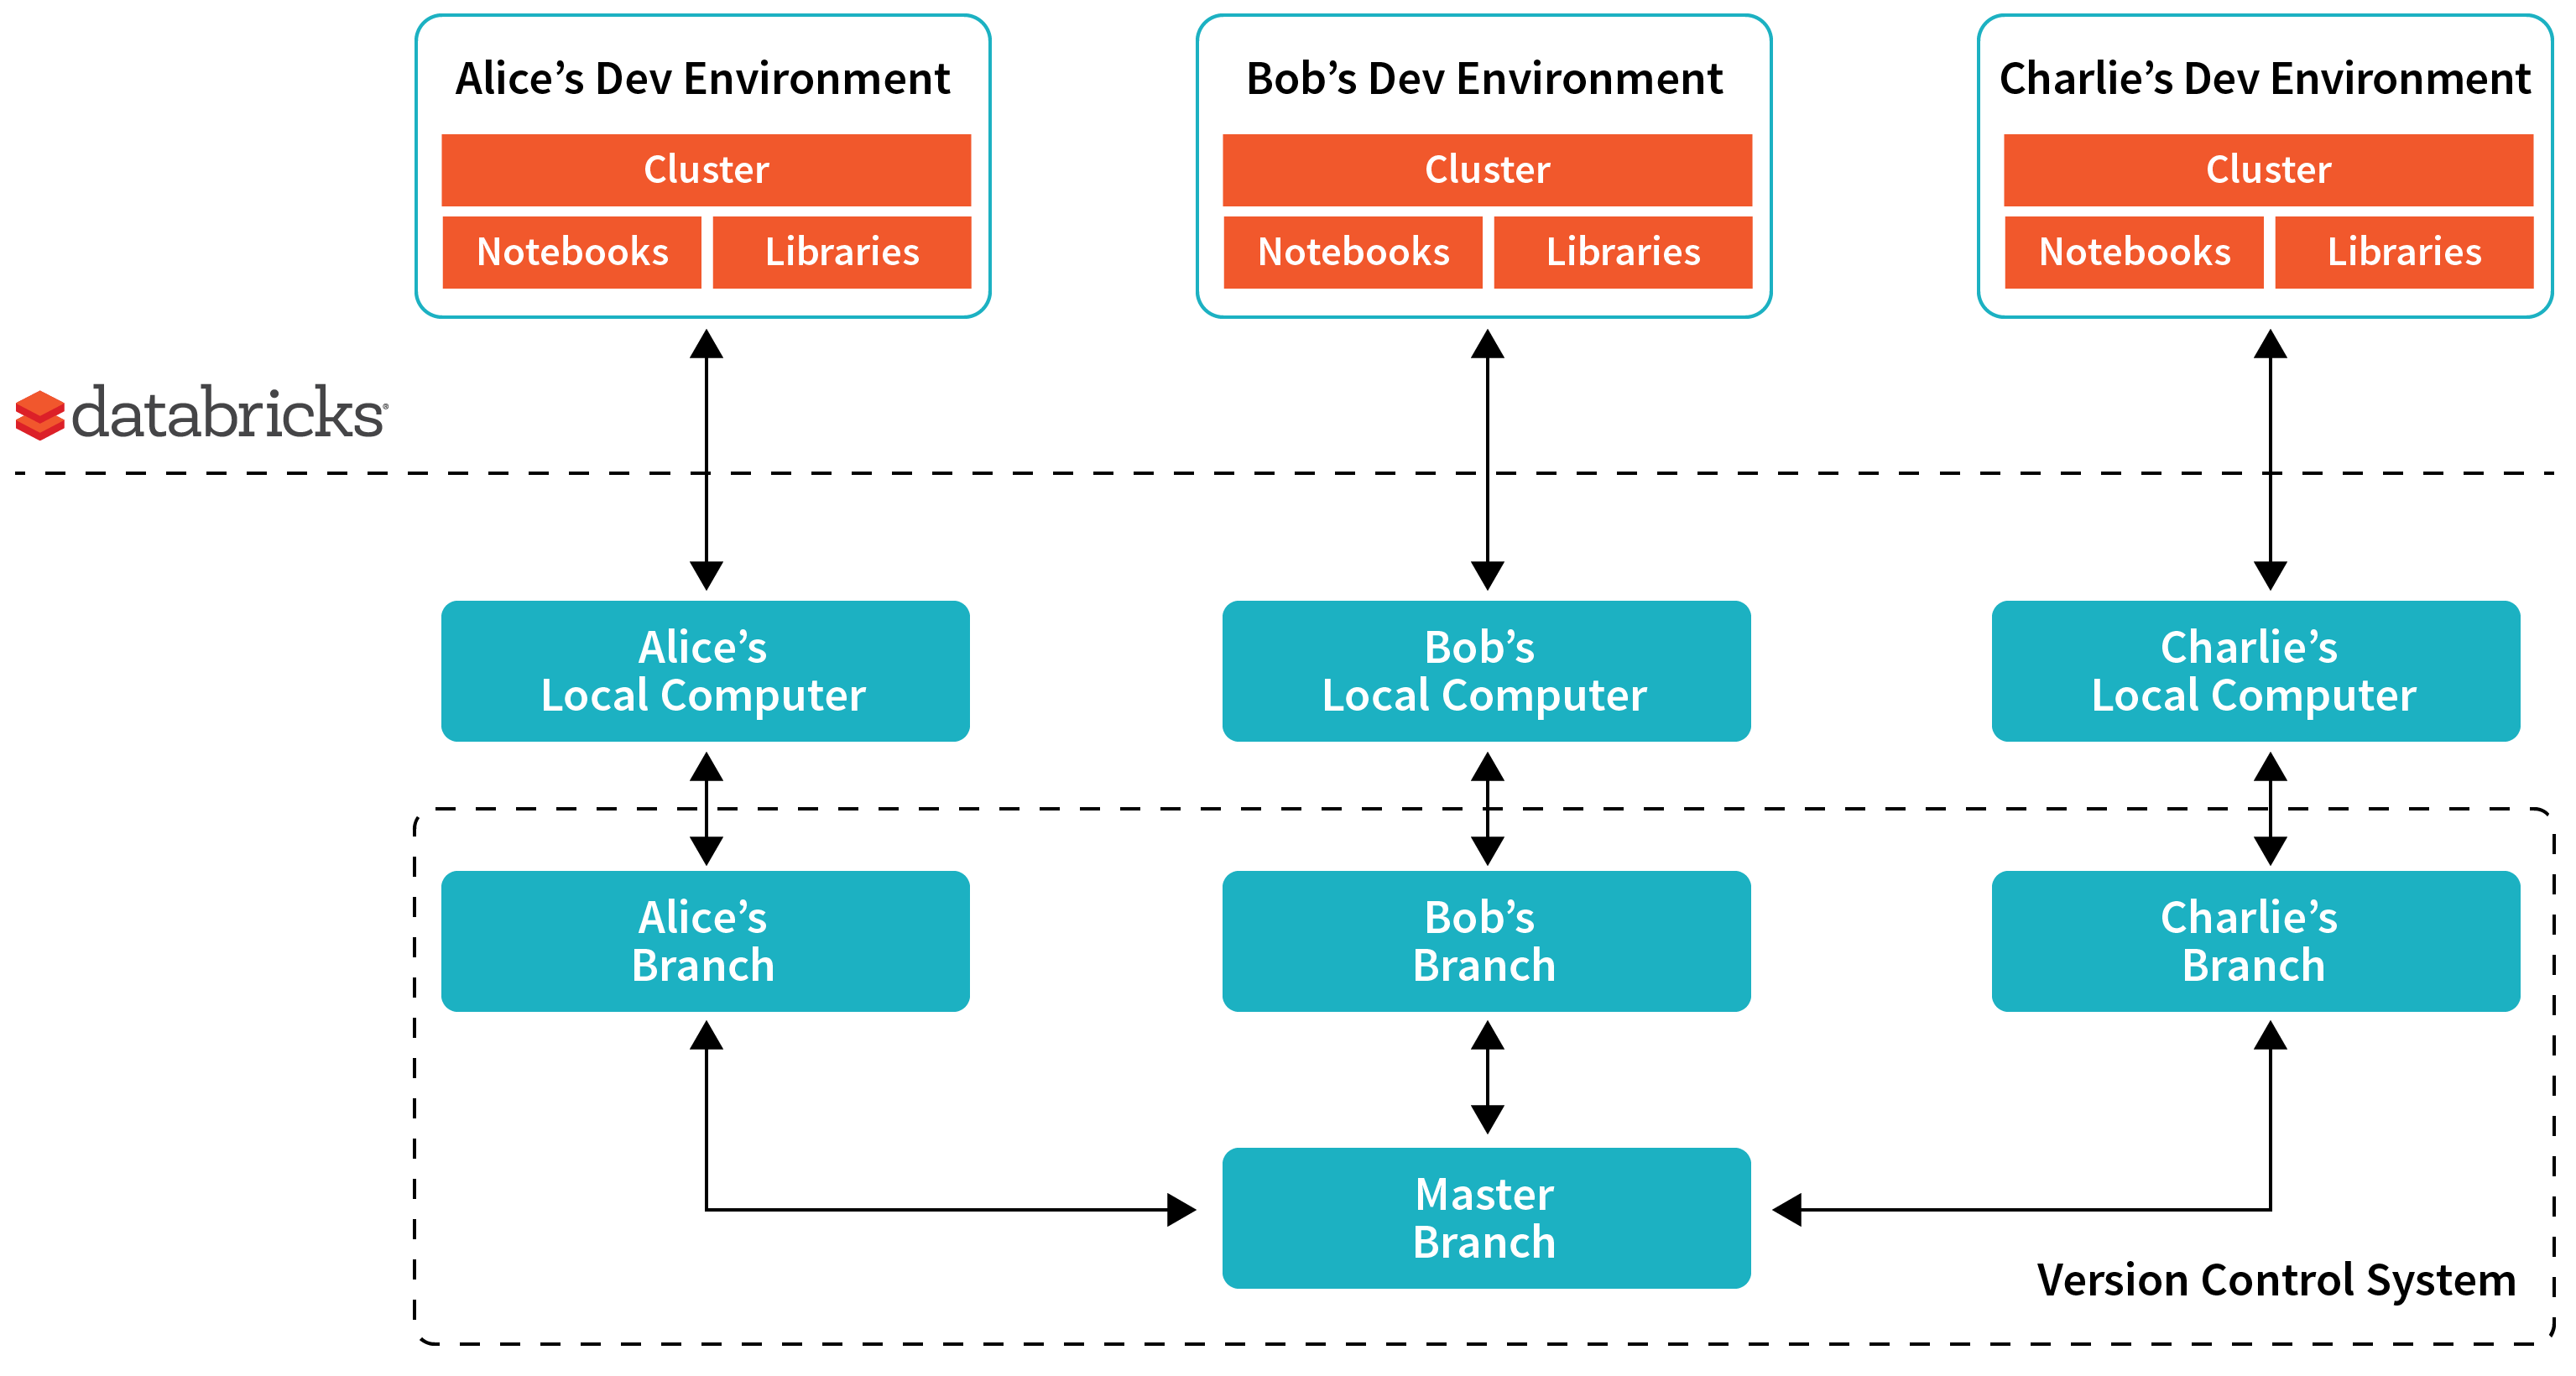
Setting up a dev environment in Databricks
To setup the dev environment, users can do the following:
- Create a branch and checkout the code to their computer.
- Copy the notebooks from local directory to Databricks’ workspace using the workspace command line interface (CLI)
- Copy the libraries from local directory to DBFS using the DBFS CLI
- Create a cluster using the API or UI.
- Attach the libraries in DBFS to a cluster using the libraries API
Iterative development
It is easy to modify and test the change in the Databricks workspace and iteratively test your code on a sample data set. After the iterative development, when you want to check in your changes, you can do the following:
- Download the notebooks
- Create a commit and make a pull request in version control for code review.
Productionize and write unit test
As you are moving from prototype to a mature stage in the development phase, modularizing code and unit testing them is essential. Following are some of the best practices you can consider during your development:
- Download some of the notebooks that has core logic into your computer and refactor them as Java / Scala classes or Python packages in your favorite IDE with dependency injection principles.
- Write unit tests for those classes.
- Keep the lightweight business logic that might change frequently in notebooks.
- Package the core logic as libraries and upload back to Databricks and keep iterating in notebooks by calling the core logic.
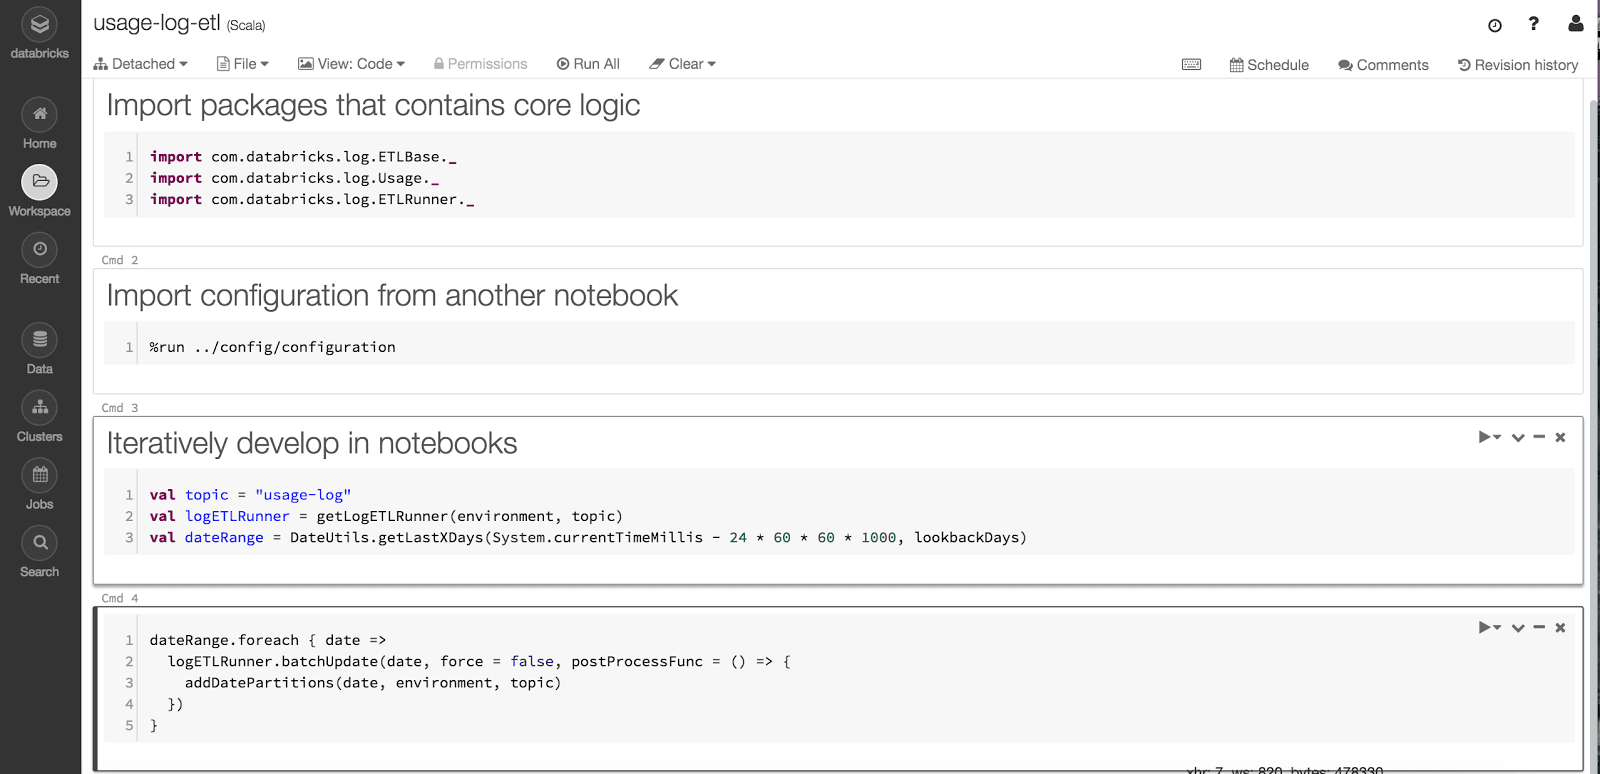
Why not package all code into a library?
Some developers prefer putting all code into a library and directly run with Databricks Jobs in staging and production. While you can do that, there are some significant advantages of using the hybrid approach of having core logic in libraries and using notebooks as a wrapper that stitches everything together:
- Parameterization: You can very quickly change the input parameters in a notebook and run your core logic in libraries. Just for a configuration change, you don’t need to compile your jar and re-upload and run them again.

Figure 5: Easily parameterize and run your data pipeline.
- Simple chaining: You can chain a simple linear workflow with fail fast mechanisms. The workflow could be chaining different code blocks from the same library or chaining different libraries too.
- Easy performance analysis: You can easily look at the performance of different stages by having the code broken down into different cells and looking at the time taken for each cell to execute as shown in Figure 6.
- Visual troubleshooting of intermediate stages: You can easily look at the intermediate results instead of searching through a lot of logs for your debug statements.
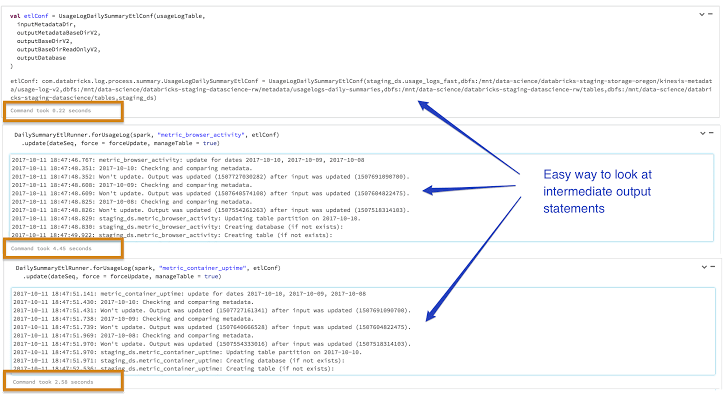
Figure 6: Leveraging notebooks to easily look at output statements and performance of intermediate stages.
- Return results from the job: You can programmatically get the exit status of the notebook and take corresponding action in your workflow externally.

Continuous integration and build
Once the code is properly refactored as libraries and notebooks, the build server can easily run all the unit tests on them to make sure the code is of high quality. The build server will then push the artifacts (libraries and notebooks) to a central location (Maven or cloud storage like S3).
Pushing data pipeline to staging environment
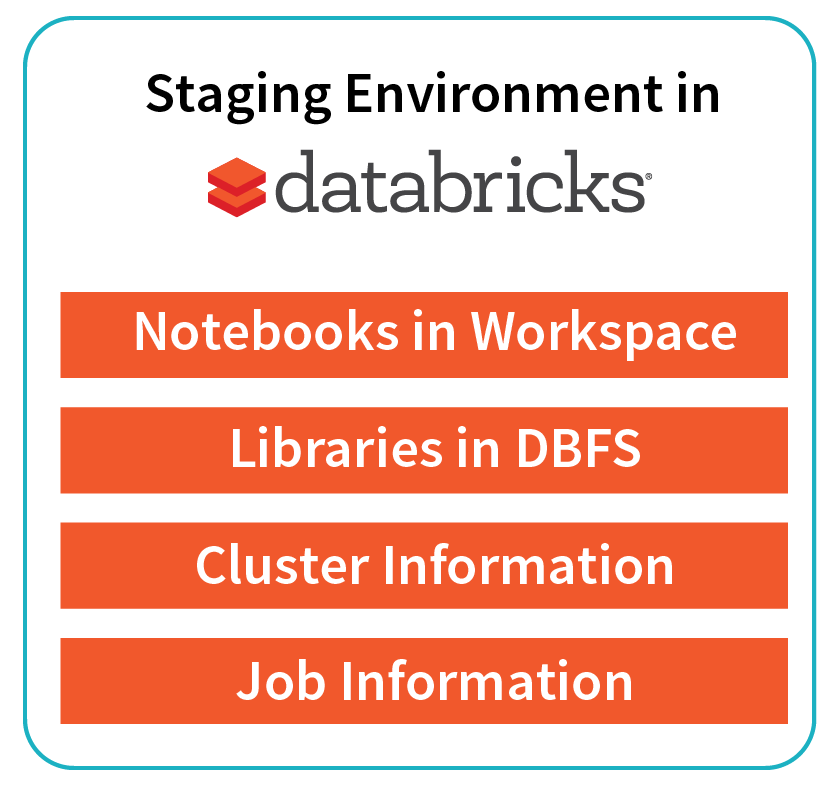
Pushing a data pipeline to a staging environment in Databricks involves the following things:
- Libraries: The build server can programmatically push the libraries to a staging folder in DBFS in Databricks using the DBFS API.
- Notebooks: The build server can also programmatically push the notebooks to a staging folder in the Databricks workspace through the Workspace API.
- Jobs and cluster configuration: The build server can then leverage the Jobs API to create a staging job with a certain set of configuration, provide the libraries in DBFS and point to the main notebook to be triggered by the job.
- Results: The build server can also get the output of the run and then take further actions based on that.
Blue/green deployment to production environment
A production environment would be very akin to the staging environment. Here we recommend doing the blue/green deployment for easy rollback in case of any issues. You can also do an in-place rollout.
Here are the steps required to do a blue/green deployment:
- Push the new production ready libraries to a new DBFS location.
- Push the new production ready notebooks to a new folder under a restricted production folder in Databricks’ workspace.
- Modify the job configuration to point to the new notebook and library location so that the next run of the job can pick them up and run the pipeline with the new code.
Figure 8: Code snippet that demonstrates the blue/green deployment.
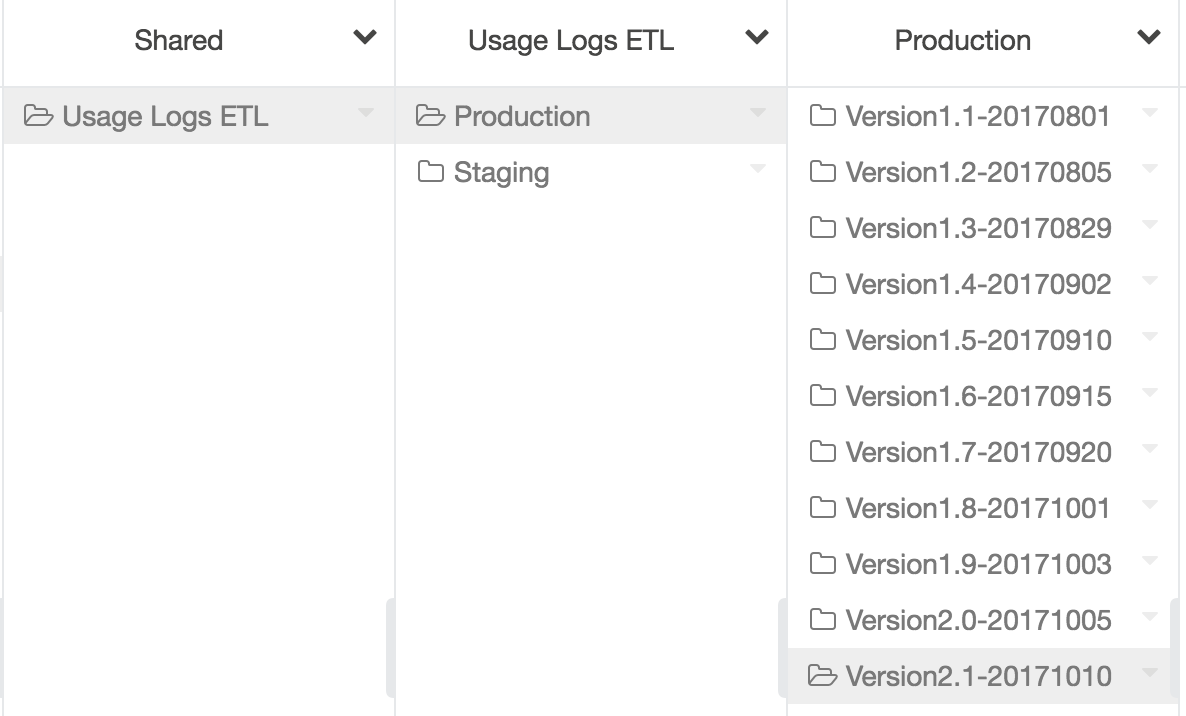
Figure 9: A production folder that has different sub-folders for each production push. The production folder has access only to very few people.
Conclusion and Next Steps
We walked through the different stages of CI/CD for a data pipeline and the key challenges. There are a myriad of ways best practices of CI/CD can be followed. We outlined a recommended approach with Databricks that we internally follow.
Different users have adopted different variants of the above approach. For example, you can look at how Metacog continuously integrate and deliver Apache Spark pipelines here.
If you are interested in adopting Databricks as your big data compute layer, sign up for a free trial of Databricks and try it for yourself. If you need a demo of the above capabilities, you can contact us.
Get the latest posts in your inbox
Subscribe to our blog and get the latest posts delivered to your inbox.