Building a Cybersecurity Lakehouse for CrowdStrike Falcon Events Part II
by Aemro Amare, Alex Ott and Kristin Waters
Visibility is critical when it comes to cyber defense – you can't defend what you can't see. In the context of a modern enterprise environment, visibility refers to the ability to monitor and account for all endpoint devices, network communications, and key assets. Event logs allow security teams to build a baseline of normal, expected behavior and to build rules that identify an anomalous activity. That is, of course, assuming these logs are collected and searchable in the first place. This important piece is often overlooked. Fortunately, with the power of the Databricks Lakehouse Platform, it is easy to build a scalable, robust, and cost-effective cybersecurity analytics program.
In Part I of this series, we went through the process of setting up a Cybersecurity Lakehouse that allowed us to collect and operationalize CrowdStrike Falcon log data. In this blog post (Part II), we will explore specific use cases, including data exploration, automated enrichment, and analytic development. At the end of this blog you will be equipped with some sample notebooks that will provide you with general guidance and examples to help kickstart your threat detection and investigation program.
The data that we will be investigating is a set of CrowdStrike Falcon logs consisting of production data collected from enterprise network endpoints. Due to the sensitive nature of this information, certain details have been masked to preserve the security and confidentiality of the data. This data was collected continuously over the period of several weeks and is reflective of typical workday usage patterns.
Why Databricks for CrowdStrike Data?
With Databricks we can easily ingest, curate, and analyze CrowdStrike logs at scale. And with Databricks' robust integrations framework, we can further enrich these logs with context from additional sources, transforming raw data into more meaningful insights. Enrichment allows us to more easily correlate security events, prioritize incidents, reduce false positive rates, and anticipate future security threats.
Another benefit of leveraging Databricks for CrowdStrike logs is that it supports historical analysis at scale. Traditionally, structuring, managing, and maintaining log data has been an inefficient and costly process. With the inexpensive object storage and open format model of the Databricks Lakehouse architecture, organizations have the ability to retain these datasets for much longer periods of time. Access to highly-enriched historical security data allows organizations to assess their security posture over time, build enhanced detection and response capabilities, and perform more proficient threat hunt operations. In addition, the Databricks platform is equipped with advanced out-of-the-box tools that help to build an advanced security lakehouse in a cost-effective and efficient way.
Methodology
Data collection and ingestion is just the beginning in our quest to build out an effective cybersecurity analytics platform. Once we have the data, our next step is to explore the data in order to uncover patterns, characteristics, and other items of interest. This process, commonly referred to as User and Entity Behavior Analytics (UEBA), involves monitoring the behavior of human users and entities within an organization.
We begin by performing some basic exploratory data analysis in order to identify key variables and relationships. CrowdStrike captures hundreds of event types across endpoints. We classified these events into the following types of activity:
- User Activity
- Network Activity
- Endpoint Information & Activity (including file activity and process management)
We assigned each activity a set of corresponding Event Types. Here is our sampling of the mapping:
| Activity | Event Type | Event Content |
|---|---|---|
| User Activity | Useridentity | identity events, including system identities, of processes running on a device. |
| userlogon | user logins - from which device, what time, IP information, etc. We'll use this information later to show how to detect suspicious logins. | |
| Network Activity | NetworkListenIP4 & NetworkListenIP6 | listen ports on the device with the CrowdStrike agent installed. Execution of some software that accepts incoming connections could increase the attack surface. |
| NetworkConnectIP4 & NetworkConnectIP6 | Connections from a device to a remote endpoint - local & remote IP addresses, ports & protocols. We can use this information to match connections against known IoCs. | |
| Endpoint Activity | Fileopeninfo | Opened files and the process that opened the file |
| hostinfo | Specific host information about the endpoint Falcon is running on | |
| Processrollup2 | Process details that are running or have finished running on a host and contains. |
Data Normalization and Enrichment
Before we dive into building analytics we first need to perform some preliminary normalization and enrichment. In this case, normalization refers to the reorganization of the data to limit redundancy, format data entries, and improve the overall cohesion of the entry types. This is an important step - proper data cleansing and normalization leads to more efficient use of the data. For example, we will want to have correct data types to perform range queries and comparisons on timestamps, ports, and other objects.
CrowdStrike Falcon logs are json format. Furthermore, there is variance among the timestamp encodings; some are encoded as long and some as double. There are also more than 300 different event types, each with different schemas and fields . In order to easily manage the normalization process we have coded a simple profiler that identifies the data types and programmatically generates the code that performs normalization of non-string fields.
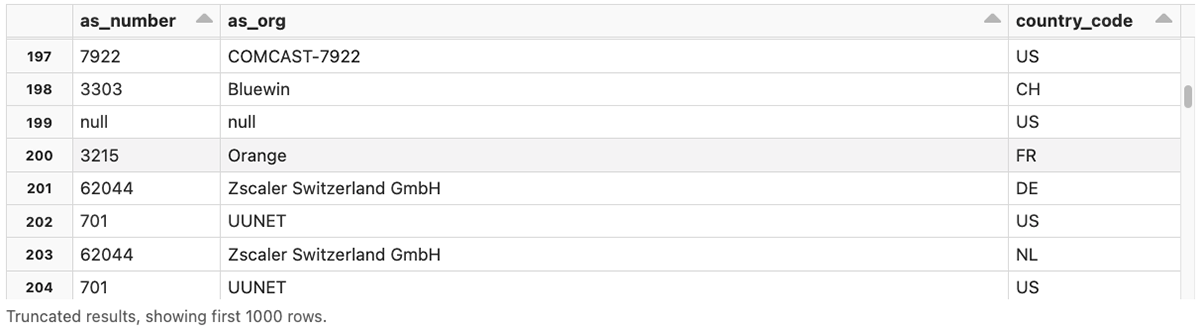
Another big advantage of leveraging Databricks in this context is that we can easily enrich data with information from external and internal sources. For this analysis, we included geographic and network location information using MaxMind's GeoIP and Autonomous System (AS) databases. This could be further expanded to include data from other sources as well. Similarly, we added user-defined functions to calculate network Community IDs that allowed us to correlate data between multiple tables as well as identify "stable" network communication patterns (meaning that the same device regularly reached the same network endpoints).
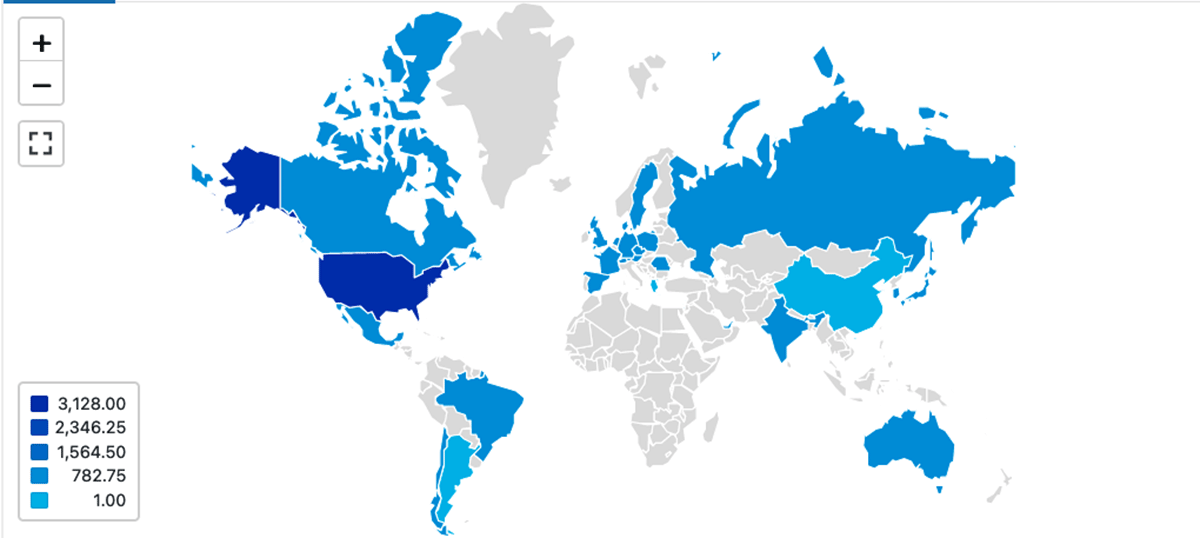
Geographic enrichment gives us visibility into which geographic locations people are logging in from. We also have the added capability of selecting different levels of granularity (e.g. country vs city):
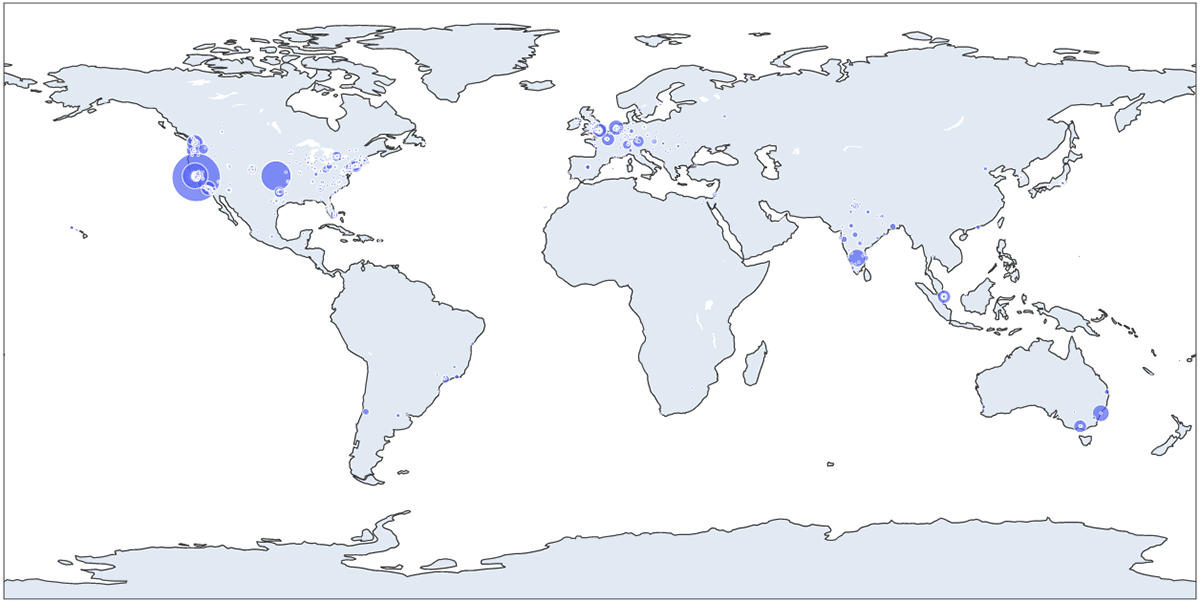
In this example we've used the third-party library Plotly to look at the data with a finer granularity:
Data Layout
CrowdStrike Falcon logs can grow easily to petabytes, having a proper data layout and data compaction is critical to get faster query response time. On databricks we can enable optimizeWrite to automatically compact the parquet files created in delta tables.
Delta tables can be optimized further with Data Skipping and Z-Order. Data Skipping relies on having correct data types, like, int and timestamps, and allows significantly decrease data read time. Optimize with Z-Order to improve the data layout that will further help to skip scanning and reading data which are not relevant for the query we are running.
Building A Baseline
Once we have identified our data of interest, the next step is to build a data baseline to serve as the comparison benchmarks. We can easily generate a data profile directly within our notebook using the Databricks summarize command:
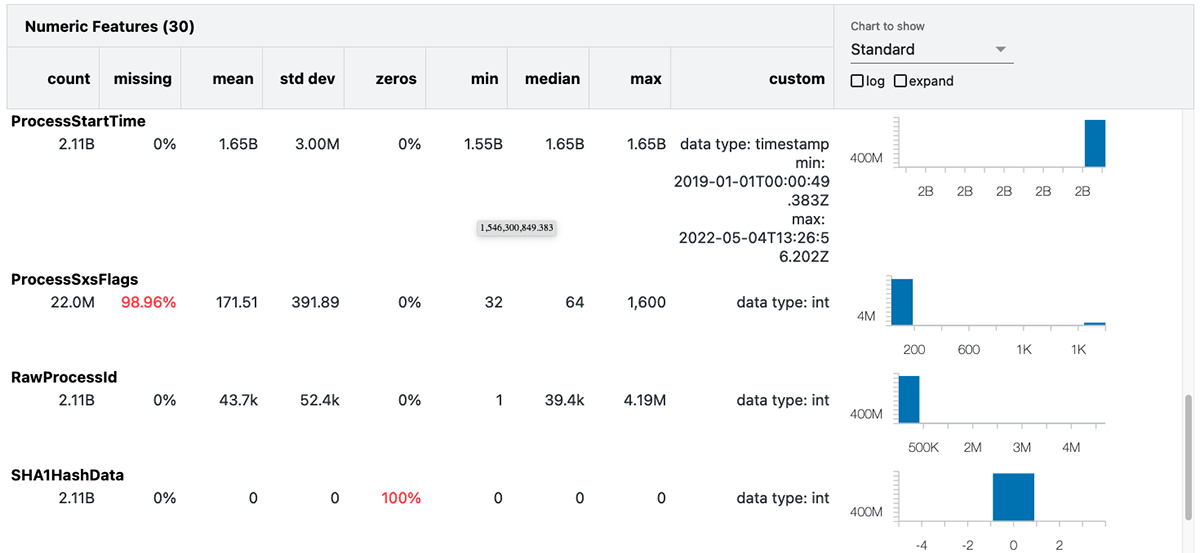
This summary includes several useful statistics and the value distributions for each attribute. In the above example, we've generated the summary statistics for processrollup2.
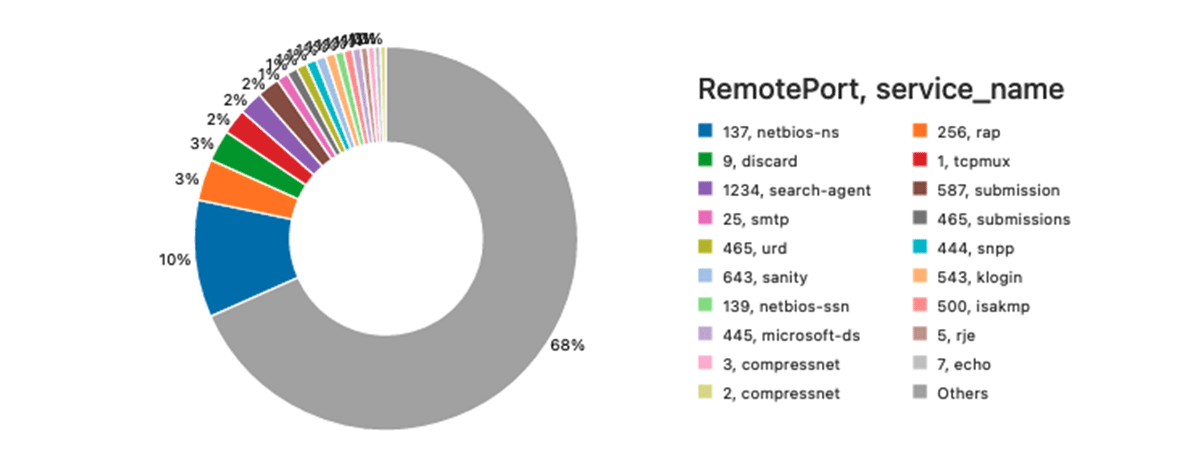
We're also interested in learning about the most frequently used remote ports (outside of "standard" ports such as HTTPS). This is a simple query:
The result of the above query can be visualized on Databricks notebook like this.
Getting Insights From Enriched Data
With our data ingestion and enrichment pipeline in place, what's next? We have a lot of options depending upon our objective, ranging from attack pattern analysis, predictive analytics, threat detection, system monitoring, risk scoring, and analyzing various security events. Here below we will show some examples of cybersecurity analytics.
Before we start, we need to understand how we can link different events together. For example most event types have a sensor id(aid) that identifies installed agents at endpoints, and ContextProcessId that is a reference to the TargetProcessId column in the ProcessRollup2 table.
1. Finding nodes that have potentially vulnerable services running
Services that implement vulnerable versions of Microsoft Remote Desktop Protocol (RDP), Citrix services, and NetBios are often targeted by attackers looking to gain access to an endpoint. There are dozens of documented viruses that exploit NetBios processes running on port 445. Similarly, an open RDP port 3389 may lead to denial of service attacks.
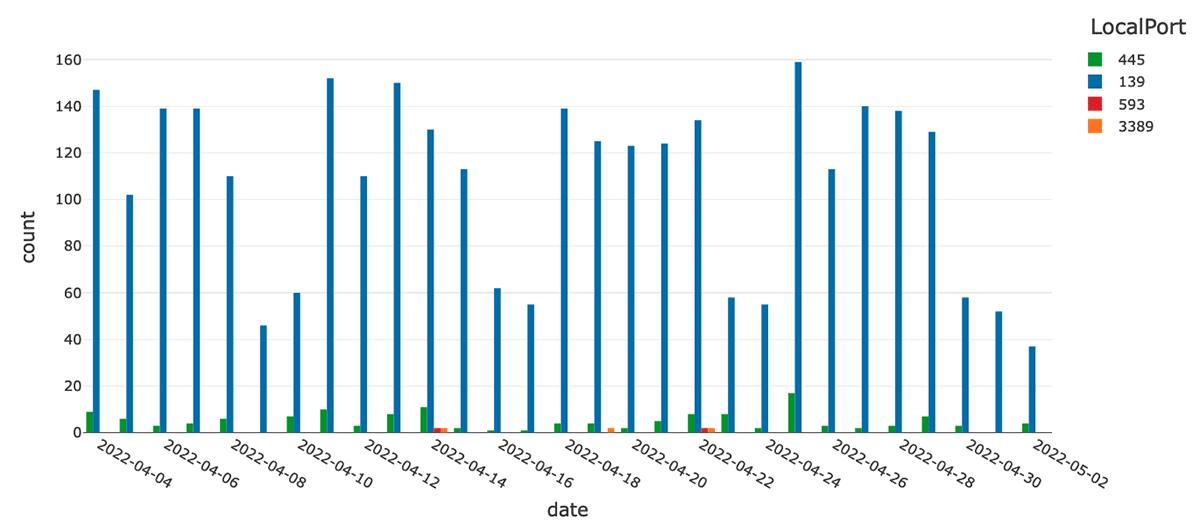
The CrowdStrike Falcon agent logs information about processes that are listening on ports as NetworkListenIP4 and NetworkListenIP6 events. We can use this information to identify processes that are listening on ports traditionally attributed to potentially vulnerable services. Let us first examine the number of events that are attributed to these specific ports per day in the last 30 days with the following query:
As we can see on the graph, the majority of listen events are attributed to the NetBios (although we do have a chunk of RDP-related events):
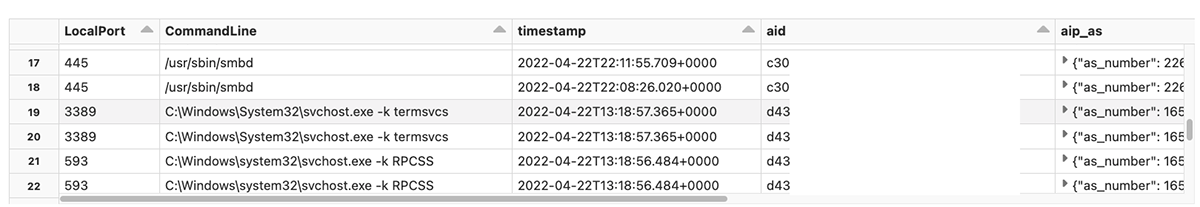
At this point we can examine more detailed data about the processes that were listening on these ports by joining with the processrollup2 table. We can leverage the TargetProcessId field to link an activity to an endpoint process and use the process ID to link with other events. Ultimately, we can build a hierarchy of processes by joining on the ParentProcessId column.
2. Information about executed applications
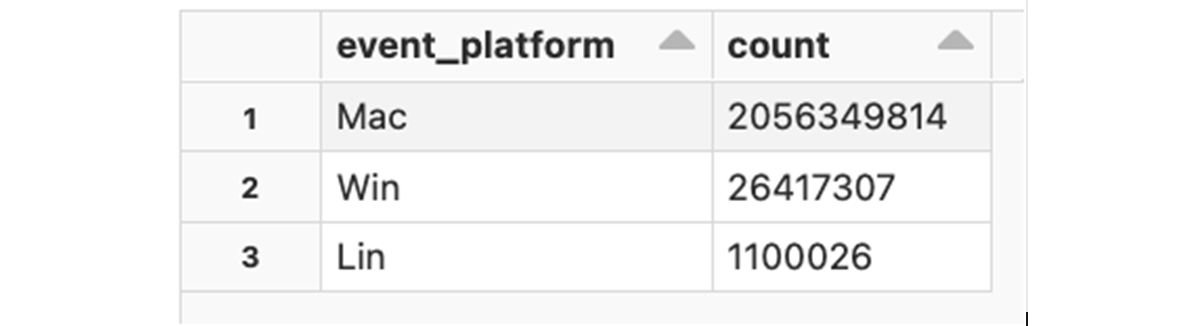
Information about program execution is logged as processrollup2 events. These events contain detailed execution profiles, including the absolute path to the program executable, command-line arguments, execution start time, the SHA256 of the application binary, platform architecture, etc. We'll start with a simple query that counts the number of application executions per specific platform:
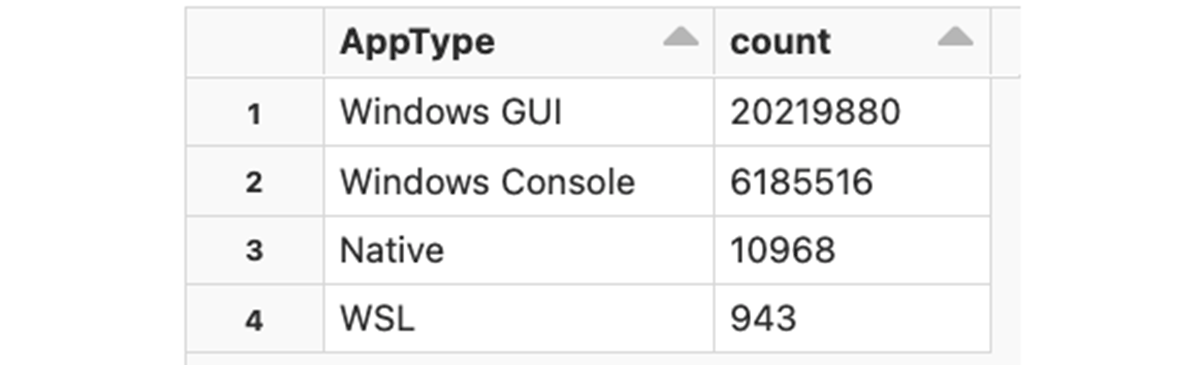
Some platform types include additional data about the application type (e.g.is it a console application or a GUI application, etc). Let's examine the application types that we see used on MS Windows:
As expected, the majority of executions are GUI applications:
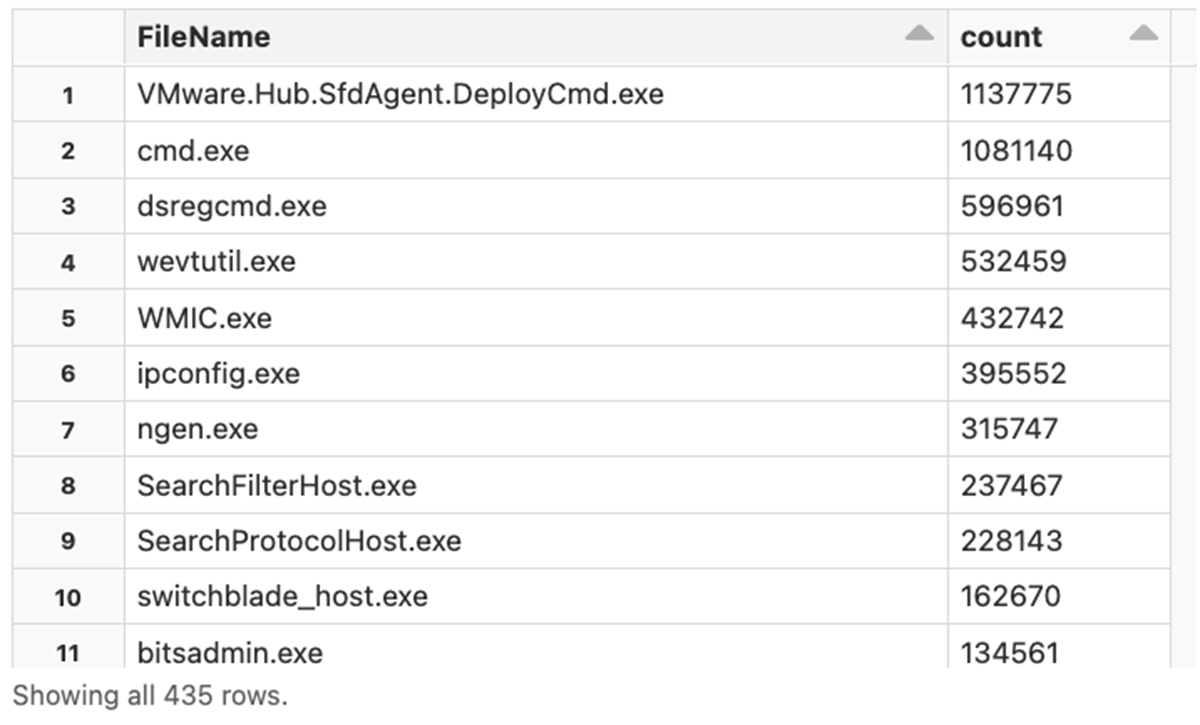
We can dig even deeper into a specific category. Let's identify the most popular console applications on Windows:
3. How are users logging into Windows?
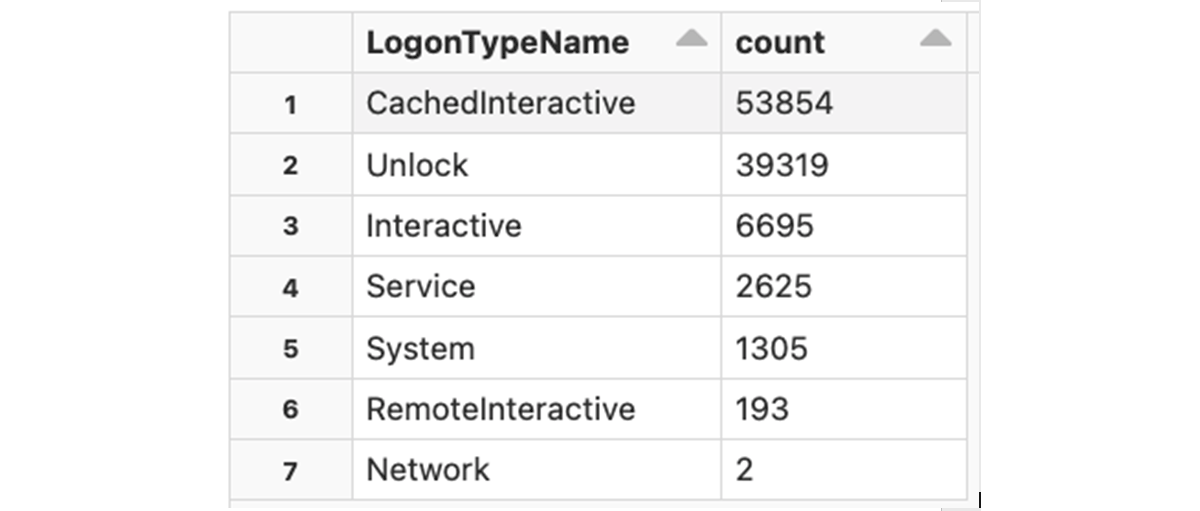
There are multiple ways to login into a Windows workstation - interactive, remote interactive (via RDP), etc. Each logon event logged by the CrowdStrike Falcon has a numeric LogonType flag that contains a value as described in Microsoft's documentation. Let's examine the logon types and their frequency:
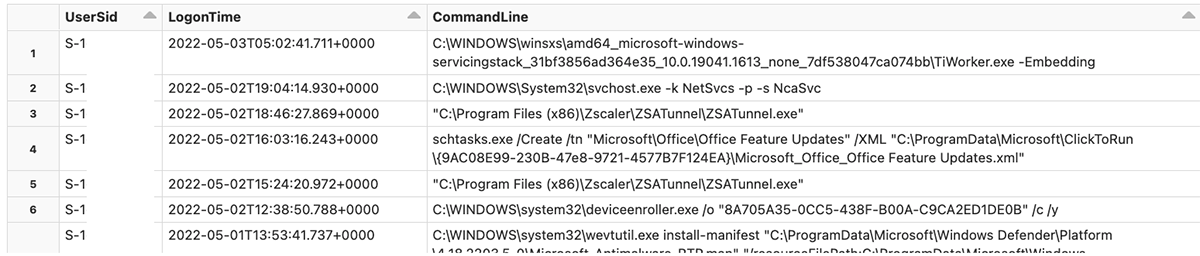
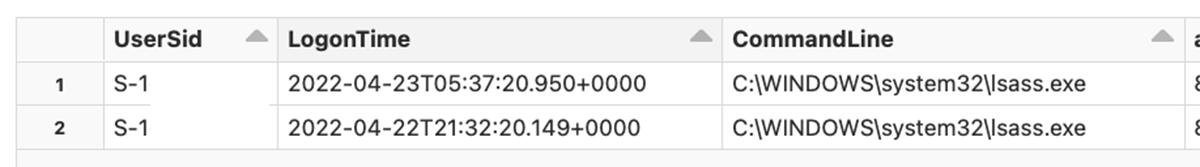
Now let's look into more detail - which users are logging in via RDP, via Network, or as System users? We'll start with System users - let's see what processes are associated with these logon events:
Similarly, we can look into users who are logging in via network:
4. Matching connection data against known Indicators of Compromise(IoCs)
Information extracted by previous queries is interesting, but we are really interested to see if any of our endpoints were resolving names of any known Command & Control (C2) servers. The information about such servers could be obtained from different sources, like Alien Labs® Open Threat Exchange® (OTX™), or ThreatFox. For this example we're using data from the specific threat feed - data is exported as CSV, and imported into Delta Lake. This dataset contains multiple types of entries, like, 'hostname' to specify exact host name, or 'domain' for any hostname under a registered domain, and we can use that information against the table that tracks DNS requests (the DnsRequest event type). The query is relatively simple, we just need to use different columns for different types of entries:
- IoC entries of type 'hostname' should be matched against the DomainName column of the DNS requests table.
- IoC entries of type 'domain' should be matched against the 'DomainName_psl.registered_domain' column that was added by the enrichment that uses Public Suffix List to extract the registered domains.
And when we find any match against the IoCs, we extract the information about the client machine (aid, aip, …) and the process that made that DNS request (CommandLine, ProcessStartTime, …)
We don't have any screenshots to show here because we don't have any match :-)
What's Next?
In this blog we demonstrated how you can leverage the Databricks Lakehouse Platform to build scalable, robust, and cost-effective cybersecurity analytics. We demonstrated the enrichment of CrowdStrike Falcon log data and provided examples of how the resulting data can be used as part of a threat detection and investigation process.
In the following blog in this series we will deep-dive into the creation of actionable threat intelligence to manage vulnerabilities and provide faster, near-real-time incident response using CrowdStrike Falcon Data. Stay tuned!
We have also provided some sample notebooks [1] [2] that you can import into your own Databricks workspace. Each section of the notebooks has a detailed description of the code and functionality. We invite you to email us at [email protected]. We look forward to your questions and suggestions for making this notebook easier to understand and deploy.
If you are New to Databricks, please refer to this documentation for detailed instructions on how to use Databricks notebooks.
Get the latest posts in your inbox
Subscribe to our blog and get the latest posts delivered to your inbox.