Cybersecurity Lakehouses Part 2: Handling Ingestion Delays
Lessons learned in the field: How to spot and handle delays in your cybersecurity log data ingestion pipeline
by Derek King
In this four-part blog series “Lessons learned building Cybersecurity Lakehouses,” we are discussing a number of challenges organizations face with data engineering when building out a Lakehouse for Cybersecurity data, and offer some solutions, tips, tricks, and best practices that we have used in the field to overcome them.
In part one, we began with uniform event timestamp extraction. In this second part, we will look at how to spot and handle delays in log ingestion, which is essential to maintaining effective security operations.
By the end of this blog, you will have a solid understanding of some of the issues faced and several techniques we can use to monitor and report on data ingestion lag.
Why is data ingestion important?
Timely, accurate, and searchable log data is critical in Security Operations. Analysts require near real-time visibility into security events and incidents. Incident responders are often required to take evasive action to avoid or mitigate further damage to environments. Compliance and assurance functions are legally required to demonstrate data integrity and have regulatory compliance mandates that require timely reporting of security incidents.Without monitoring for data ingestion lag, how can each of these security functions know they are providing the required service?
Challenges with Data Ingestion Delays
Data ingestion may be delayed for many reasons, ranging from traditional infrastructure-type issues to delays caused by the modern data stack and its multi-hop ingestion route(s).
Traditional Infrastructure
In a traditional non-SaaS type environment, log sources are often generated by systems either on-premises or in cloud hosting instances, often with their own log forwarding agents installed locally. Below are some examples of issues that may arise to cause delays in a more traditional architecture:
- Network outages
- Receiving system(s) resource starvation
- Forwarding and middleware tier failures and resource starvation
Modern Cloud Stack
Many SaaS providers allow either a scheduled or streaming export of log files from their products for their customers to ingest into other analytics products. While streaming products and SaaS services exist, many organizations still choose to land these log files into cloud object storage before ingesting them into a cyber analytics engine. This creates a multi-hop, time-delayed, and almost batch-like ingestion pattern. It is a by-product of how modern architectures often interoperate regarding log files. Below are some examples of issues that may arise when ingesting SaaS generated logs;
- SaaS provider log export failures
- SaaS provider log export delays
- Cloud storage bucket write failures
- Receiving system failure to recognize newly written files
Monitoring for Ingestion Issues
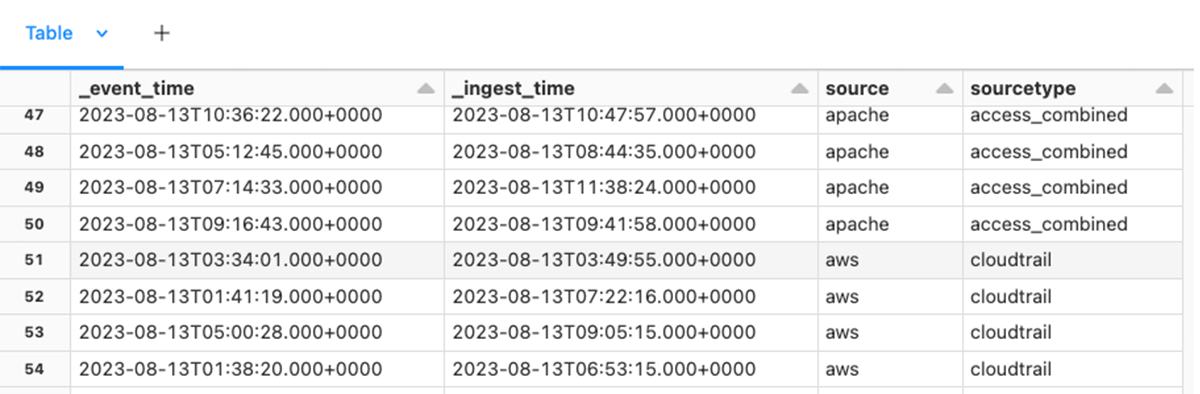
If you have read part one of this blog series, you will know that we recommend generating two metadata fields at ingestion time. _event_time and _ingest_time.
Capturing these two columns at the bronze layer of the medallion architecture allows us to monitor for delays in receiving and processing log data.
Two main questions must be answered:
- Is data coming in from each log source at the expected rate?
- Is data coming in from each log source at the expected frequency?
The examples below show how these can be accomplished.
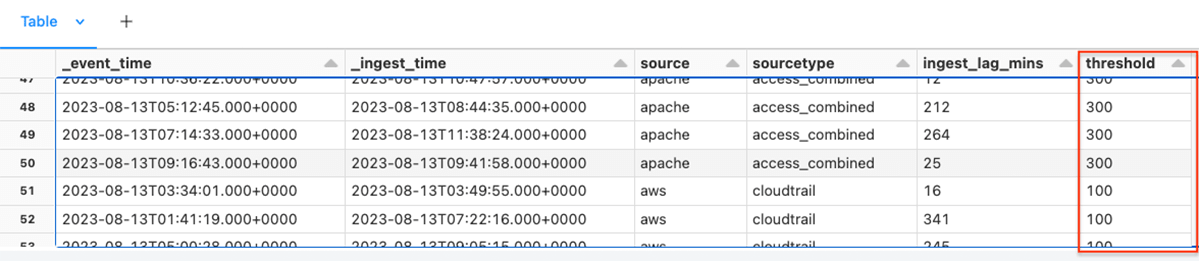
The following dataframe includes both timestamps used to generate ingestion delay monitoring.
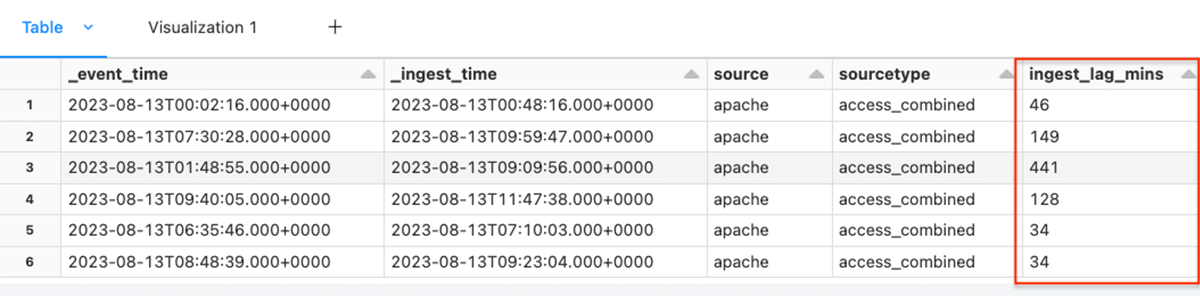
For each row in the dataframe we calculate the number of minutes each record was delayed and write the result to a new column ingest_lag_mins.
With the lag column created, it is very simple to create a visualization using the visualization editor.
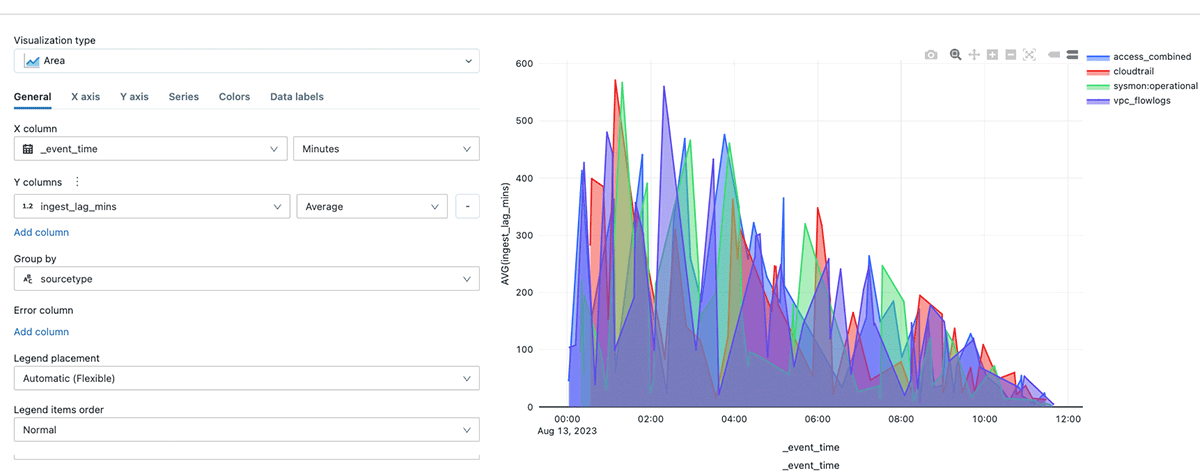
The image above shows the average lag in minutes over time by sourcetype.
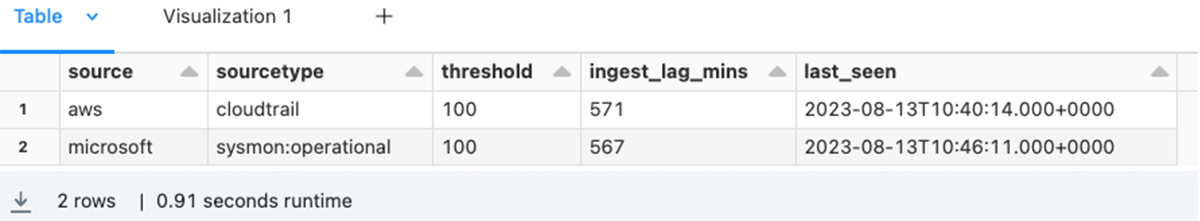
This is a good starting point for a dashboard. However, we should go ahead and create reports that show exceptions that need to be investigated. To that end, we can add an expected threshold against each log source.
Finally, report on those log sources that are performing outside of the threshold values, or optionally multiples of threshold values.
In the command above, we defined a THRESHOLD_MODIFIER to remove excess noise, and created a new column last_seen using the PySpark function MAX, and finally filtered only for records with an ingest lag time greater than the threshold.
Monitoring for expected frequency
Log sources or reporting hosts are expected to send data on a semi-frequent basis. Depending on the activity levels, the frequency can vary. There are many strategies for identifying sources not logging on the expected frequency. In this example, we show a simple way to report on sources not logging within an expected time frame. Other possible strategies include
- Adapting the above and looking for multiples of threshold exceeded within a time window
- Storing a dedicated per log source threshold for missing sources and reporting by exception
- Creating a baseline or normal frequency, and reporting based on a multiple of standard deviation
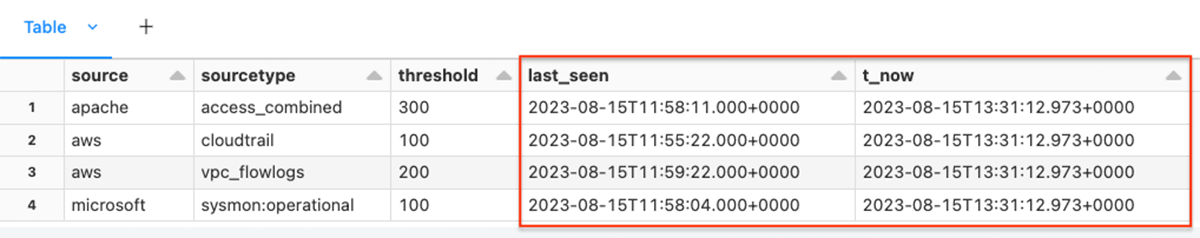
In the command above we create two new columns last_seen and t_now, and aggregate by the source and sourcetype to give us the latest event received for each log source.
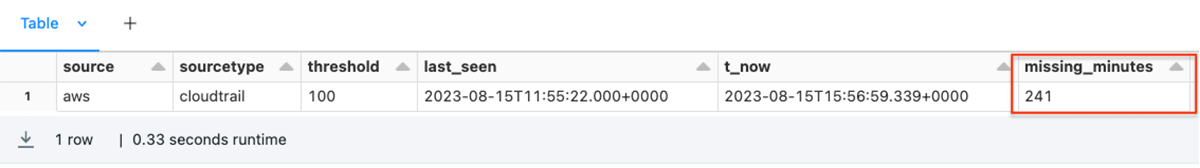
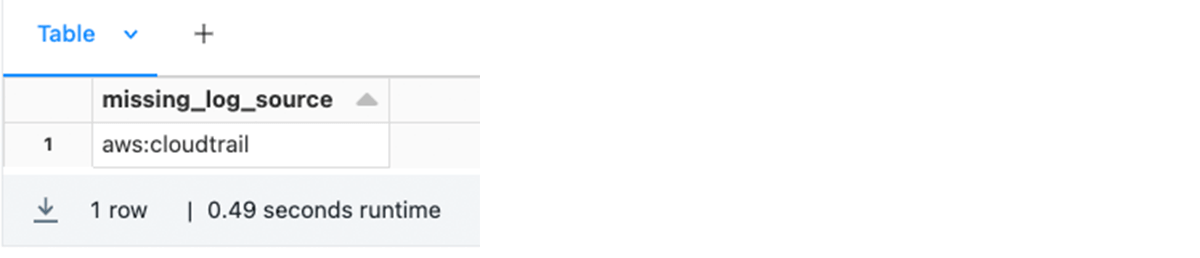
Alternatively we may concatenate the source and sourcetype columns and report a simple list;
If you are using Databricks SQL (DB SQL), we recommend that you create a dashboard to revisit often, and alerts for missing and delayed log sources. Another possibility is to schedule a notebook run using the Databricks Workflows functionality and email results for a run.
Tips and best practices
During this blog, we have explored a few options to identify and report on delayed and missing log sources. There are other ways to make this more effective and it is left to the interested reader. However, some initial thoughts:
- Bucket events into time windows and calculate the rolling average delays to provide a normal delay by log source.
- Store a per log source ‘missing’ property and report only on those sources exceeding the missing value.
- Add dashboards to visualize all log sources with dropdowns to select specific sources
Conclusion
Being aware of data ingestion lags is critical to many parts of security and assurance functions and, therefore, must be monitored and resolved promptly. Without proper controls in place, an organization may have blind spots and fail to meet compliance mandates.
Get in Touch
If you are interested to learn more about how Databricks cyber solutions can empower your organization to identify and mitigate cyber threats, reach out to [email protected] and check out our Lakehouse for Cybersecurity Applications webpage.
Get the latest posts in your inbox
Subscribe to our blog and get the latest posts delivered to your inbox.