How to Build Digital Twins for Operational Efficiency
Accelerate real-time insight and predictive maintenance with the new Digital Twin Solution Accelerator
by Naïm Achahboun, Joshua Green, Matteo Landrò and Debabrata Roy Chowdhury
- Learn how to build scalable, real-time Digital Twins using Zerobus Ingest, part of Lakeflow Connect, to stream live telemetry data directly into the lakehouse.
- Explore an end-to-end Solution Accelerator that demonstrates how to model, simulate, and analyze complex systems with Databricks AI and analytics.
- See how Databricks unifies ingestion, modeling, and real-time analytics to detect anomalies, reduce downtime, and optimize operations at scale.
Across manufacturing and industrial operations, organizations are adopting Digital Twins to improve efficiency, predict equipment failures, and optimize production in real-time.
This new Digital Twin Solution Accelerator provides an end-to-end framework for building, visualizing, and analyzing these systems using AI and real-time analytics, helping teams reduce downtime, improve product quality, and drive smarter decision-making. You can deploy scalable Digital Twin solutions on Databricks using Zerobus Ingest, part of Lakeflow Connect, a managed service that pushes event data directly to the lakehouse, you can deploy your own Digital Twin solution at scale with Databricks.
What Are Digital Twins?
In our implementation, a Digital Twin combines two key ingredients:
- A virtual representation of a physical asset, system, or process
- Real-time, contextual data from sensors and other sources
With this live digital replica, we can monitor physical equipment or abstract processes in real time, simulate and validate changes, and perform advanced predictive maintenance without changing the system itself.
In the context of manufacturing, Digital Twins are central to driving the Industry 4.0 revolution. By integrating IoT, AI, and real-time analytics, they not only reduce downtime and boost productivity but also enable continuous safety.
These concepts also show great promise in other areas, such as modeling organizational dynamics and understanding the processes that drive decision-making. In this blog, we will focus on the manufacturing application of Digital Twins.
Example scenario: Ball Bearing Manufacturing
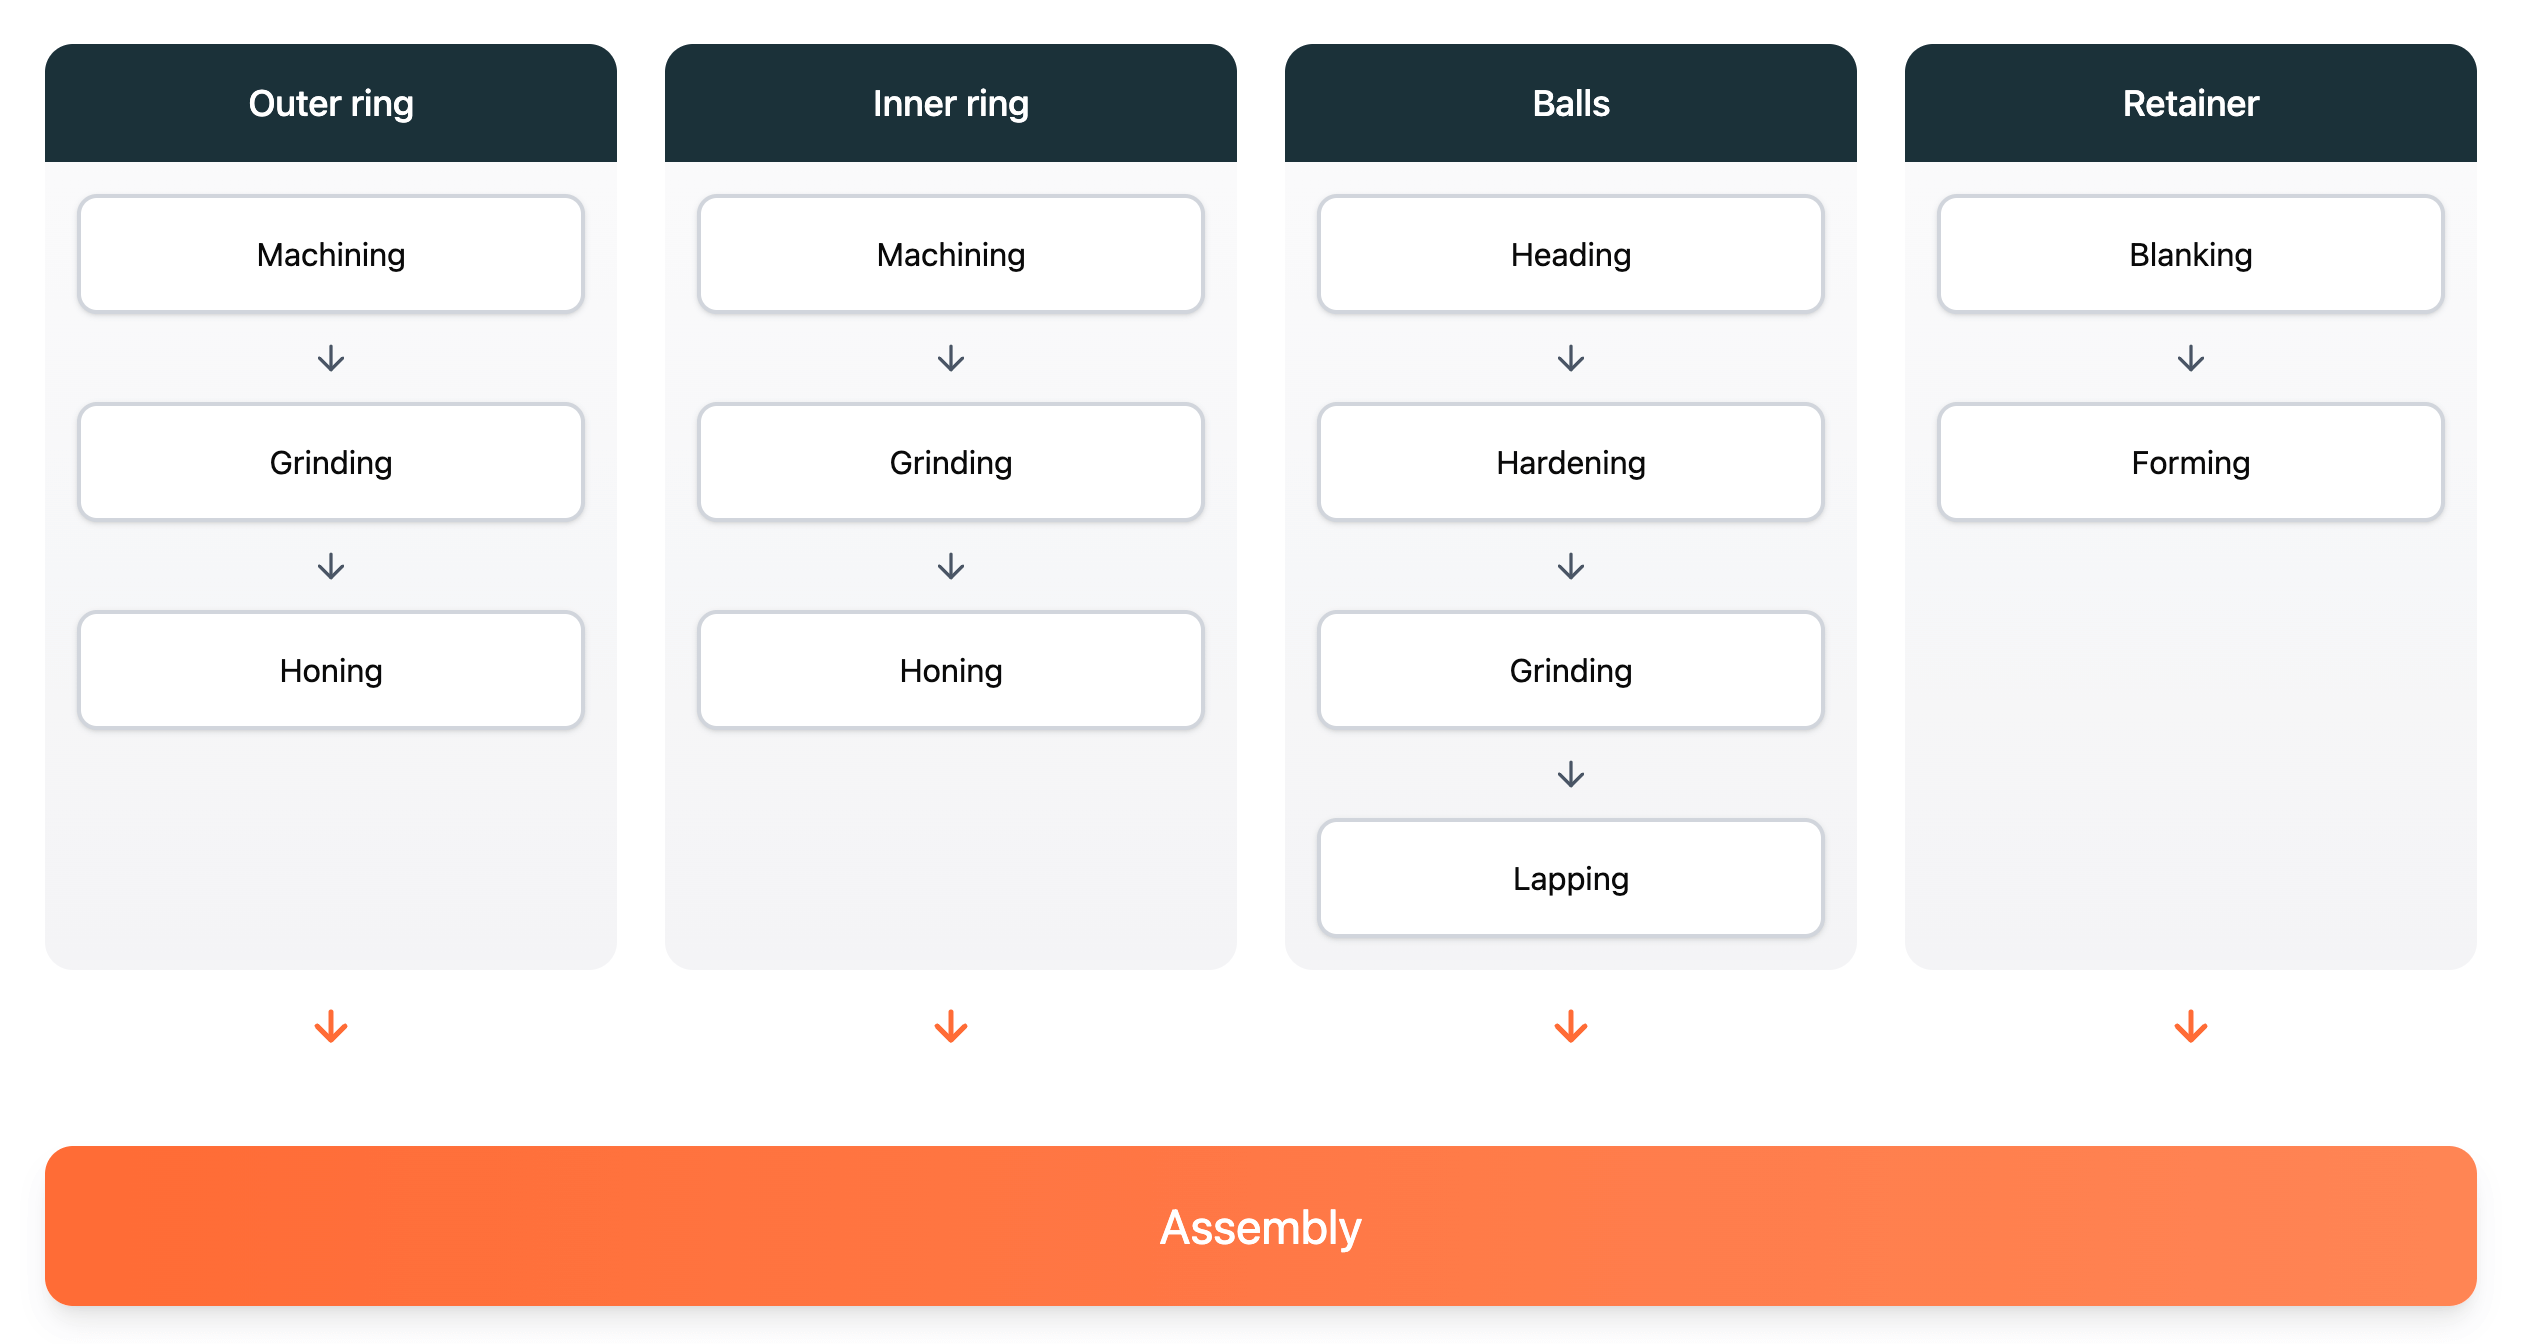
Our example scenario is a simplified ball bearing manufacturing process.
Ball bearings are mechanical components that minimize friction between moving parts using steel or ceramic balls positioned between two rings (outer and inner). They are essential to the efficient operation of engines, motors, and industrial machinery and are therefore fundamental to much of the technology we use every day.
The manufacturing process (see video) starts with shaping and heat treating the inner and outer rings, shaping and polishing them for strength and precision and assembling them with a retainer that maintains even spacing. Each stage, machining, heat treatment, and assembly, relies on precisely tuned equipment and continuous monitoring to meet strict quality standards.
In high-volume, low-margin industries like ball bearing manufacturing, continuously optimizing machine performance, predicting maintenance needs, and ensuring consistent quality are essential. Digital Twins, fueled by real-time sensor data from multiple machines and production lines, are a key enabler for these goals.
This Digital Twin will capture the details of all of these steps in a structured yet flexible way.
An end-to-end Databricks solution
The Digital Twin has two main components:
- The twin model, which specifies the entities in the system and how they relate to each other
- The twin graph, which hydrates the model by adding real-time data related to the entities (for example, sensor data or relevant predictions from ML models)
The twin model is created using RDF, an open and widely adopted standard for defining knowledge graphs and ontologies. We provide a selection of built-in predicates that you can extend to describe the relationships and dependencies between different parts of the system. Each entity in the twin model has an IRI, a namespaced identifier that uniquely identifies the entity and connects it to the telemetry data in the twin graph.
Digital Twins Solution Accelerator
Although this Solution Accelerator focuses on a specific manufacturing scenario, our approach is flexible and can model almost any kind of system. The main building blocks are depicted in the diagram below:
- Data ingestion
- Data mapping
- Data serving
- Digital Twin App
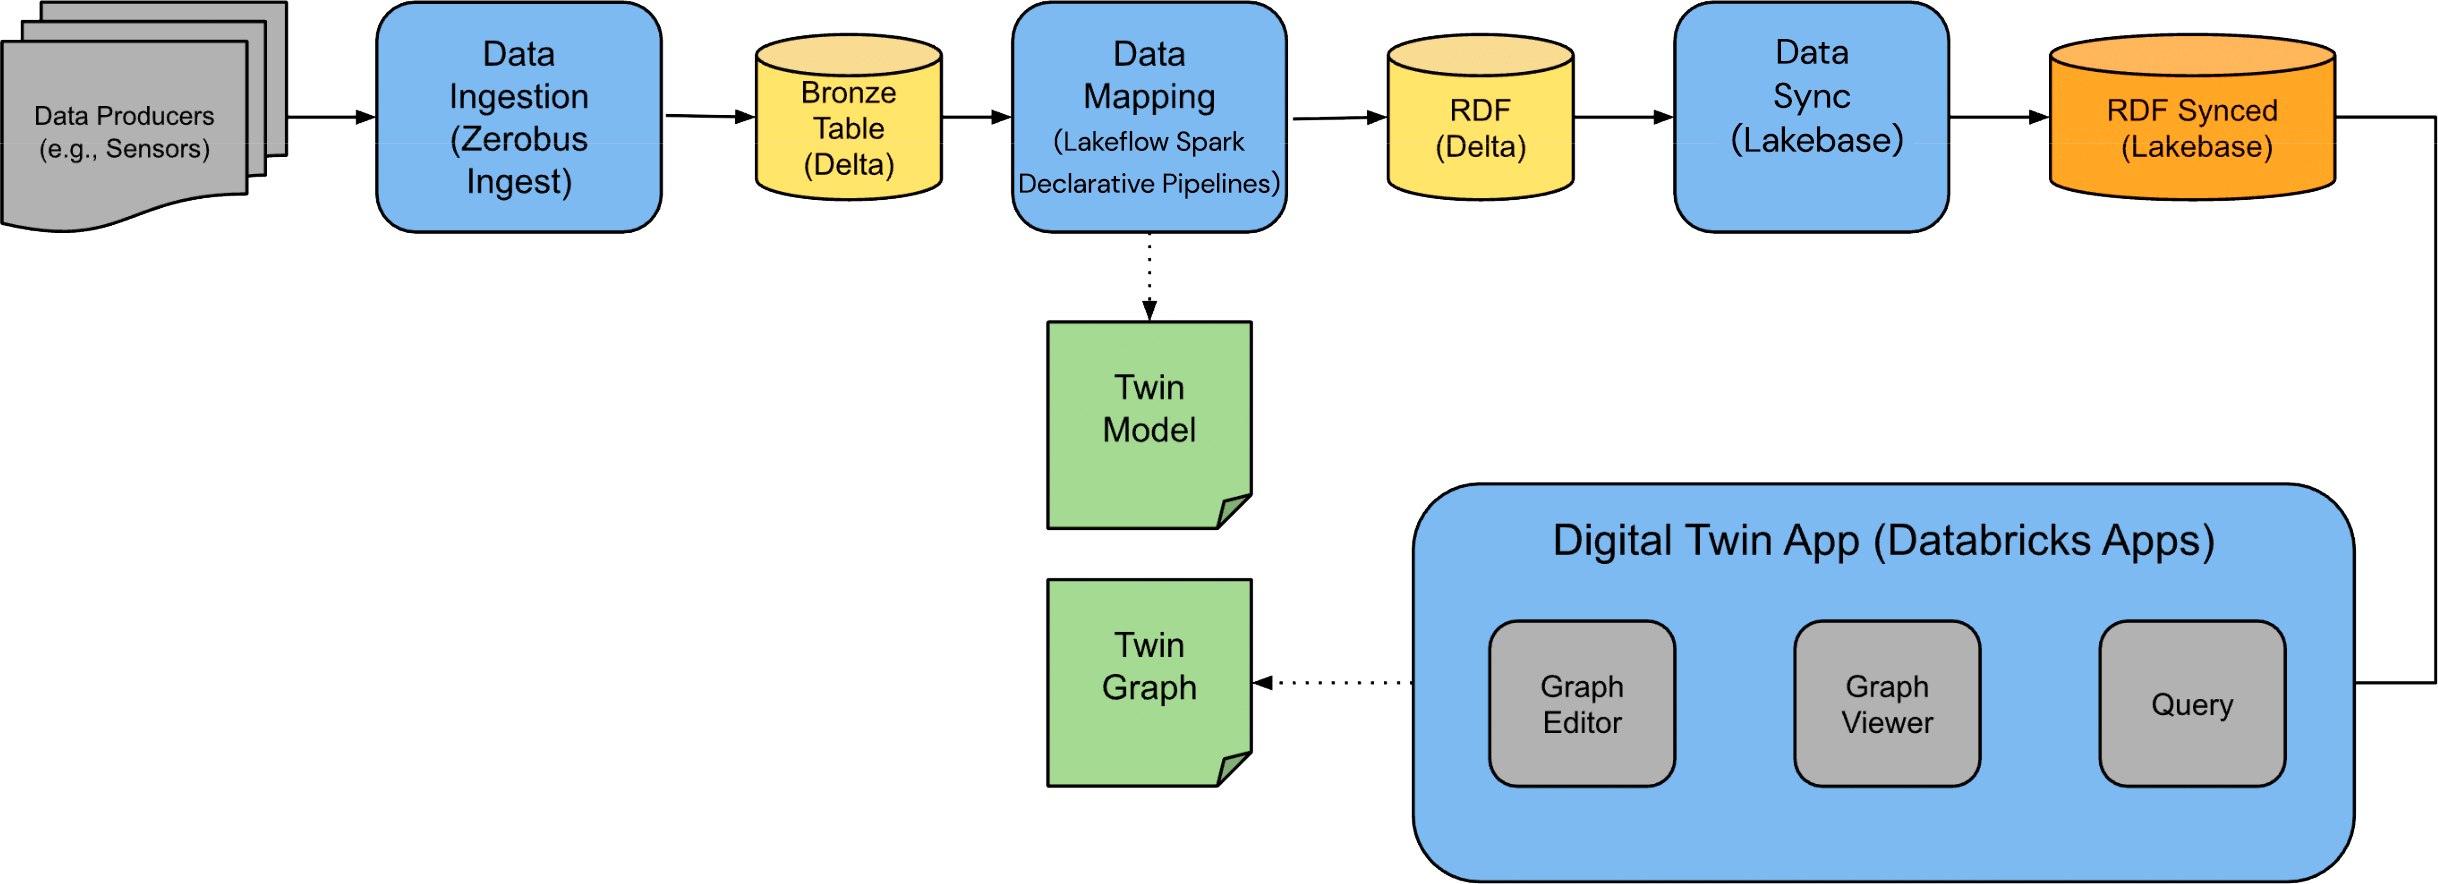
Digital Twins Solution Accelerator architectural diagram
The subsequent sections will provide a detailed explanation of these steps.
Step 1: Data ingestion
To populate the twin graph with real-time data, we begin by ingesting data through Zerobus Ingest, an innovative approach for pushing event data directly to the lakehouse without a single-sink message bus like Kafka. Zerobus Ingest provides high-throughput direct writes with low latency. It supports record-by-record ingestion at any scale and operates in a serverless environment.
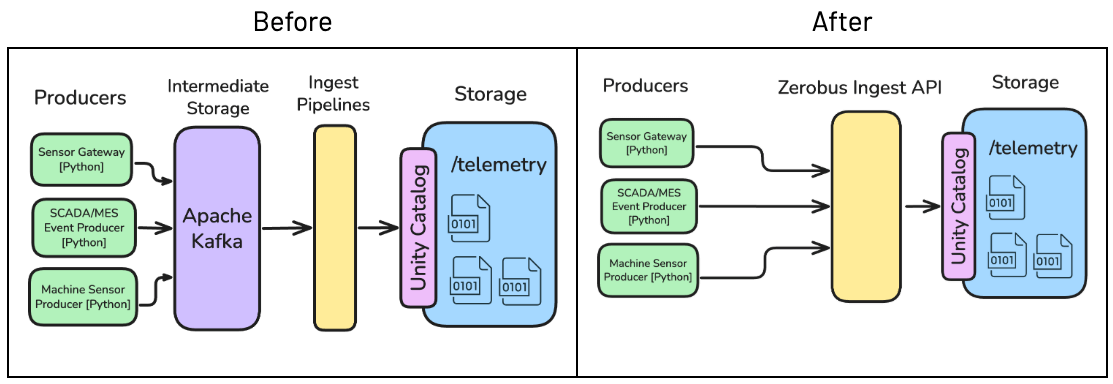
This ensures an efficient, scalable flow of manufacturing data, supporting experimentation, robust analytics, and deployment to live operations before moving to connected hardware.
In our scenario, telemetry data is continuously generated to simulate data ingestion from production line sensors. The raw data is then stored as a table in the lakehouse in Delta format using Zerobus Ingest.
Step 2: Data mapping
Once we land the raw sensor data in the bronze layer, we still have two tasks to complete before it is ready for use in the twin graph.
First, we need to ensure that the measurements are labeled with the IRI of the entity that they represent in the twin model. In our example, we use the machine identifier and add a namespace to form the IRI, but any option is valid as long as it is aligned with the IRIs in the twin model.
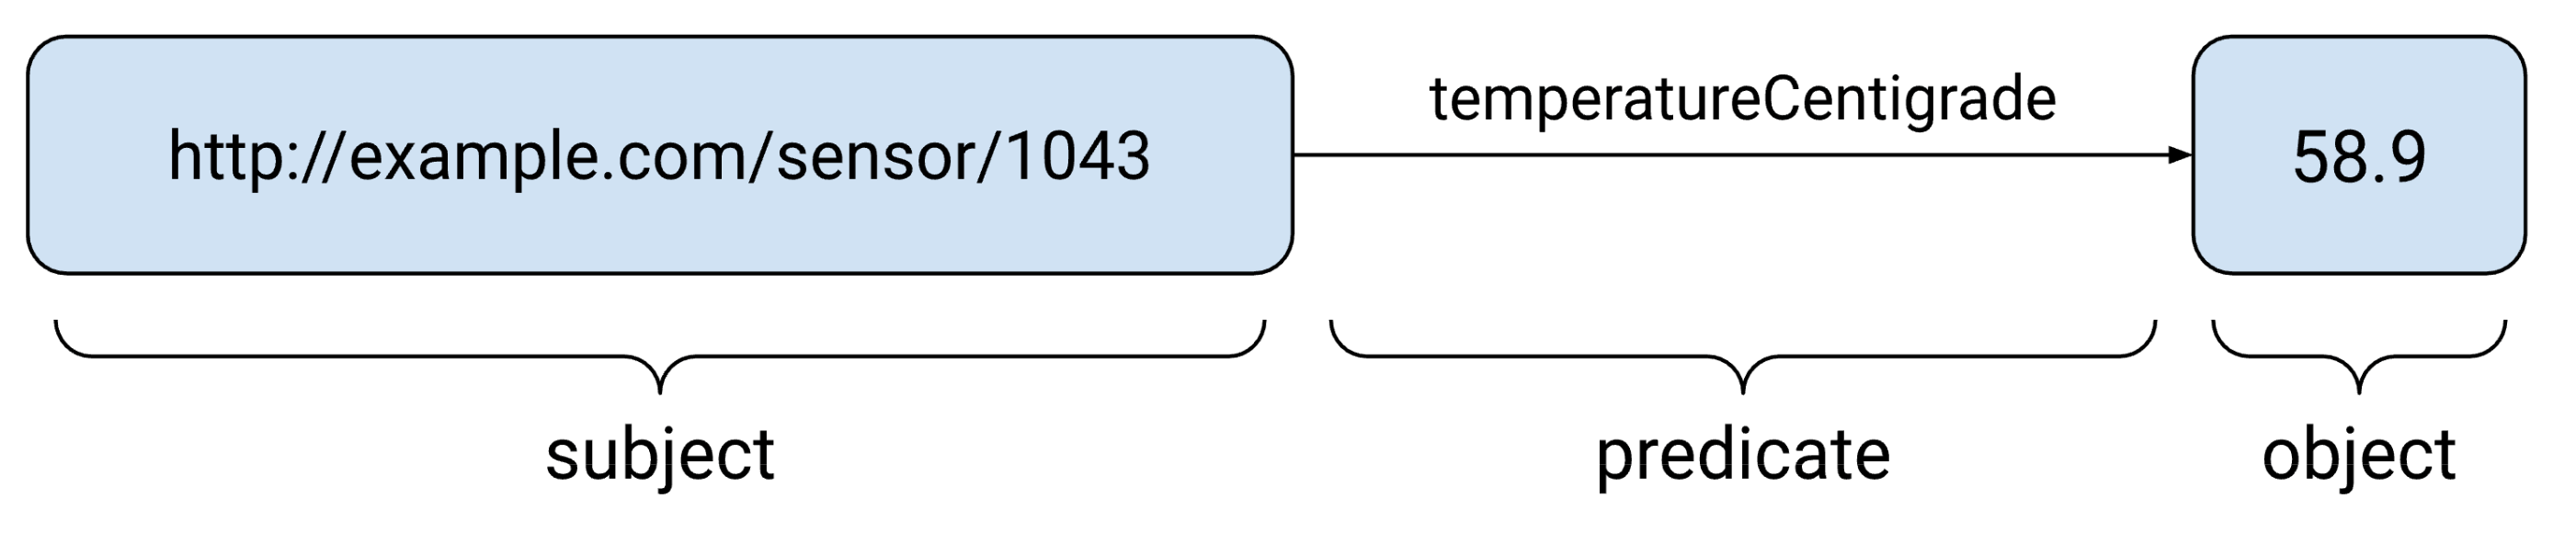
Next, we need to turn the columns of the tabular data or keys of nested data into the universal triple structure used by RDF. A full description of RDF is outside the scope of this blog, so interested readers should check out the official primer for a comprehensive introduction. In this case, the result has three components: the IRI of the entity (subject), the column it refers to (predicate) and the actual value (object).
For both these tasks, we can use the spark-r2r library, a simple DSL for describing the mapping process in Spark that follows the approach used in the R2RML standard. Thanks to Spark Real-Time mode, the result is a pipeline powered by Lakeflow Spark Declarative Pipelines that can handle large volumes of data cost-effectively with low latency.
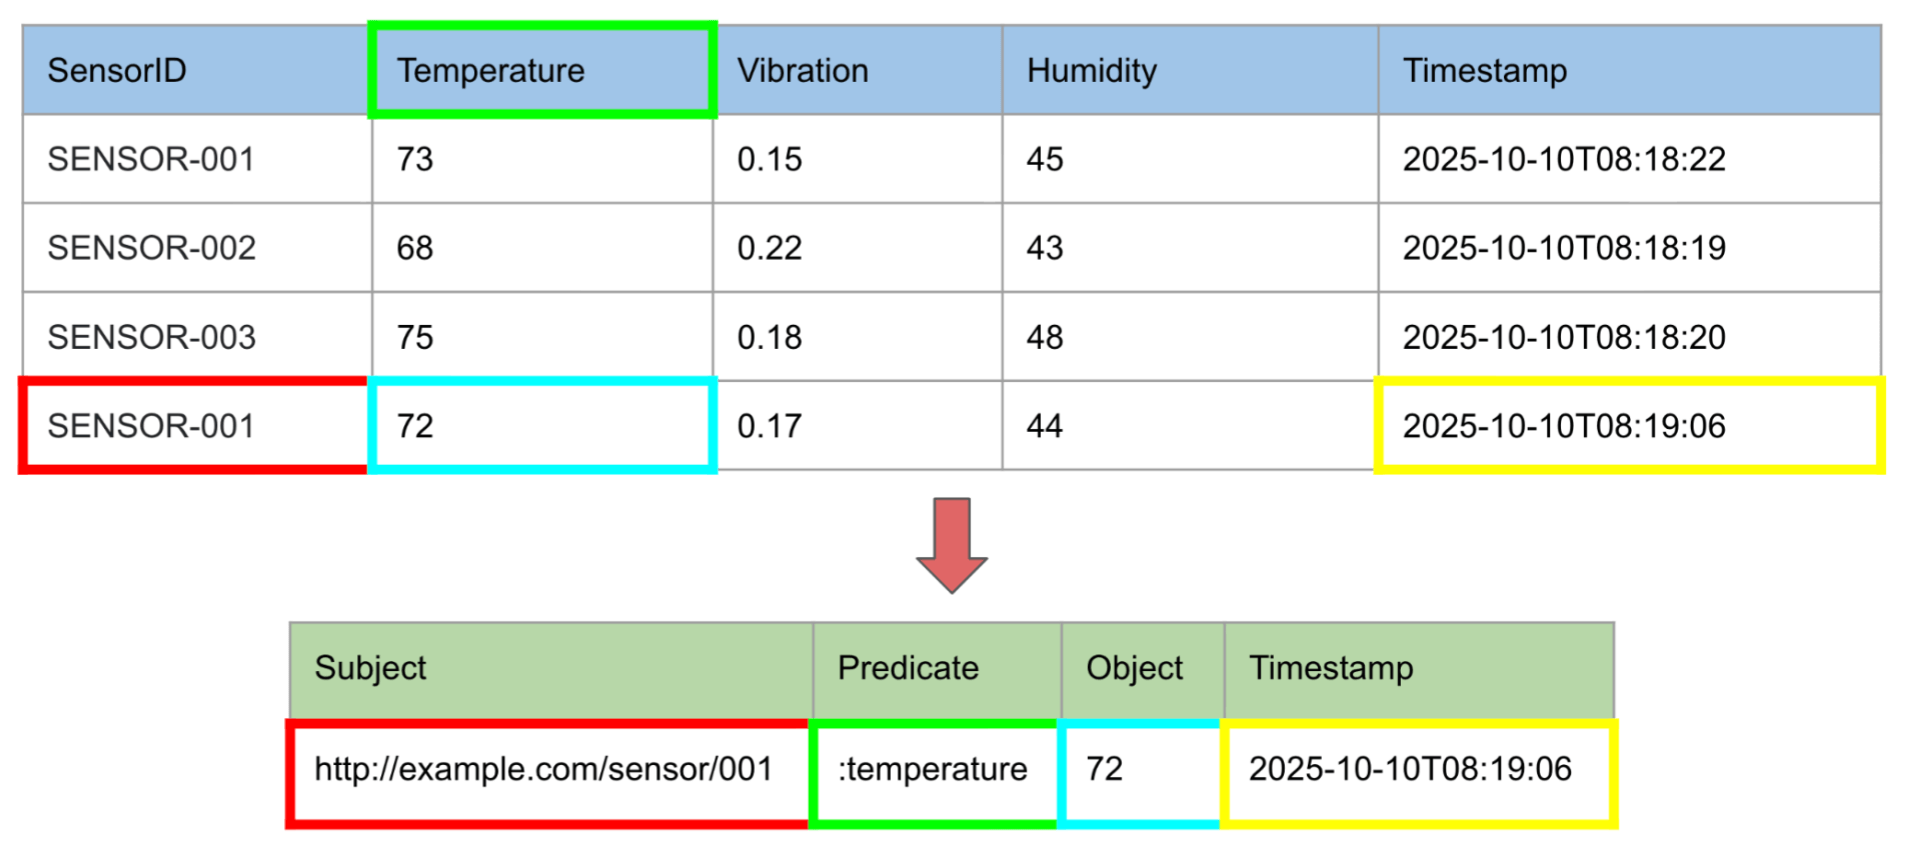
Mapping from a row-based format into a timestamped RDF triple. Note: the resulting triple is a consistent structure that is independent of the source table structure.
Crucially, we also add a timestamp to every triple based on when that measurement was taken. This enables us to view the state of the system at a particular point in time, thereby enabling a wide variety of analyses that examine the state of the system over time.
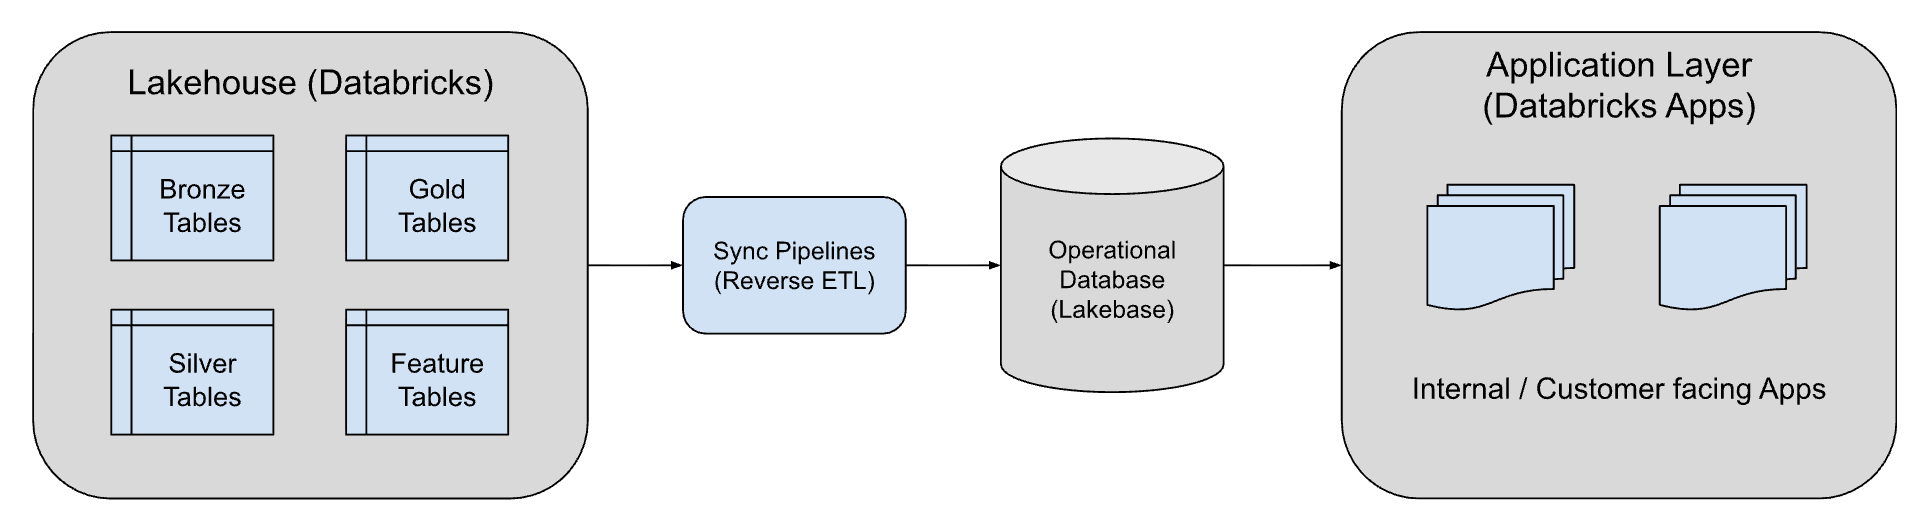
Step 3: Data sync
To provide low-latency access to the sensor data in the digital twin graph, we use the Synced Table feature from Lakebase. Lakebase is a fully managed Postgres OLTP engine that’s part of the Databricks Platform and designed for seamless integration with the lakehouse. Using Synced Tables, we automatically keep a read-only Postgres copy synchronized with the latest data in a Unity Catalog Delta Lake table. This flow is typically referred to as Reverse ETL, which is the process of making curated lakehouse data actionable, making it available to apps, dashboards, and other systems.
Once data is stored in Lakebase, applications can run low-latency queries on live sensor readings while historical versions remain stored as timestamped records in Delta Lake format for analytics or audits.
By combining Lakebase with the Delta Lake format, we get real-time performance and cost-efficient history without the hassle of complex ETL or maintaining duplicate databases.
Step 4: Digital Twin App
To make the digital twin accessible for day-to-day operations, we built an application using Databricks Apps that enables seamless end-to-end creation, visualization, and analysis of digital twin models. The app’s backend is developed in Python, while the frontend is implemented using React.js. Thanks to the serverless deployment capabilities of Databricks Apps, the launch process was effortless. The workflow begins with defining the model, followed by visualizing its state and executing advanced queries to identify fault propagation across the system.
Creating the Digital Twin Model with RDF
The app includes a visual RDF Model Editor for building and editing RDF models with ease. Models can be saved, retrieved, and managed to support multiple digital twins.
Digital Twins Application: RDF
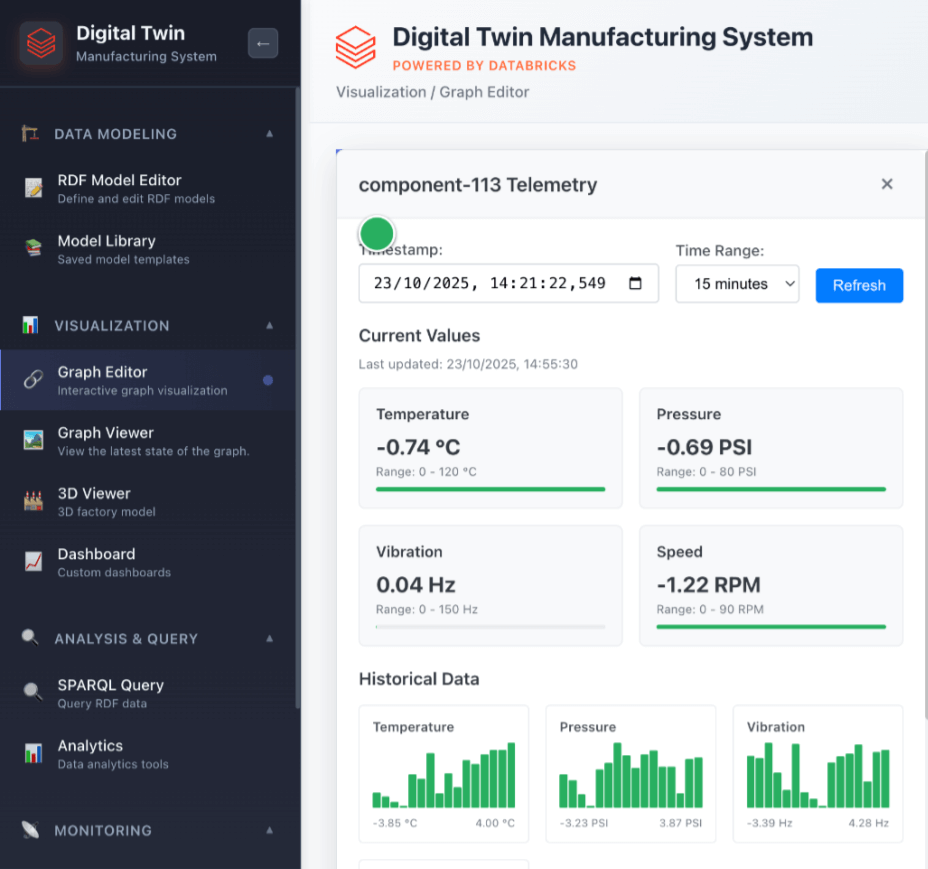
Digital Twin Visualization
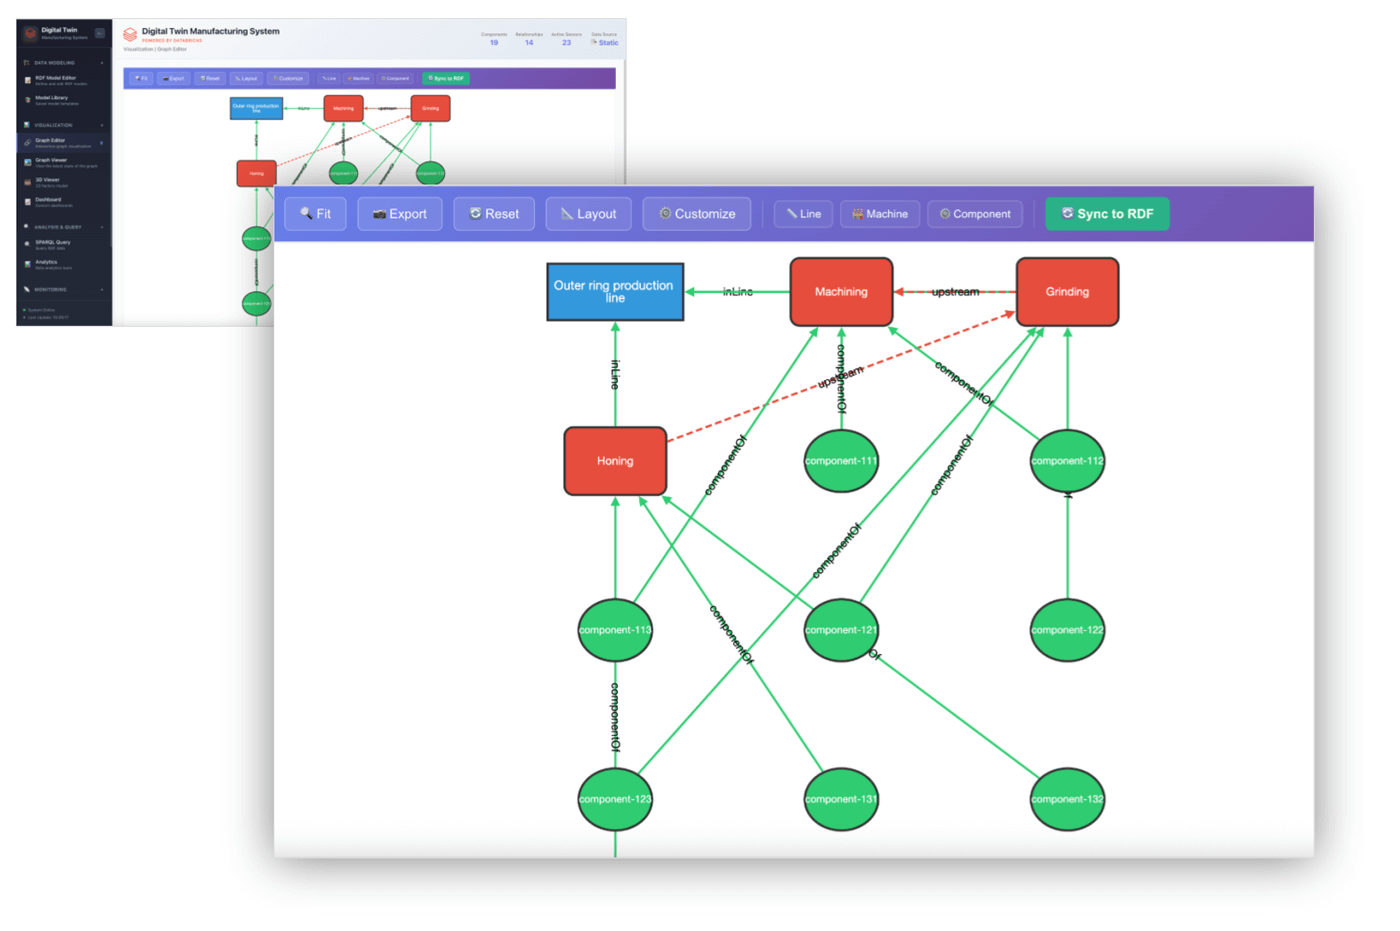
A dedicated Digital Twin Visualizer lets users explore the system their digital twin represents. It enables inspection of assembly line states at different times to identify issues or analyze how faults propagate.
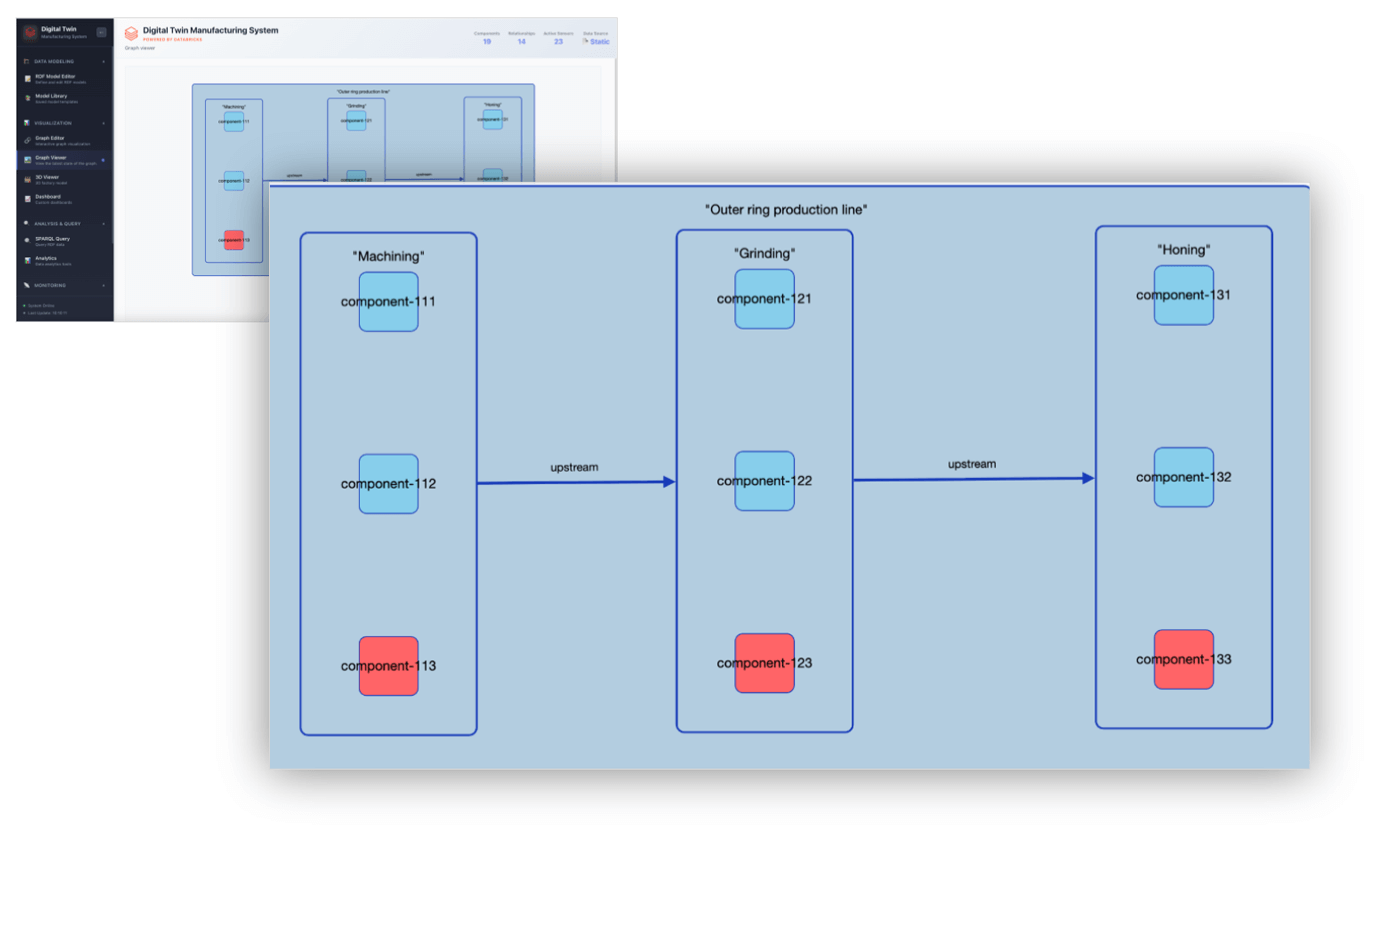
Digital Twins Application: Outer Ring Production Line
Analysis and Query
In addition, we provide the option for users to query the twin graph with the powerful SPARQL language, an open standard for knowledge graph querying. This enables ad hoc analysis in the UI, but also makes the data accessible to other tools that may want to work with the twin graph to provide simulations or other analysis. This is in contrast to other tools that often only offer a limited proprietary query language or incomplete extension to SQL for accessing the twin graph.
Further Development
After the initial deployment, the accelerator can serve as the foundation for more advanced Digital Twin applications:
- Build and deploy advanced AI/ML models for predictive maintenance and anomaly detection
- Expose your Digital Twins through Dashboards and Genie Rooms with AI/BI
- Move your workload to Real-Time Mode from Spark Structured Streaming to unlock microseconds-scale performance
- Integrate your Digital Twins with your command system to leverage real-time analytics from your data platform to take action based on patterns in the twin graph
The Digital Twin Solution Accelerator is highly adaptable, allowing customization across a wide range of industrial and analytical scenarios. The diagram below illustrates some examples where this framework can be extended and applied.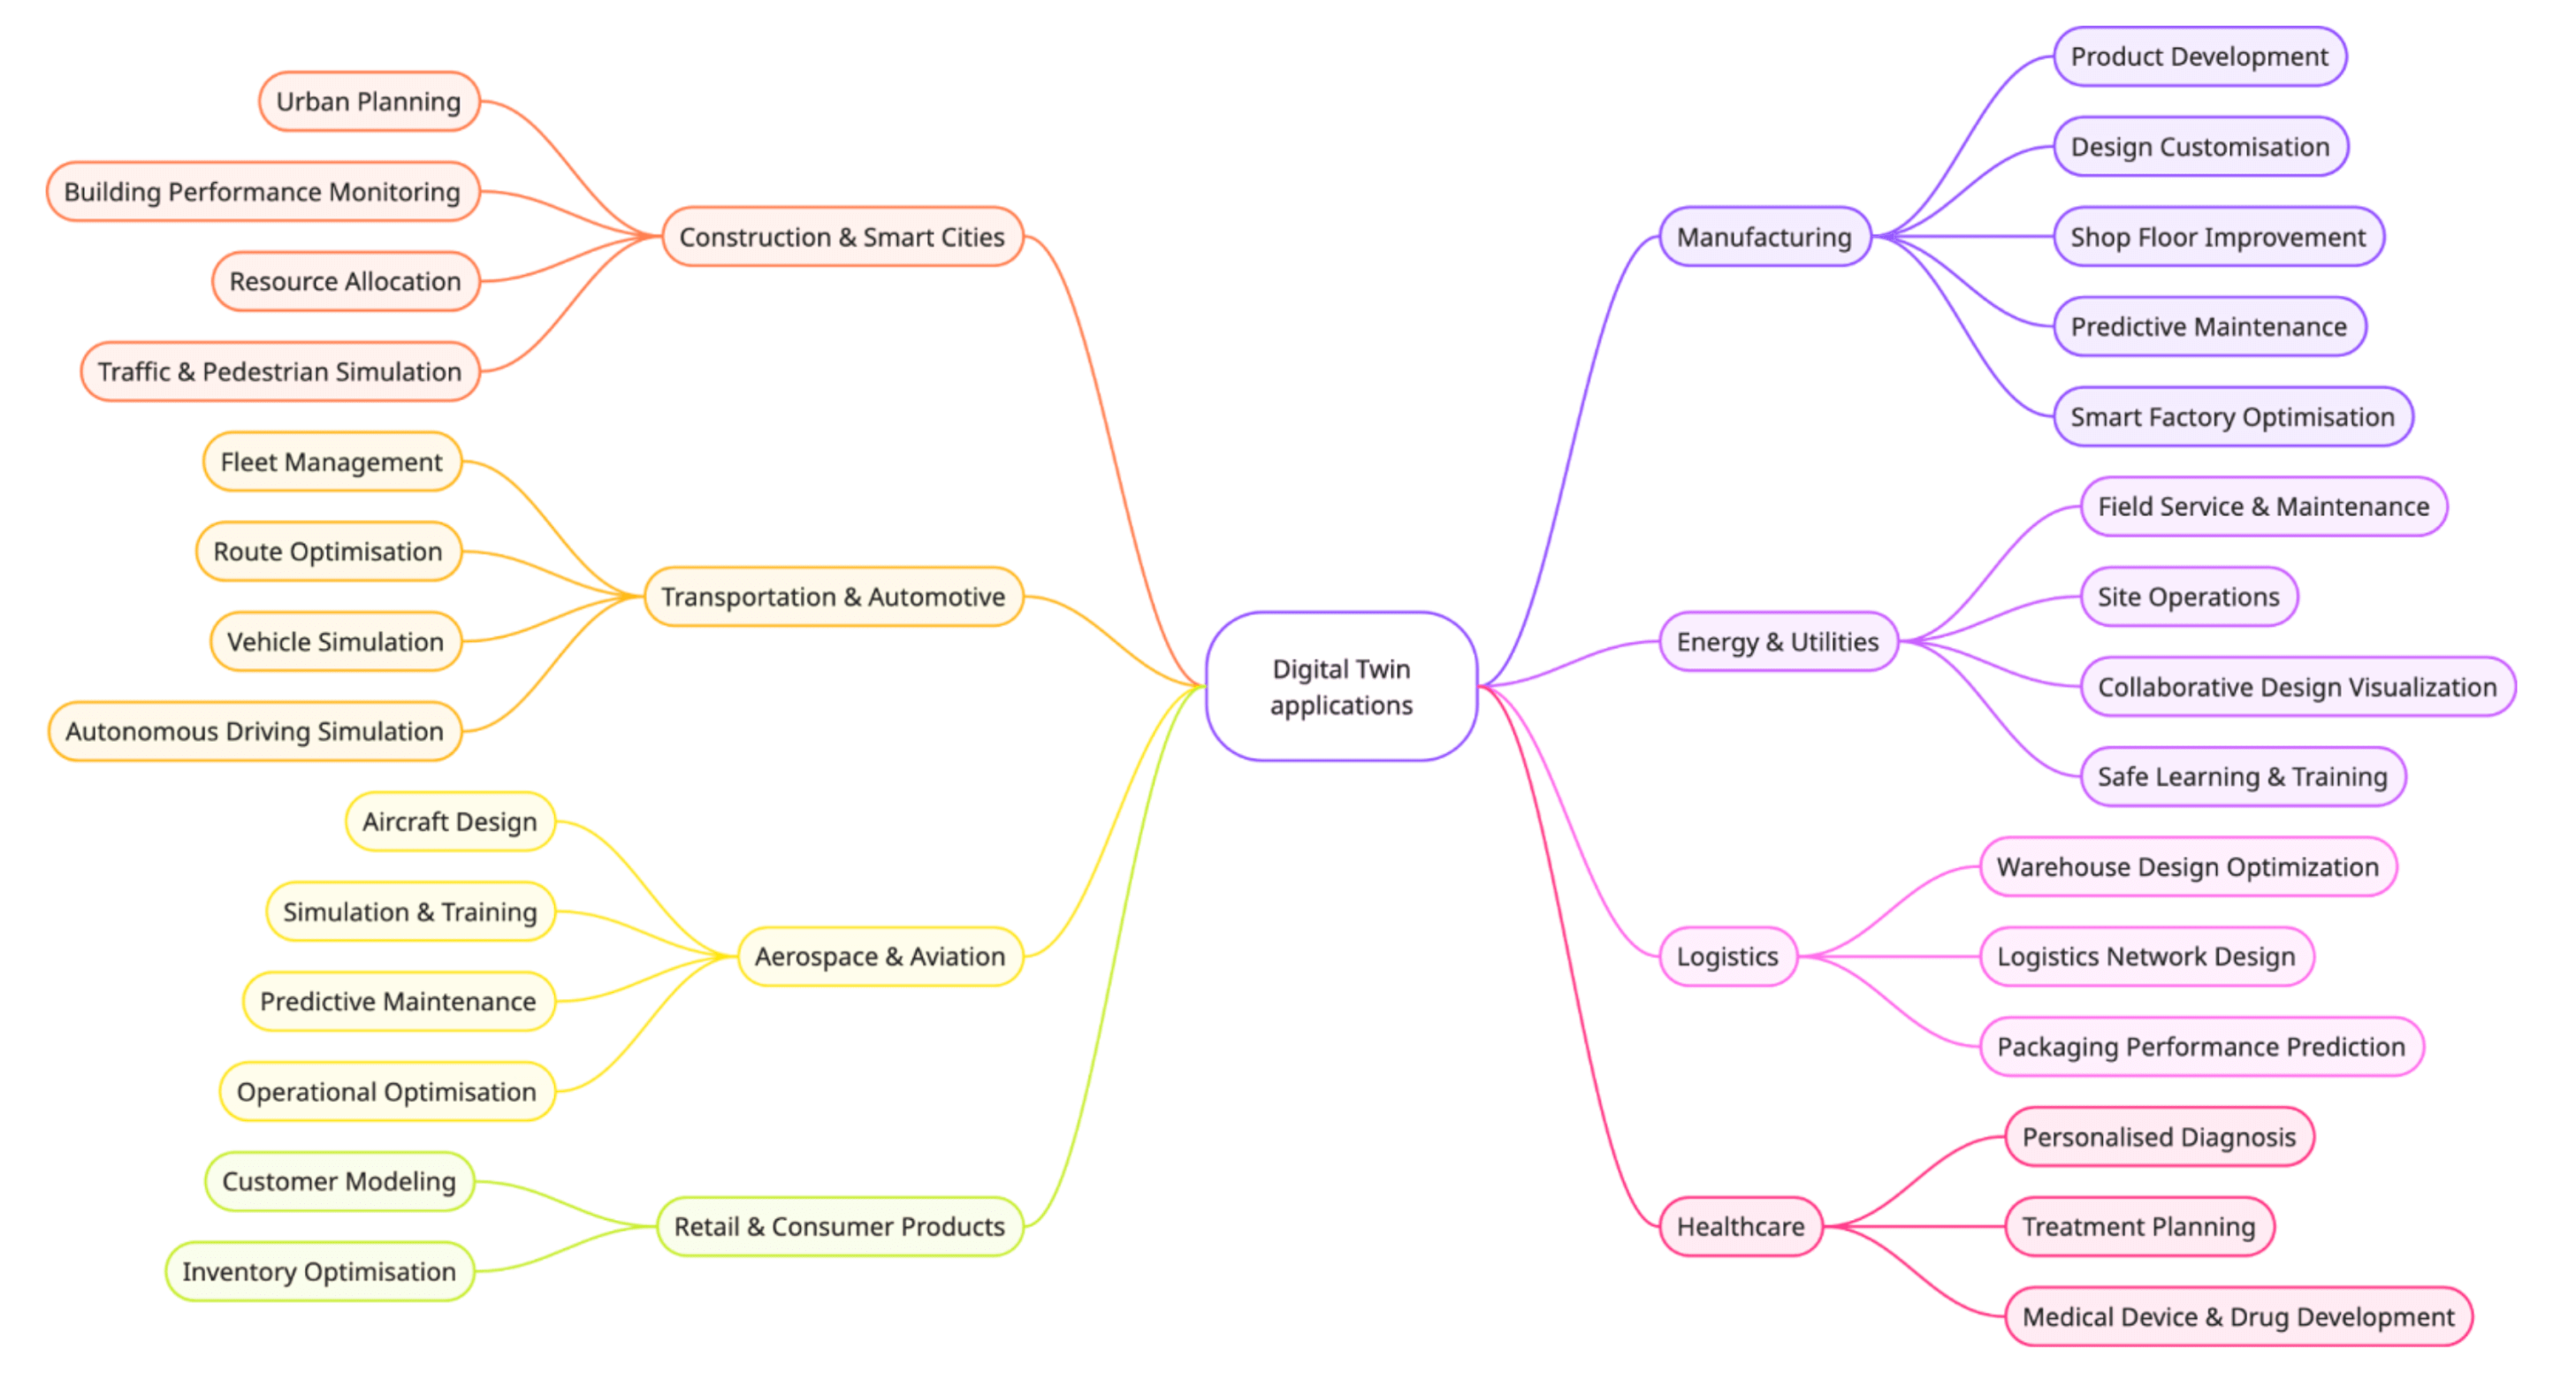
Whether you’re optimizing manufacturing systems, monitoring industrial assets, or developing real-time analytics for connected devices, this accelerator provides a robust starting point for experimentation and scale.
Try the Digital Twins Solution Accelerator
Ready to get started? Download the Databricks Solution Accelerator for Digital Twins in manufacturing. Follow the step-by-step instructions provided to create your own performant and scalable end-to-end digital twins.
Are you interested in building your own Digital Twin and would like to find out more? Contact your Databricks account representative so we can help you adapt this solution to your exact requirements.
Get the latest posts in your inbox
Subscribe to our blog and get the latest posts delivered to your inbox.