How Crisp and Databricks Enable Retail-Supplier Collaboration through Shared Sales and Inventory Data
by Venkata Wunnava, Timothy Sepp, Dag Liodden, Casey Luther, Nikhil Mishra, Sridhar Paladugu, David Kulwin, Sam Steiny and Bryan Smith

Retailers have long shared sales and inventory data with their suppliers. Combined access to this information enables the two parties to assess consumer demand and plan joint activities to promote consumption. It also allows them to identify and resolve issues leading to out of stocks. In scenarios where retailers may charge supply chain compliance fees, access to this data may help suppliers stay ahead of issues that may lead to penalties. And where a supplier plays the role of a category captain, this data may help both parties elevate the performance of a broad range of products, driving higher revenues for both the retailer and the supplier.
But for the supplier, keeping up with the different systems, data models, and release cadences associated with each retail partner is challenging. Retailer-aligned teams within the supplier organization spend an inordinate amount of time downloading, organizing and restructuring these data in order to obtain the insights they require, and a holistic view of inventory and demand across multiple retail organizations that would be incredibly helpful for planning production cycles often eludes the supplier.
Recognizing these challenges, Crisp has partnered with over 40 leading retail organizations to construct a centralized point of access for this data. Data is harmonized using a standard model that provides suppliers a consistent view of the data while retaining the retailer-specific information retailer-aligned teams require.
Available through the Databricks Marketplace, suppliers now can easily access this information without time-consuming cycles of data download and pre-processing. And leveraging the analytics capabilities within Databricks, analysts and data scientists can easily obtain the insights they require from this information.
Accessing the Data Is Fast & Easy
To access the Crisp data, Databricks users simply need to navigate to the Marketplace icon towards the bottom of the left-hand navigation in their Databricks workspace. A quick search for CRISP reveals four data products available to suppliers authorized by their retail partners for data access. (Figure 1)
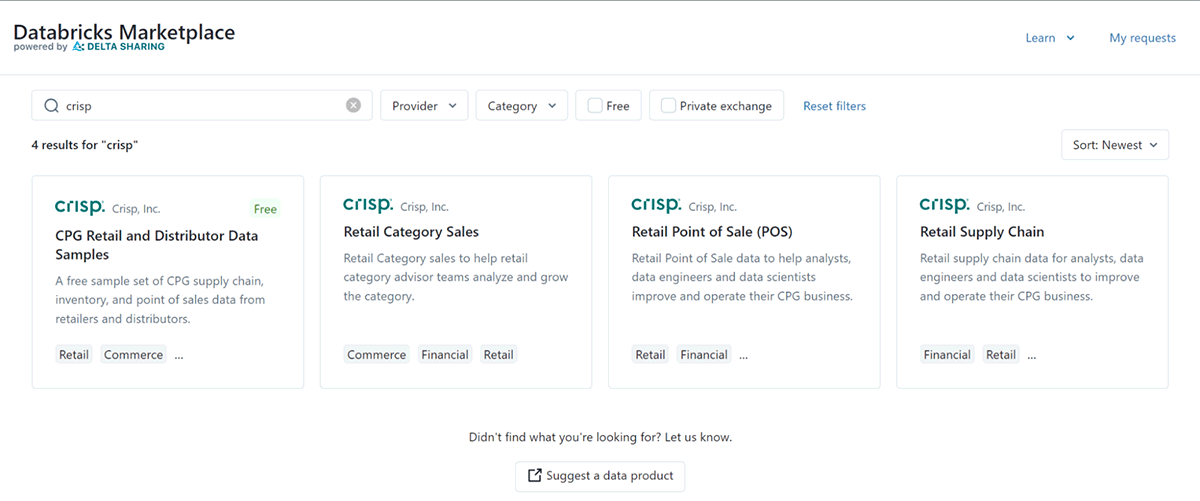
Each of these offerings provide suppliers with access to:
- Retail Point of Sale (POS) - product-level units sold and sales amounts by store location
- Retail Supply Chain - DC fill rates, inventory and to-store shipments as well as store inventories
- Retail Category Sales - category-level units sold and sales amounts by store location as available to retailer-designated category captains
- CPG Retail & Distributor Data Samples - sample data for all three other offerings
Clicking the Request Access button in the right-hand upper corner of the page, will present you a form by which you can request access to data authorized by your retailer partners. Crisp will verify this information and contact you with details regarding the next steps for connecting your environment to this data. Once licensed for the data through CRISP, you'll be able access the data seamlessly within Databricks all powered by Delta Sharing.
Data to Drive Decisions
The data arriving from Crisp is laid out in easy to consume fact and dimension tables. For business analysts, this represents a familiar way of presenting information, and it's aligned well with the expectations of the many business intelligence tools organizations can connect to Databricks with.
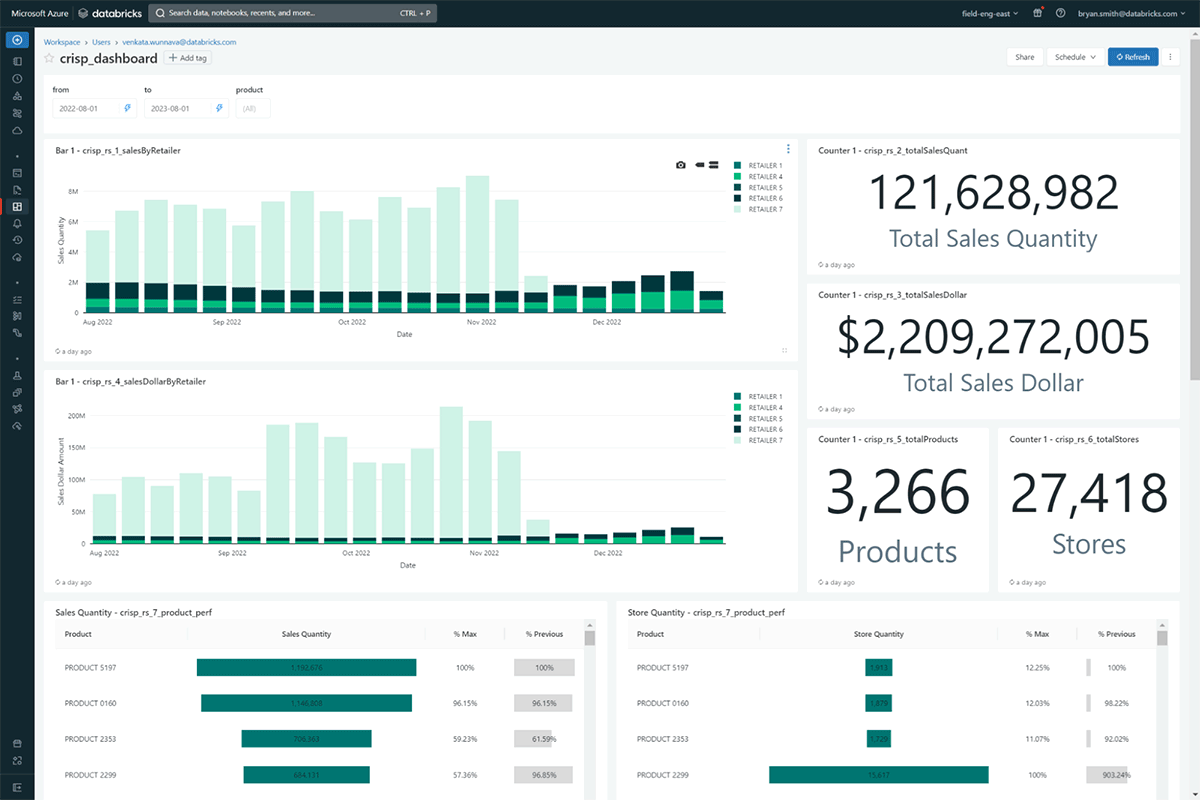
Using external tools like Tableau, Power BI and many others, analysts can easily consume this data to perform exploratory analysis. Databricks also has native dashboarding capabilities that allow the team to assemble key insights for repeatable consumption. (Figure 2). (You can get a quick overview of the Databricks dashboarding capabilities here.)
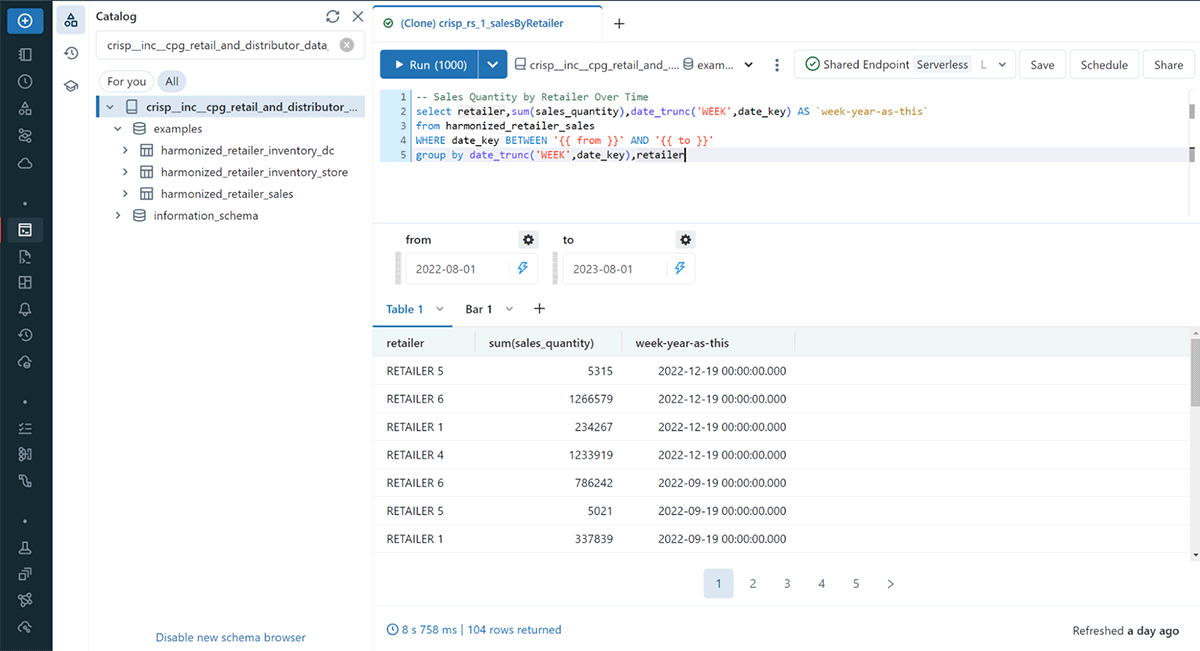
To construct a dashboard, simply use the Databricks SQL Editor built into the workspace UI to write a query, create visualizations, and add the visualizations to a dashboard. (Figure 3) The SQL Editor can be used in a standalone manner as well by business analysts familiar with industry-standard SQL syntax to query the data as needed. In scenarios where the results of a query are important to monitor, these queries can be configured to run on a schedule and to trigger notifications when their results meet criteria specified by the query author. There's an incredible amount of functionality built into the environment to help you get the most out of the data.
Additionally to support writing the SQL, the built-in Databricks Assistant, powered by generative AI capabilities and knowledge of the data structures in the Crisp dataset, can translate English-language questions into the syntax needed to retrieve the answer. (Figure 4)
Tap Into the Full Potential of the Data with Data Science
As a unified data platform, Databricks brings together both business analytics and data science capabilities in one environment. Supporting Python, SQL and R, data scientists feel at home performing their work within the Databricks environment, minimizing the need for you to replicate these data to another environment which is not only time consuming and expensive but which may also put you at risk of violating terms and conditions specified by retailer partners.
As an open platform, data scientists can perform their work within Databricks without compromises in terms of which libraries or packages they employ. Model management and tracking along with workflow management capabilities help ensure that this work successfully transitions from experimentation to operationalization without putting undue strain on the data science team.
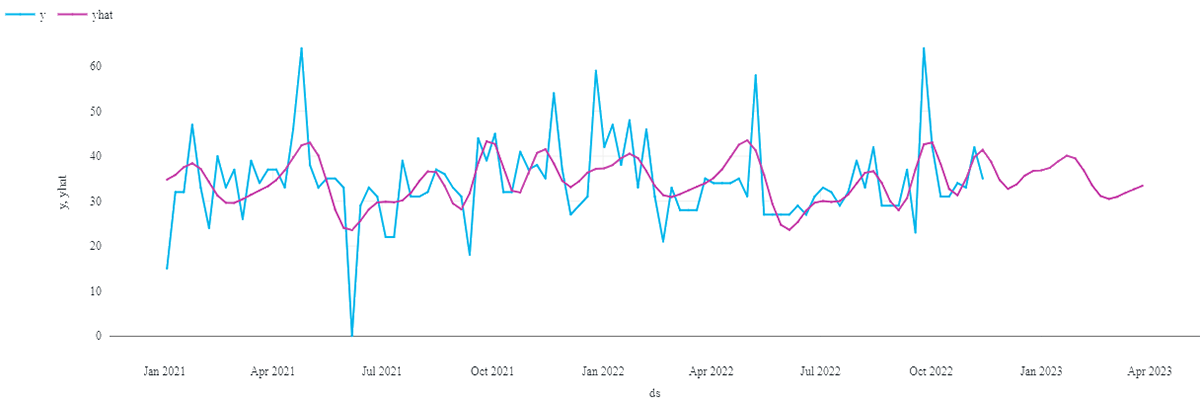
Using this capability, data scientists within supplier organizations can perform sophisticated out of stock analyses and demand forecasting, providing their teams insights not into just what happened but why and what will happen next. (Figure 5)
Get Started Today
To get started using the Crisp data within Databricks, visit the Data Marketplace and request access to the Crisp data or request a demo from Crisp. It's that simple.
Get the latest posts in your inbox
Subscribe to our blog and get the latest posts delivered to your inbox.