Improve Lakehouse Security Monitoring using System Tables in Databricks Unity Catalog
Learn how you can use System Tables to drive actionable insights and implement a Zero Trust Architecture for your lakehouse
by Alex Ott, Andrew Weaver, Michael Milirud and Silvio Fiorito
As the lakehouse becomes increasingly mission-critical to data-forward organizations, so too grows the risk that unexpected events, outages, and security incidents may derail their operations in new and unforeseen ways. Databricks offers several key observability features to help customers get ahead of this new set of threats and give them visibility into their lakehouse like never before.
From a security standpoint, one of the ways that organizations have adapted to the modern world, is to rely on the principle of "Never Trust, Always Verify" by following a Zero Trust Architecture (ZTA) model. In this blog, we're going to show you how to get you started with a ZTA on your Databricks Lakehouse Platform, and share a Databricks Notebook that will automatically generate a series of SQL queries and alerts for you. If you normally use Terraform for this kind of thing we've got you covered too, simply check out the code here.
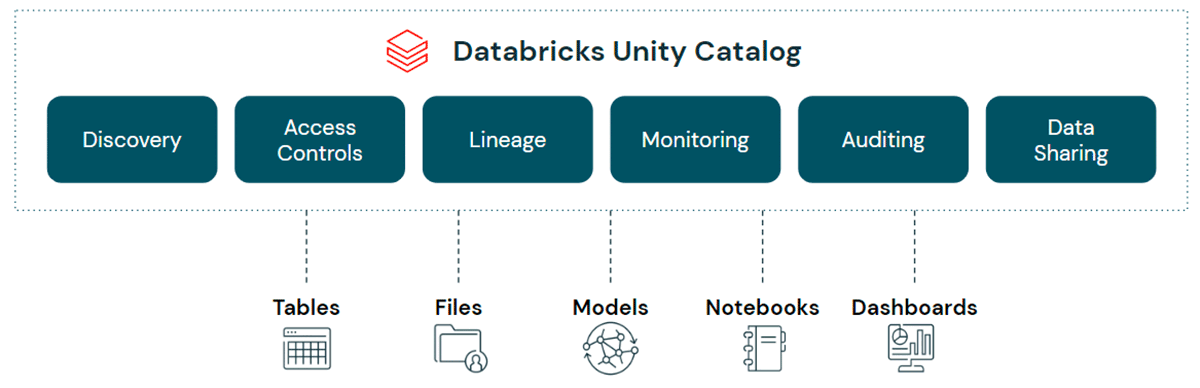
What are System Tables?
System Tables serve as a centralized operational data store, backed by Delta Lake and governed by Unity Catalog. System tables can be queried in any language, allowing them to be used as the basis for a wide range of different use cases, from BI to AI and even Generative AI. Some of the most common use cases we've started to see customers implement on top of System Tables are:
- Usage analytics
- Consumption/cost forecasting
- Efficiency analysis
- Security & compliance audits
- SLO (Service level objective) analytics and reporting
- Actionable DataOps
- Data quality monitoring and reporting
Although a number of different schemas are available, in this blog we're largely going to focus on the system.access.audit table, and more specifically how it can be used to augment a Zero Trust Architecture on Databricks.
Audit Logs
The system.access.audit table serves as your system of record for all of the material events happening on your Databricks Lakehouse Platform. Some of the use cases that might be powered by this table are:
- Security and legal compliance
- Audit analytics
- Acceptable Use Policy (AUP) monitoring and investigations
- Security and Incident Response Team (SIRT) investigations
- Forensic analysis
- Outage investigations and postmortems
- Indicators of Compromise (IoC) detection
- Indicators of Attack (IoA) detection
- Threat modeling
- Threat hunting
To analyze these kinds of logs in the past, customers needed to set up cloud storage, configure cloud principals and policies, and then build and schedule an ETL pipeline to process and prepare the data. Now, with the announcement of System Tables, all you need to do is opt-in and all of the data you need will be automatically made available to you. Best of all, it works exactly the same across all supported clouds.
"Never Trust, Always Verify" on your lakehouse with System Tables
Some of the key concepts of a Zero Trust Architecture (ZTA) are:
- Continuous verification of users and access
- Identify your most privileged users and service accounts
- Map your data flows
- Assign access rights based on the principle of least privilege
- Monitoring is crucial
In this blog we'll mainly focus on Monitoring is crucial, but it's worth briefly mentioning how Unity Catalog helps data-forward organizations implement a Zero Trust Architecture across its wider feature set too:
- Continuous verification of users and access:
- Unity Catalog validates permissions against every request, granting short-lived, down-scoped tokens to authorized users.
- Whilst identity access management in UC offers the first proactive line of defense, in order to "Never Trust, Always Verify" we're going to need to couple that with retrospective monitoring. Access management on its own won't help us detect and resolve misconfigured privileges or policies, or permissions drift when someone leaves or changes roles within an organization.
- Identify your most privileged users and service accounts:
- Unity Catalog's built-in
system.information_schemaprovides a centralized view of who has access to which securables, allowing administrators to to easily identify their most privileged users. - Whilst the
information_schemaprovides a current view, this can be combined withsystem.access.auditlogs to monitor grants/revocations/privileges over time.
- Unity Catalog's built-in
- Map your data flows:
- Unity Catalog provides automatic data lineage tracking in real-time, down to the column level.
- Whilst lineage can be explored via the UI (see the docs for AWS and Azure) thanks to System tables it can also be queried programmatically too. Check out the docs on AWS and Azure and look out for more blogs on this topic soon!
- Assign access rights based on the principle of least privilege:
- Unity Catalog's unified interface greatly simplifies the management of access policies to data and AI assets, as well as consistently applying those policies on any cloud or data platform.
- What's more, System Tables follow the principle of least privilege out of the box too!
Monitoring is crucial
Effective monitoring is one of the key foundations of an effective Zero Trust Architecture. All too often, people can be lured into the trap of thinking that for effective monitoring it's sufficient to capture the logs that we might need and only query them in the event of an investigation or incident. But in order to align to the "Never Trust, Always Verify" principle, we're going to have to be more proactive than that. Thankfully with Databricks SQL it's easy to write SQL queries against the system.access.audit table, and then schedule them to run automatically, instantly notifying you of potentially suspicious events.
Quickstart notebook
Clone the repo into your Databricks workspace (see the docs for AWS and Azure) and run the create_queries_and_alerts notebook. Some examples of the 40+ queries and alerts that will be automatically generated for you are:
| Query / Alert Name | Query / Alert Description |
|---|---|
| Repeated Failed Login Attempts | Repeated failed login attempts over a 60-minute period within the last 24 hours. |
| Data Downloads from the Control Plane | High numbers of downloads of results from notebooks, Databricks SQL, Unity Catalog volumes and MLflow, as well as the exporting of notebooks in formats that may contain query results within the last 24 hours. |
| IP Access List Failures | All attempts to access your account or workspace(s) from untrusted IP addresses within the last 24 hours. |
| Databricks Access to Customer Workspaces | All logins to your workspace(s) via the Databricks support process within the last 24 hours. This access is tied to a support ticket while also complying with your workspace configuration that may disable such access. |
| Destructive Activities | High number of delete events over a 60-minute period within the last 24 hours. |
| Potential Privilege Escalation | High number of permissions changes over a 60-minute period within the last 24 hours. |
| Repeated Access to Secrets | Repeated attempts to access secrets over a 60-minute period within the last 24 hours. This could be used to detect attempts to steal credentials. |
| Repeated Unauthorized Data Access Requests | Repeated unauthorized attempts to access Unity Catalog securables over a 60-minute period within the last 24 hours. Repeated failed requests could indicate privilege escalation, data exfiltration attempts or an attacker trying to brute force access to your data. |
| Antivirus Scan Infected Files Detected | For customers using our Enhanced Security and Compliance Add-On, detect any infected files found on the hosts within the last 24 hours. |
| Suspicious Host Activity | For customers using our Enhanced Security and Compliance Add-On, detect suspicious events flagged by the behavior-based security monitoring agent within the last 24 hours. |
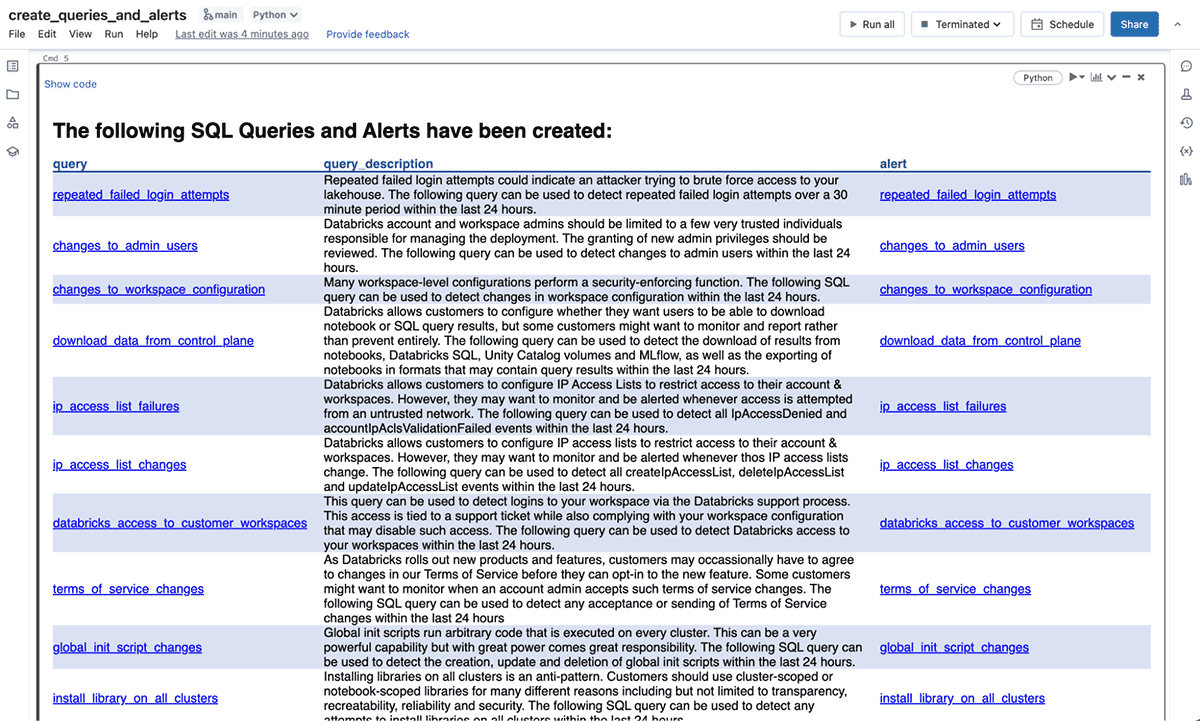
Once you have run the notebook, if you scroll to the bottom you'll see an HTML table with links to each of the SQL queries and alerts:
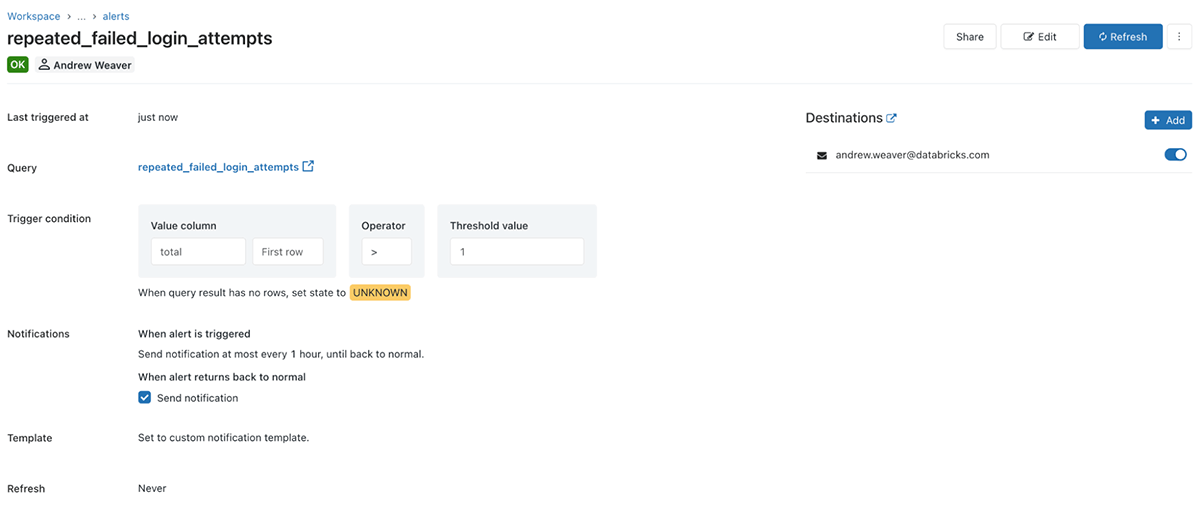
To test the alert, simply follow the link and select refresh. If it hasn't been triggered you'll see a green OK in the top left:
If it has been triggered you'll receive an email with a table including all of the events that have triggered the alert. To set the alert to run on a schedule, just select edit and then Refresh and choose how often you want the alert to run:
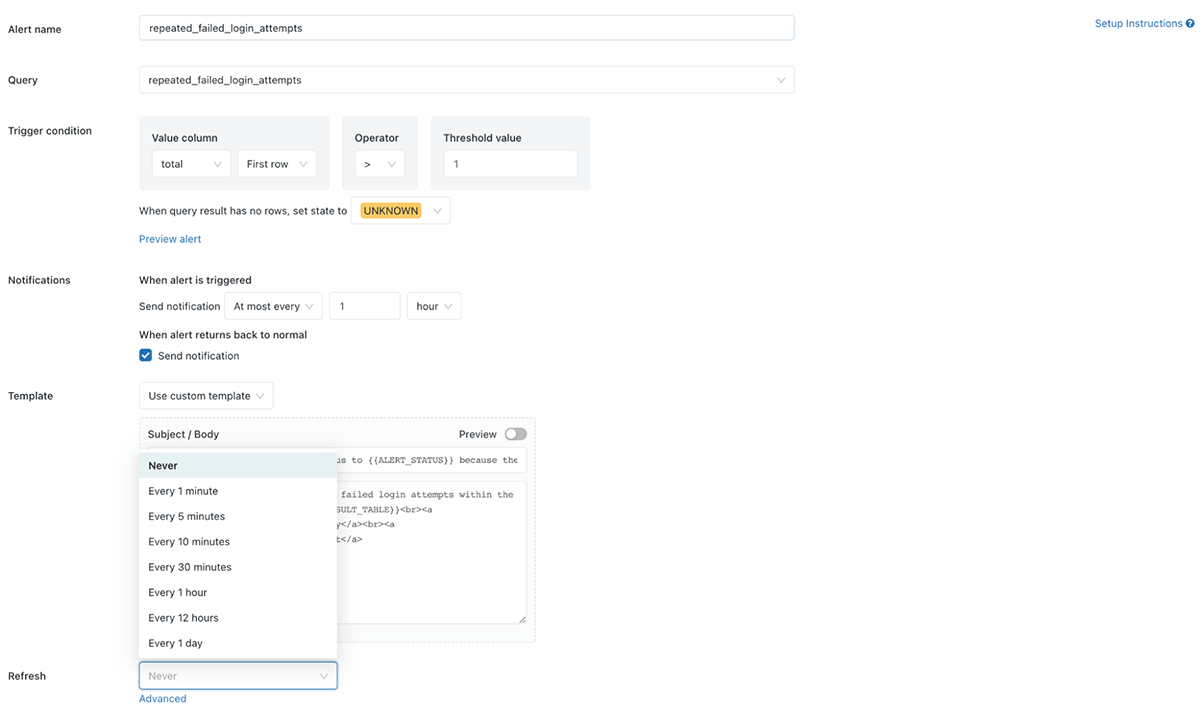
You can customize the alert further as needed, including by adding additional notification destinations such as email addresses, Slack channels or MS Teams (among others!) Check out our documentation for AWS and Azure for full details on all of the options.
Advanced Use Cases
The monitoring and detection use cases we've looked at so far are relatively simple, but because System Tables can be queried in any language, the options are essentially perimeter-less! Consider the following ideas:
- We could perform static analysis of notebook commands for detecting suspicious behavior or bad practices such as hard-coded secrets, credential leaks, and other examples, as described in our previous blog
- We could combine the data from System Tables with additional data sources like HR systems - for example to automatically flag when people are on vacation, sabbatical, or even have been marked as having left the company but we see unexpected activities
- We could combine the data from System Tables with data sources like
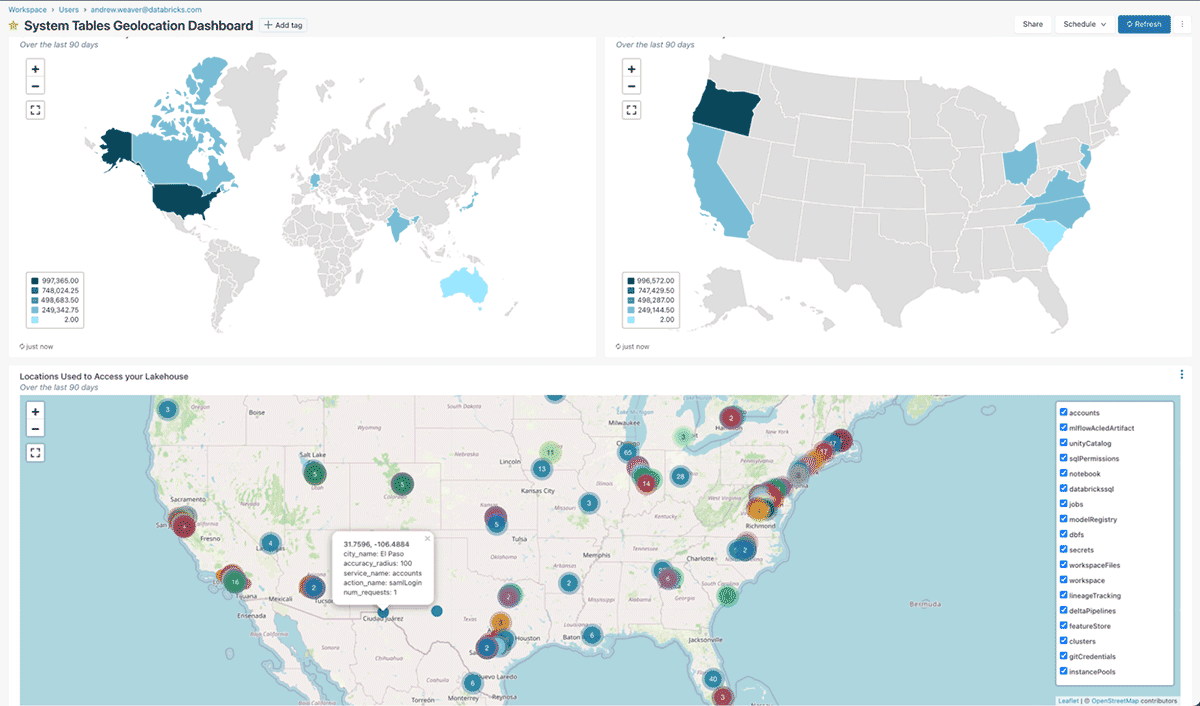
system.information_schemato tailor our monitoring to focus on our most privileged users - We could combine the data from System Tables with Geolocation datasets to monitor compliance against our access and data residency requirements. Take a look at the
geolocation_function_and_queries.sqlnotebook for an example of what this might look like:
- We could fine-tune an LLM model on verbose audit logs to provide a coding-assistant that is tailored to our organization's coding practices
- We could fine-tune an LLM model on a combination of System Tables and data sources like
system.information_schemato provide answers to questions about our data in natural language, to both data teams and business users alike - We could train Unsupervised Learning models to detect anomalous events
Conclusion
In the year since our last blog about audit logging, both the Databricks Lakehouse Platform and the world have changed significantly. Back then, just getting access to the data you needed required a number of steps, before you could even think about how to generate actionable insights. Now, thanks to System Tables all of the data that you need is just a button click away. A Zero Trust Architecture (or Never Trust, Always Verify as it has come to be known) is just one of many use cases that can be powered by System Tables. Check out the docs for AWS and Azure to enable System Tables for your Databricks account today!
Get the latest posts in your inbox
Subscribe to our blog and get the latest posts delivered to your inbox.