Near-real-time IoT Robust Anomaly Detection Framework
Building robust and scalable anomaly detection system for streaming data on Databricks
by Jakub Augustin and Dr. Piotr Majer
1. Introduction
With rapid digitalization of the economy, we experience exponential growth of real-time data being processed by businesses and organizations worldwide. Lots of new observations depict critical metrics, measurements and KPIs that carry essential information about current state of underlying asset, ranging from infrastructure and machinery sensor readings to number of transactions in the online shop. This big data needs to be monitored in real time as sometimes only timely alerting and following rapid action may mitigate risks, lead to new identified business opportunities or decreased potential costs. For example, operating a wind farm and collecting sensor readings from the turbine motor allows us to find broken turbines. Locating the broken machine promptly and providing mechanics with the latest information will significantly reduce the costs (fixing it soon and returning to normal electricity generation) and speed up the repair process, help the market team forecast energy the company will sell or let the supply chain team know in advance which parts should be produced.
Detecting anomalous behavior is not trivial. Outliers are observations that stand out from past history, as if they come from different data sets. In statistical terms, these are data points that come from another distribution that dramatically differs from the past. In the advent of streaming big data, identifying true outliers in the ocean of new arriving information is a really difficult task comparable to finding a needle in a haystack. For that reason, anomaly detection, in particular for real-time applications, has become one of the most common use-cases through the data science and analytics community, attracting significant research attention. Some modern companies already profit from the early detection of anomalous behavior in their operations and use their automated systems to achieve superior value earlier than competitors.
2. Anomaly detection for streaming analytics
Detecting anomalies in close to real time and at scale may offer significant business advantages and deliver value, as one can monitor all aspects of organization and streamline responses to magnitude of challenges. From a technical point of view, however, this requires any such alerting system to be robust, scalable, fast and economically viable. The task of finding real anomalies is extremely complex and difficult. One may need to monitor thousands of time series exhibiting completely different dynamics, which even may change and evolve over time.
Machine learning (ML) using anomaly detection algorithms can solve these problems. However, there are limitations which makes it extremely challenging. Firstly, ML techniques may require significant volumes of historical data, where statistical properties and distribution have not changed significantly over time. This is true of, for example, a model that learns to distinguish pictures of cats or dogs (cats "statistical" characteristics do not change over time). Furthermore, likely for most observations there is no labeled data available for training in the first place and labeling of millions of data points may be quite labor intensive. In the unlikely case that labeled data is available, it is not given that a single model may be sufficient to learn and identify patterns across a variety of observations. Furthermore, taking into account usually more computationally intensive scoring, which may undermine time needed for detection, it makes ML methods rather laborious and risky for robust outlier detection in streaming analytics at scale.
For that reason, leading Big Tech companies have been developing multiple outlier detection modeling techniques that allow for robust detection at scale and close to real time. Nonetheless, simplicity has its price, and each statistical model comes with its own set of strengths and weaknesses. However, applying few techniques in parallel and aggregating the detection, overcomes individual weaknesses and dramatically improves robustness of the entire system. It is also well suitable for a massive parallelism provided by distributed engines like Apache Spark™ and Photon. Such a system can be easily compared to ensemble modeling, e.g., ML Random Forest technique. As a single Decision Tree, each of the learning models offers probably low prediction power. Aggregated together, the system of weak learners acquires higher predictive performance and much better robustness. This is particularly relevant if applied at scale to tens of thousands time series that need monitoring. It may be impossible to develop a single modeling framework that can accommodate all varieties and characteristics, making the system more prone to malfunction. Secondly, keeping the weak learners simple and computationally performant, makes it a framework suitable for close to real-time analytics and streaming applications.
This shall require less infrastructure, driving the costs down and improving ROI of the entire investment.
3. Architecture
Raw data from turbines
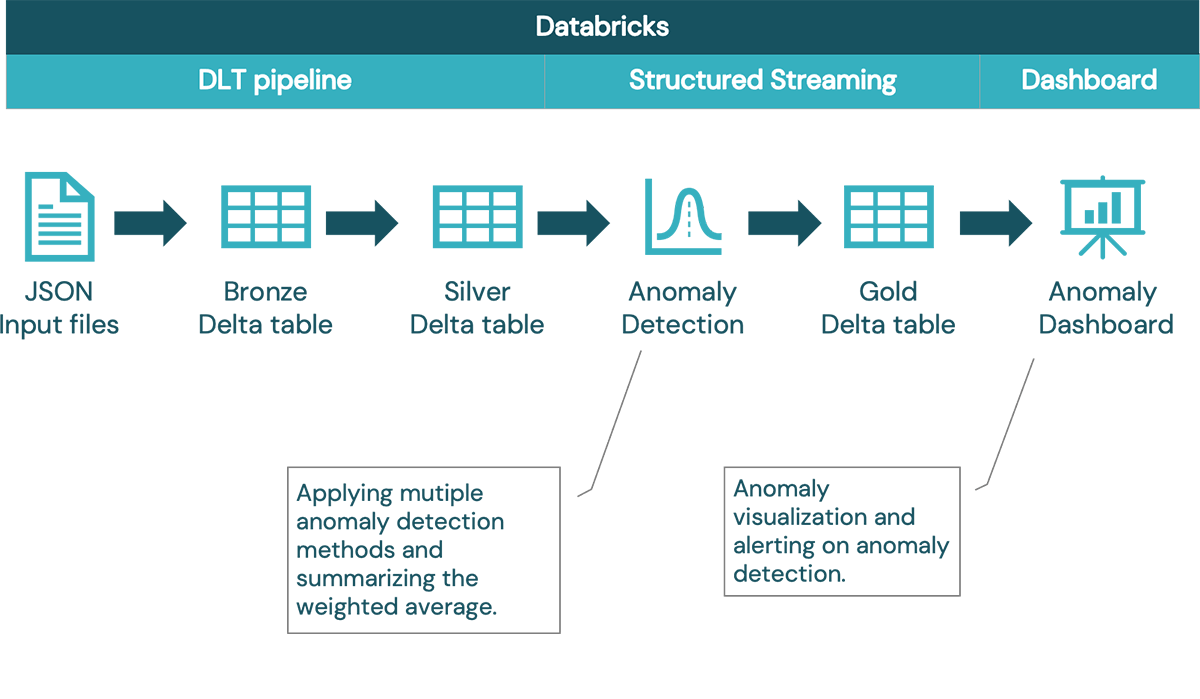
In our case the turbine data is stored as JSON documents to the cloud storage. From there, it is automatically ingested by Autoloader that identifies new files and provides schema inference. In real-life scenarios this step could also be done by reading messages directly from the message queue such as Kafka.
ETL
Delta Live Tables allows us to define declarative ETL pipelines. In our case we are using simple medallion architecture with 3 layers: bronze, silver and gold. The bronze layer represents the raw data without data transformations to allow load reprocessing and to keep the original data. The silver layer represents curated data with a unified data model ready for the anomaly detection process. Finally, the gold data layer represents the final output with indication information whether given observations are considered anomalies or not.
Anomaly detection process
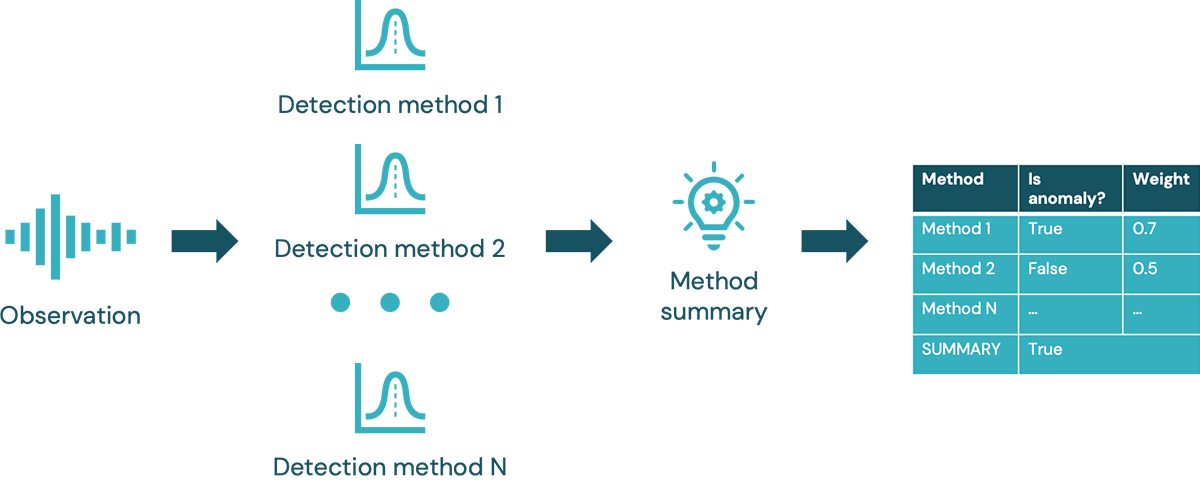
Multiple anomaly detection methods are performed for each observation (method details are discussed in the following paragraph). Each method's detection score is logged and finally aggregated into a unified summary. Weighted voting mechanism is used to determine the summary. Using this approach, additional methods can be added. By using multiple detection methods we can tune the summary either for recall or for precision. Majority voting provides better precision (i.e. if only one of 4 methods detects anomalies, the detection can be ignored). On the other hand, we can tune the summary for best possible recall by reacting to at least one method detection (i.e. at least 1 of 4 methods detects anomalies so we treat the observation as anomaly).
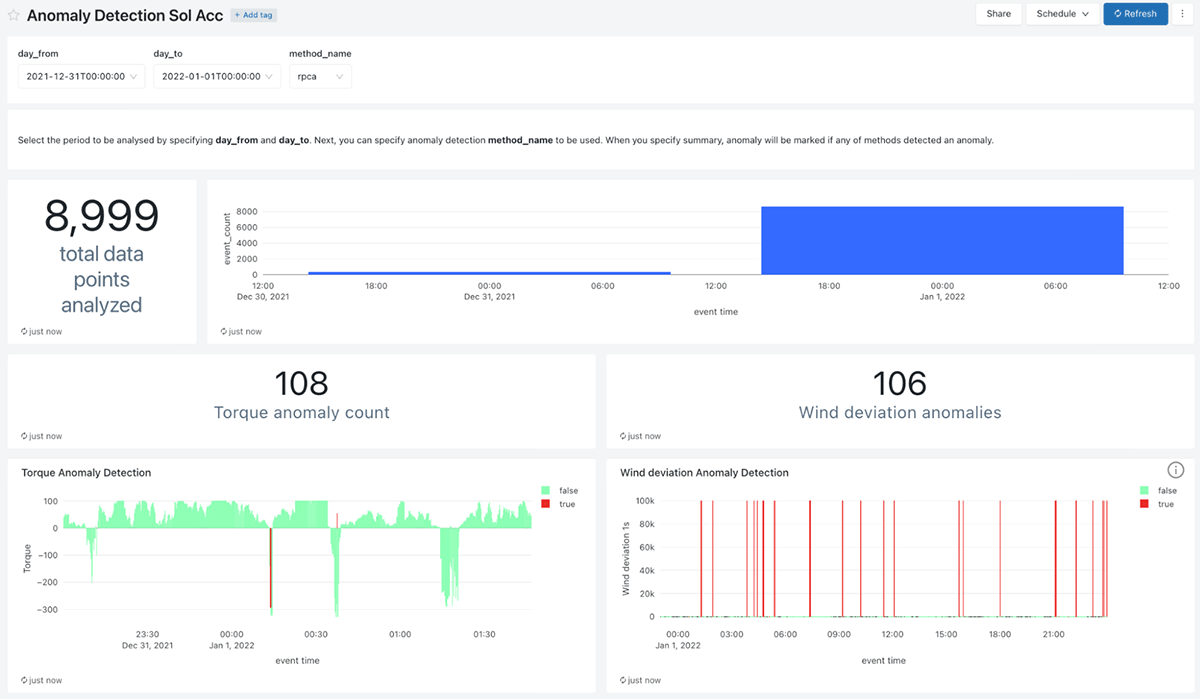
Dashboard
Finally, anomaly detection results are displayed in a graphical dashboard. With Databricks you can create multiple visualizations and refresh the dashboard automatically to display fresh data.
4. Robust outlier detection framework with weak learners
The proposed solution is evaluating incoming streams of data with multiple models. The picked up models differ in their assumptions and modeling approaches. Therefore, acting independently and orthogonally, they should be triggered by different types of anomalies.
Robust PCA stands for Robust Principal Component Analysis (RPCA) is an outlier unsupervised anomaly detection proposed by Netflix. It extends the unsupervised dimension reduction technique PCA by being robust to extreme observations. The anomalies are identified as observations that significantly defy the learnt low-dimensional representation. This technique also allows handling of seasonal data thus making it a natural choice for time series.
Twitter Anomaly Detection is an anomaly detection technique proposed by Twitter based on statistical testing. This algorithm makes use of time series decomposition into trend, seasonality and stochastic components. Therefore, it can accommodate for behavioral/statistical patterns (e.g., daily seasonality in number of tweets) making it particularly useful for big data applications. It is worth mentioning that this anomaly detection algorithm can handle both global and local outliers.
Rolling median absolute deviation is one of the simplest techniques to identify outliers. The basic idea is to understand the typical variability in the data and evaluate every new data point based on these historical patterns. More precisely, it utilizes (robust) median absolute deviations derived in the rolling window of past data and checking if the new observation deviates from the rolling average. If the new entry point breaches the 3.5 deviation rule from historical mean, it is tagged as an anomaly. This model however is incapable of dealing with seasonality and trends and most usually detect spikes in the time series.
Prophet based anomaly detection employs the industry-standard forecasting framework called Prophet and builds upon it to deliver outlier classification. More precisely, new data points are evaluated against the prophet's forecasts with an additional uncertainty buffer. These bounds around each forecast are meant to accommodate the natural stochasticity and variability in the data. Forecasts are derived based on historical information up to (and excluding) the new entries we try to assess. Thus, using historical patterns we predict new observations adding considerable uncertainty bounds. If, however, new entries fall out of these limits, they are identified as anomalies.
Each model is parametrized and may take a different time span of historical data for pattern recognition. The scoring is fully parallelised and thus fully scalable. Moreover, more anomaly detection models may or should be added to the framework to increase adaptiveness and robustness of the solution. In a typical scenario, sensitivity of the framework is driven by the business use case and potential gains of true anomalies detected (money saved on fixing the wind turbine earlier) and false alarms (false positives) that may not only lead to costs but also undermine trust in the solution. Therefore, a majority voting is employed to handle this tradeoff. Here, we emphasize the importance of avoiding false detections and deteriorating credibility of this autonomous system. In particular, in our example only if 2 models (out of 4, 50%) agree on anomalous behavior, the observation is flagged as outlier. This ratio is controlled by the system owner and should be set based on business calculus and number of applied weak learners.
5. Conclusion
In this article, we demonstrated a robust, real-world anomaly detection framework for streaming time series data. The autonomous system is built on Databricks using DLT for the streaming ETL, parallelised with Spark and can be adapted to multiple different IoT scenarios. The new data points are evaluated by multiple techniques and the outliers are identified based on the majority rule, which should decrease the number of false positives. The framework can be easily extended by simply adding more models to the evaluation step, further improving the overall performance or customizing for a particular problem at hand. The result of this workload is displayed in an easy-to-use dashboard, which serves as a control panel for the stakeholders.
Get the latest posts in your inbox
Subscribe to our blog and get the latest posts delivered to your inbox.